The Lillie Mansion at Lutheran
Nursing Home, Assisted Living, Memory Care, Palliative Care, Residential Care & Respite Care · Worcester, MA
CMS overall rating Info CMS (the Centers for Medicare & Medicaid Services) is the federal agency that rates nursing home quality. Its Overall Rating runs from 1 to 5 stars, combining health inspections, staffing, and quality measures, with inspections weighted most heavily.

The Lillie Mansion at Lutheran

Nursing Home, Assisted Living, Memory Care, Palliative Care, Residential Care & Respite Care · Worcester, MA
CMS overall rating Info CMS (the Centers for Medicare & Medicaid Services) is the federal agency that rates nursing home quality. Its Overall Rating runs from 1 to 5 stars, combining health inspections, staffing, and quality measures, with inspections weighted most heavily.
Calculator: See prices in your area
The Lillie Mansion at Lutheran accepts Medicare, Medicaid, and private pay.

Overview of The Lillie Mansion at Lutheran

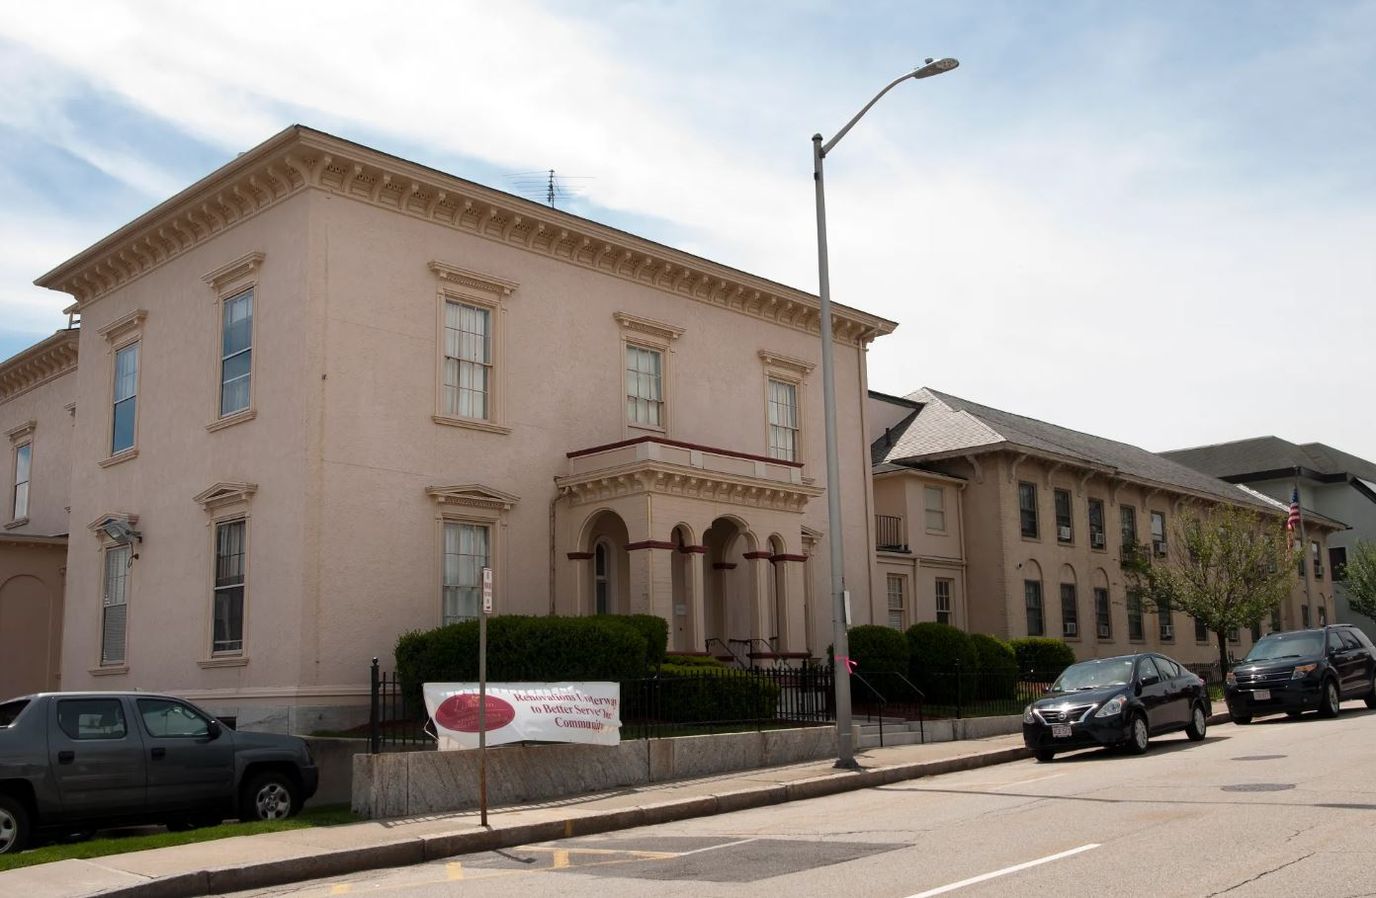
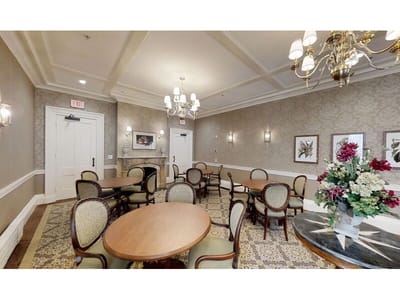
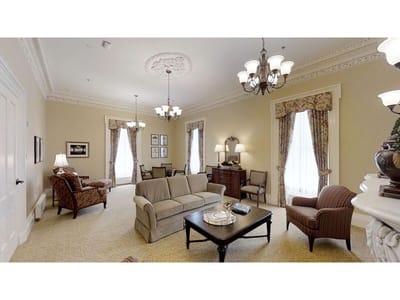
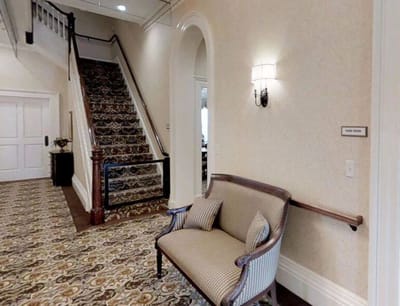
The Lillie Mansion at Lutheran is an independent living community. The home offers a warm and welcoming atmosphere for seniors to feel more comfortable and have a sense of belonging.

They ensure that, as a senior living community, The Little Mansion at Lutheran deeply emphasizes and guarantees that independence is maintained for their residents.

(857) 557-6227

Quality ratings

Measured by Centers for Medicare & Medicaid Services (CMS)

Overall rating Info The Overall CMS Rating combines results from health inspections, staffing levels and quality measures. Health inspections carry the most weight. Staffing and quality scores can increase or decrease the final rating based on performance compared to state and national standards.
▲ 72.4% Above MA avg. ▲ 72.4% Above MA avg.MA average: 2.9Click the badge to see the full State ranking.Click here to see the full State ranking.
Health Inspection Info Based on the results of the facility's three most recent standard inspections and any complaint investigations. CMS reviews the number, scope, and severity of deficiencies, with more recent findings weighted more heavily.
▲ 75.7% Above MA avg. ▲ 75.7% Above MA avg.MA average: 2.8Click the badge to see the full State ranking.Click here to see the full State ranking.
Staffing Info Measures average nursing staff hours per resident per day, including Registered Nurses (RNs) and total nursing staff. Ratings are adjusted based on the level of care residents require and are compared to state and national benchmarks.
▲ 33.3% Above MA avg. ▲ 33.3% Above MA avg.MA average: 3.0Click the badge to see the full State ranking.Click here to see the full State ranking.
Quality Measures Info Based on clinical and physical health indicators reported to CMS, such as hospital readmissions, falls, pressure ulcers, and improvements in mobility. These measures reflect how well residents' health needs are being managed.
▲ 25.8% Above MA avg. ▲ 25.8% Above MA avg.MA average: 3.2Click the badge to see the full State ranking.Click here to see the full State ranking.

Staffing hours breakdown

Info Daily nursing hours per resident by staff type, reported to CMS. Higher is generally better — compare this facility to state and national averages to see where staffing stands.

Hours per resident per day — compared to Massachusetts state averages

Total nursing care / resident Info This home is ranked 19th out of 89 homes in Massachusetts for nurse hours. Total adjusted nursing hours per resident per day, combining RN, LPN, and aide time. CMS adjusts this for case-mix so facilities can be fairly compared.
4h 17m per day
Rank #19 / 89Nurse hours — State benchmarkedThis home is ranked 19th out of 89 homes in Massachusetts. Shows adjusted nurse hours per resident per day benchmarked to the Massachusetts average, with a ranking across 89 Massachusetts facilities. More hours mean more direct care. The national average is about 3.5 hrs; below 3.0 is a red flag.Click the rank badge to see the full State ranking.Click here to see the full State ranking.
This facility Massachusetts avg (3h 56m per day)
vs Massachusetts avg
+9%

2 of 6 metrics below state avg

Standout metric LPN / LVN is +59% above state avg
Staff typeHours / Day / Residentvs state avg
Registered Nurse (RN) Info RNs hold the highest nursing license and can assess residents, interpret test results, and direct care plans. More RN hours per day often signals stronger clinical oversight and faster response to health changes. 31m per day ▼ 22% State avg: 39m per day · National avg: 41m per day
LPN / LVN Info Licensed Practical Nurses (LPNs) or Licensed Vocational Nurses (LVNs) deliver routine hands-on care — medication administration, wound dressing, and monitoring vital signs. They work under RN supervision and make up a large share of daily bedside care. 1h 31m per day ▲ 59% State avg: 57m per day · National avg: 52m per day
Nurse Aide Info Certified Nurse Aides (CNAs) provide the most direct day-to-day assistance: bathing, dressing, feeding, and mobility. Nurse aide hours are typically the largest staffing category and directly affect residents' quality of life. 2h 21m per day ▲ 4% State avg: 2h 16m per day · National avg: 2h 20m per day
Weekend Total Nursing Info Combined nursing hours (RN + LPN + Nurse Aide) per resident per day on weekends. Staffing often drops on weekends — this figure reveals whether the facility maintains adequate coverage outside of weekday hours. 3h 41m per day ▲ 6% State avg: 3h 29m per day · National avg: 3h 27m per day
Physical Therapist Info Hours per resident per day provided by licensed Physical Therapists (PTs) or PT Assistants. PT services help residents recover mobility after injury or illness and are especially important for post-acute (short-stay) rehabilitation. 6m per day ▲ 29% State avg: 5m per day · National avg: 4m per day
Weekend RN Info Registered nurse hours specifically on weekends. Facilities sometimes reduce RN presence on Saturdays and Sundays — a low weekend RN figure compared to weekday hours can indicate reduced clinical oversight when most administrative staff are absent. 15m per day ▼ 44% State avg: 27m per day · National avg: 29m per day

Capacity and availability

This home usually has limited availability

Higher occupancy than the Massachusetts average: 82%
Occupancy rate
93.5% Rank #17 / 92Occupancy rate — State benchmarkedThis home is ranked 17th out of 92 homes in Massachusetts. Shows this facility's occupancy rate versus the Massachusetts average, with its Statewide rank out of 92. Higher occupancy signals strong local demand and financial stability.Click the rank badge to see the full State ranking.Click here to see the full State ranking.
Avg. Length of Stay
147 days
Walk Score
Walk Score: 88 / 100 Rank #63 / 499Walk Score — State benchmarkedThis home is ranked 63rd out of 499 homes in Massachusetts. Shows how walkable this facility's neighborhood is compared to the average Walk Score across Massachusetts facilities. Higher scores benefit residents, families, and staff.Click the rank badge to see the full State ranking.Click here to see the full State ranking.
Very walkable. Most errands can be accomplished on foot, and many essentials are within a short walk.

About this community

Payment & Insurance

1 service
Accept Medicaid

Therapy & Rehabilitation

1 service
Rehabilitation Services

Staffing & Medical

1 service
24-Hour Staffing

Amenities & Lifestyle

Specific ProgramsCenter for Short-term Rehabilitation, Hispanic and Latino Welcome Program, Namaste Care Program, Veteran Welcome Program, Activities Program, Customer Service Concierge Program, Outpatient Rehab

Contact The Lillie Mansion at Lutheran

Staffing Data

Reporting period: October 1 – December 31, 2025 (Q4 2025). Source: CMS Payroll-Based Journal report.

Total staff 184
Employees 158
Contractors 26
Staff to resident ratio 1.79 : 1
8% more staff per resident than Massachusetts average
Massachusetts average ratio: 1.66 : 1 Massachusetts average ratio: 1.66 : 1See full Massachusetts ranking
Avg staff/day 70
Average shift 7.4 hours
6% worse than Massachusetts average
Massachusetts average: 7.9 hours Massachusetts average shift: 7.9 hoursSee full Massachusetts ranking
Total staff hours (quarter) 47,802

Nursing staff breakdown

Q4 2025 · Oct 1 – Dec 31 More info This data comes from the CMS Payroll-Based Journal report covering October 1 – December 31, 2025.
Registered Nurse

Manages medical care and health needs.

RN Staff Info 19 total: 11 full-time employees and 8 contractors. 19
Average shift length Info Average shift length. Calculated as total hours divided by days worked and average staff per day. 7.7 hours
Licensed Practical Nurse

Assists with medical care and medications.

LPN Staff Info 49 total: 39 full-time employees and 10 contractors. 49
Average shift length Info Average shift length. Calculated as total hours divided by days worked and average staff per day. 8 hours
Certified Nursing Assistant

Helps with daily care and mobility.

CNA Staff Info 74 total: 72 full-time employees and 2 contractors. 74
Average shift length Info Average shift length. Calculated as total hours divided by days worked and average staff per day. 7.4 hours

Contractor staffing

Q4 2025 · Oct 1 – Dec 31 More info This data comes from the CMS Payroll-Based Journal report covering October 1 – December 31, 2025.

Total hours from contractors

1.8%

841 contractor hours this quarter

Licensed Practical Nurse: 10 Registered Nurse: 8 Certified Nursing Assistant: 2 Respiratory Therapy Technician: 2 Occupational Therapy Aide: 1 Clinical Nurse Specialist: 1 RN Director of Nursing: 1 Occupational Therapy Assistant: 1

Staff by category

Q4 2025 · Oct 1 – Dec 31 More info This data comes from the CMS Payroll-Based Journal report covering October 1 – December 31, 2025.
Certified Nursing Assistant7227422,05192100%7.4
Licensed Practical Nurse39104911,87392100%8
Registered Nurse118192,83192100%7.7
RN Director of Nursing5162,3876672%8
Other Dietary Services Staff9091,80392100%5.6
Clinical Nurse Specialist3141,4866571%8
Respiratory Therapy Technician3259217278%6.5
Physical Therapy Assistant2027958289%7
Physical Therapy Aide4047348896%5.9
Mental Health Service Worker4046797986%6.2
Qualified Social Worker2025527278%6.4
Administrator1015446874%8
Speech Language Pathologist2024726672%6.3
Nurse Practitioner1014725964%8
Occupational Therapy Aide0111763235%5.5
Occupational Therapy Assistant0112767%4.5
74 Certified Nursing Assistant
% of Days 100%
49 Licensed Practical Nurse
% of Days 100%
19 Registered Nurse
% of Days 100%
6 RN Director of Nursing
% of Days 72%
9 Other Dietary Services Staff
% of Days 100%
4 Clinical Nurse Specialist
% of Days 71%
5 Respiratory Therapy Technician
% of Days 78%
2 Physical Therapy Assistant
% of Days 89%
4 Physical Therapy Aide
% of Days 96%
4 Mental Health Service Worker
% of Days 86%
2 Qualified Social Worker
% of Days 78%
1 Administrator
% of Days 74%
2 Speech Language Pathologist
% of Days 72%
1 Nurse Practitioner
% of Days 64%
1 Occupational Therapy Aide
% of Days 35%
1 Occupational Therapy Assistant
% of Days 7%

Penalties and fines

Federal penalties imposed by CMS for regulatory violations, including civil money penalties (fines) and denials of payment for new Medicare/Medicaid admissions.

Source: CMS Penalties Database (Data as of Jan 2026)

Total fines amount $8K Rank #34 / 90Federal fines — State benchmarkedThis home is ranked 34th out of 90 homes in Massachusetts. Shows this facility's cumulative CMS federal fine dollars versus the Massachusetts average among facilities with fines, and where it ranks among 90 facilities in the pool. Lower total dollars mean a better rank.Click the rank badge to see the full State ranking.Click here to see the full State ranking.
89% lower than Massachusetts average

Massachusetts average: $72K

Number of fines 1
42% fewer fines than Massachusetts average

Massachusetts average: 1.7

Payment Denials Info Serious action where Medicare and/or Medicaid temporarily stops payments for new residents until issues are fixed. 0
100% fewer payment denials than Massachusetts average

Massachusetts average: 0.1

Fines amount comparison
This facility $8K
Massachusetts average $72K

No penalties in the past 3 years

No civil money penalties or payment denials were reported in the last 3 years.

Quality of care over time

These measures show how residents usually do over time at this home, based on health outcomes and preventive care.

High-risk clinical events score Info A composite score based on pressure ulcers, falls with injury, weight loss, walking ability decline, and activities of daily living decline. 7.2
29% better than Massachusetts average

Massachusetts average: 10.2

Functional decline score Info A composite score based on activities of daily living decline, walking ability decline, and incontinence. 16.3
18% better than Massachusetts average

Massachusetts average: 20.0

Long-stay resident measures
Need for Help with Daily Activities Increased Info Percent of long-stay residents whose need for help with daily activities has increased 9.5%
49% better than Massachusetts average

Massachusetts average: 18.7%

Walking Ability Worsened Info Percent of long-stay residents whose ability to move independently worsened 14.6%
24% better than Massachusetts average

Massachusetts average: 19.3%

Low Risk Residents with Bowel/Bladder Incontinence Info Percent of low risk long-stay residents who lose control of their bowels or bladder 24.9%
13% worse than Massachusetts average

Massachusetts average: 22.1%

Falls with Major Injury Info Percent of long-stay residents experiencing one or more falls with major injury 3.4%
6% better than Massachusetts average

Massachusetts average: 3.6%

High Risk Residents with Pressure Ulcers Info Percent of long-stay high risk residents with pressure ulcers 2.9%
38% better than Massachusetts average

Massachusetts average: 4.7%

Urinary Tract Infection Info Percent of long-stay residents with a urinary tract infection 2.3%
10% worse than Massachusetts average

Massachusetts average: 2.1%

Lost Too Much Weight Info Percent of long-stay residents who lose too much weight 5.9%
13% worse than Massachusetts average

Massachusetts average: 5.2%

Depressive Symptoms Info Percent of long-stay residents who have depressive symptoms 0.3%
97% better than Massachusetts average

Massachusetts average: 10.7%

Antipsychotic Use Info Percent of long-stay residents who received an antipsychotic medication 18.2%
10% better than Massachusetts average

Massachusetts average: 20.3%

Pneumococcal Vaccine Info Percent of long-stay residents assessed and appropriately given the pneumococcal vaccine 100.0%
9% better than Massachusetts average

Massachusetts average: 91.9%

Influenza Vaccine Info Percent of long-stay residents assessed and appropriately given the seasonal influenza vaccine 100.0%
5% better than Massachusetts average

Massachusetts average: 94.8%

Short-stay resident measures
Pneumococcal Vaccine Info Percent of short-stay residents assessed and appropriately given the pneumococcal vaccine 95.8%
25% better than Massachusetts average

Massachusetts average: 76.7%

Antipsychotic medication increase Info Percent of short-stay residents who newly received an antipsychotic medication 1.4%
6% worse than Massachusetts average

Massachusetts average: 1.3%

Influenza Vaccine Info Percent of short-stay residents assessed and appropriately given the seasonal influenza vaccine 94.9%
22% better than Massachusetts average

Massachusetts average: 77.7%

Breakdown by payment type

Medicare

33% of new residents, usually for short-term rehab.

Typical stay 27 days

Private pay

57% of new residents, often for short stays.

Typical stay 4 - 5 months

Medicaid

10% of new residents, often for long-term daily care.

Typical stay 3 years

Facility Characteristics

Source: CMS Long-Term Care Facility Characteristics (Data as of Jan 2026)

Total residents 103
Medicare
9
8.7% of residents
Medicaid
50
48.5% of residents
Private pay or other
44
42.7% of residents
Programs & Services
Residents Group

Residents meet regularly to discuss policies, care quality, and activities

Family Member Group

Family members meet regularly to discuss policies, care quality, and activities

Active Family Council

Organized group of family members that meets regularly to discuss facility policies, resident care, and activities.

Active Resident Council

Organized group of residents that meets regularly to discuss facility policies, quality of life, and activities.

Finances and operations

Based on the 2024 CMS SNF Cost Report.

Governmental community
Operated by a subsidized facility district.
Home revenue
$24.3M
Surplus of revenue
$489.8K
Governmental community Operated by a subsidized facility district.
Home revenue
$24.3M Rank #29 / 92Revenue — State benchmarkedThis home is ranked 29th out of 92 homes in Massachusetts. Shows this facility's annual revenue compared to the Massachusetts average. Higher revenue generally means more resources for staffing and capital — read alongside Payroll %.Click the rank badge to see the full State ranking.Click here to see the full State ranking.
Surplus of revenue
$489.8K
Payroll costs Info The portion of the home's budget spent on staff, including nurses, caregivers, and other employees who support care and operations. Rank #43 / 92Payroll — State benchmarkedThis home is ranked 43rd out of 92 homes in Massachusetts. Shows total annual staff payroll benchmarked to the Massachusetts average. Higher payroll investment relative to peers often signals better staffing and less reliance on cheaper contract labor.Click the rank badge to see the full State ranking.Click here to see the full State ranking.
$10.5M
43.4% of revenue Rank #70 / 92Payroll % — State benchmarkedThis home is ranked 70th out of 92 homes in Massachusetts. Shows payroll as a percentage of revenue versus the Massachusetts average. Well-run Massachusetts facilities typically land around 54–65% — the top third Statewide. Below 25% may signal understaffing or heavy agency use — read with Staffing ratings.Click the rank badge to see the full State ranking.Click here to see the full State ranking.
Other operating costs Info All remaining costs needed to run the home, such as food, utilities, building maintenance, supplies and administrative expenses.
$13.2M
Total costs $23.8M

What does this home offer?

Minimum age icon
Minimum age icon

Minimum Age: 55 Years Old

Pets allowed icon
Pets allowed icon

Pets Allowed

Fitness and recreation icon

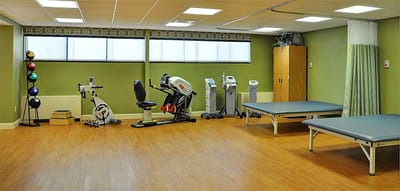
Fitness and Recreation

Who this home usually serves

TYPE OF STAY

Mix of rehab and long-term care

This home supports both short-term rehab and long-term care, with residents staying for a wide range of durations.

Most new residents arrive under private pay (57% of admissions), and a typical private pay stay runs around 4 - 5 months.

Admissions
258 total

Coverage residents most often arrive under.

Medicare 33%
Private pay 57%
Medicaid 10%
Discharges
271 total

Coverage residents most often leave under.

Medicare 29%
Private pay 47%
Medicaid 24%

Places of interest near The Lillie Mansion at Lutheran

Address 0.6 miles from city center Info Estimated distance in miles from Worcester's city center to The Lillie Mansion at Lutheran's address, calculated via Google Maps. — 0.35 miles to nearest hospital (Saint Vincent Hospital)

Calculate Travel Distance to The Lillie Mansion at Lutheran

Add your location

Address

Financial Assistance for
Nursing Home in Massachusetts

The Lillie Mansion at Lutheran is located in Worcester, Massachusetts.
Here are the financial assistance programs available to residents in Massachusetts.

Get Financial aid guidance

Home Care Program

MassHealth Home Care

Age 60+
General Massachusetts resident, at risk of nursing home placement.
Income Limits (2025) ~$1,500/month individual, varies by region
Asset Limits $2,000 individual, excludes home, car
MA

Coordinated through Aging Services Access Points (ASAPs); high demand in urban areas.

Benefits
In-home care (3-5 hours/day) Homemaker services Respite care (up to 14 days/year) Adult day care (~$75/day)

Frail Elder Waiver

Massachusetts Medicaid FE Waiver

Age 65+
General Massachusetts resident, Medicaid-eligible, nursing home-level care need.
Income Limits (2025) ~$2,829/month 300% FBR, individual
Asset Limits $2,000 (individual), $3,000 (couple).
MA

Requires clinical eligibility determination.

Benefits
Personal care (5-7 hours/day) Respite care (240 hours/year) Adult day care (~$75/day) Home health services

Senior Care Options (SCO)

Massachusetts Senior Care Options

Age 65+
General Massachusetts resident, eligible for MassHealth (Medicare optional), nursing home-level care need.
Income Limits (2025) ~$2,829/month (300% FBR, individual); QIT allowed.
Asset Limits $2,000 (individual), $3,000 (couple) (excludes home up to $713,000, car).
MA

Not available in Dukes/Nantucket Counties; multiple SCO providers (e.g., CCA, Tufts).

Benefits
Personal care (5-7 hours/day) Medical care Respite (240 hours/year) Adult

Medicare Savings Program (MSP)

Massachusetts Medicare Savings Program (MassHealth Buy-In)

Age 65+ or disabled
General Massachusetts resident, Medicare Part A/B.
Income Limits (2025) ~$2,510/month (QMB), ~$3,380/month (SLMB), ~$3,598/month (QI)—individual.
Asset Limits $9,430 (individual), $14,130 (couple).
MA

Three tiers; no waitlist; includes Extra Help for Part D.

Benefits
Covers Part B premiums ($174.70/month) Deductibles ($240/year) Copays (~20%)

National Family Caregiver Support Program (NFCSP) Respite

Massachusetts NFCSP Respite Care

Age
General Caregivers of 60+ needing care or 55+ caregivers of others; Massachusetts resident; functional needs (2+ ADLs).
Income Limits (2025) Prioritizes ~$24,980/year (individual); no strict cap.
Asset Limits Not assessed; need-based.
MA

27 ASAPs; prioritizes low-income, rural caregivers.

Benefits
Respite (4-6 hours/week or 5 days/year) Adult day care ($60/day) Caregiver training Supplies (~$500/year)

Prescription Advantage

Massachusetts Prescription Advantage

Age 65+ or disabled
General Massachusetts resident, enrolled in Medicare Part D (or ineligible for Medicare).
Income Limits (2025) No strict limit; copays vary by income ~$24,980-$75,000/year individual
Asset Limits Not assessed.
MA

Supplements Medicare Part D; no enrollment fee for low-income.

Benefits
Covers prescription copays ($5-$40/drug) Fills coverage gaps Catastrophic cost protection ($4,000+ covered)

VA Aid and Attendance (A&A) and Housebound Benefits

Massachusetts VA Aid and Attendance/Housebound

Age 65+ or disabled veteran/spouse
General Massachusetts resident, wartime service, need for ADL help (A&A) or homebound.
Income Limits (2025) Net income < ~$1,984/month (veteran with dependent, A&A); pension offsets income.
Asset Limits ~$155,356 net worth limit
MA

High veteran demand statewide.

Benefits
Cash (~$1,433-$2,642/month veteran, ~$951-$1,318 spouse) for care costs (e.g., in-home, assisted living)

Compare Nursing Home around Worcester

The information below is reported by the Massachusetts Executive Office of Elder Affairs and Department of Public Health.

5 facilities compared · CMS & MA Dept. of Health data

The Lillie Mansion at Lutheran
NH

Nursing Home Licensed facility providing 24/7 skilled nursing care for residents with complex, ongoing medical needs. Staffed by RNs, LPNs, and CNAs. Inspected and star-rated annually by CMS. Accepts Medicare (short-term rehab) and Medicaid (long-term care).

AL

Assisted Living A licensed, long-term care setting for seniors or individuals with disabilities who need help with daily activities — like bathing, dressing, and medication management — but not 24-hour skilled nursing. Offers housing, meals, and around-the-clock support while aiming to maximize resident independence.

MC

Memory Care Secured, specialized care for people living with Alzheimer's or dementia. Staff trained in cognitive impairment, with higher staff-to-resident ratios and an environment designed to reduce confusion and wandering risk.

PC

Palliative Care

RC

Respite Care Short-term temporary care — days to weeks — to give family caregivers a break. Full care provided during the stay. Often used after hospitalization or to trial a facility before a permanent placement decision.

RC

Respite Care Short-term temporary care — days to weeks — to give family caregivers a break. Full care provided during the stay. Often used after hospitalization or to trial a facility before a permanent placement decision.

Worcester (Central Business District)
150
Facility 150
MA AVG 94
Rank #29 / 280
93.5%
Facility 93.5%
MA AVG 82%
Rank #17 / 92
+14%
4.28
Facility 4.28
MA AVG 3.93
Rank #19 / 89
-19%+9%
$0
Facility $0
MA AVG $76.6k
Rank #34 / 90
11
Facility 11
MA AVG 32.7
Rank #9 / 89
5.5
Facility 5.5
MA AVG 7.2
Rank #38 / 89
1102-
88
Facility 88
MA AVG 53
Rank #63 / 499
Frederic Jenoure
$24.3M
Facility $24.3M
MA AVG $17.4M
Rank #29 / 92
$10.5M
Facility $10.5M
MA AVG $6.5M
Rank #43 / 92
43.4%
Facility 43.4%
MA AVG 43.6%
Rank #70 / 92
225379
Holy Trinity Nursing and Rehabilitation Center
NH

Nursing Home Licensed facility providing 24/7 skilled nursing care for residents with complex, ongoing medical needs. Staffed by RNs, LPNs, and CNAs. Inspected and star-rated annually by CMS. Accepts Medicare (short-term rehab) and Medicaid (long-term care).

RC

Respite Care Short-term temporary care — days to weeks — to give family caregivers a break. Full care provided during the stay. Often used after hospitalization or to trial a facility before a permanent placement decision.

Worcester (Indian Lake East)
113
Facility 113
MA AVG 94
Rank #74 / 280
85.0%
Facility 85.0%
MA AVG 82%
Rank #47 / 92
+4%
3.97
Facility 3.97
MA AVG 3.93
Rank #36 / 89
-44%+1%
$0
Facility $0
MA AVG $76.6k
Rank #64 / 90
10
Facility 10
MA AVG 32.7
Rank #8 / 89
3.3
Facility 3.3
MA AVG 7.2
Rank #10 / 89
2102-
59
Facility 59
MA AVG 53
Rank #220 / 499
Nicholas Apostola
$18.7M
Facility $18.7M
MA AVG $17.4M
Rank #54 / 92
$10.3M
Facility $10.3M
MA AVG $6.5M
Rank #45 / 92
55.3%
Facility 55.3%
MA AVG 43.6%
Rank #26 / 92
225648
The Jewish Healthcare Center
NH

Nursing Home Licensed facility providing 24/7 skilled nursing care for residents with complex, ongoing medical needs. Staffed by RNs, LPNs, and CNAs. Inspected and star-rated annually by CMS. Accepts Medicare (short-term rehab) and Medicaid (long-term care).

AL

Assisted Living A licensed, long-term care setting for seniors or individuals with disabilities who need help with daily activities — like bathing, dressing, and medication management — but not 24-hour skilled nursing. Offers housing, meals, and around-the-clock support while aiming to maximize resident independence.

HC

Home Care Professional care delivered in the person's own home — from companionship and errands to skilled nursing and therapy. Allows seniors to age in place. Medicare covers skilled home health when medically necessary.

HC

Home Care Professional care delivered in the person's own home — from companionship and errands to skilled nursing and therapy. Allows seniors to age in place. Medicare covers skilled home health when medically necessary.

NC

Nursing Care

Worcester (West Tatnuck)
141
Facility 141
MA AVG 94
Rank #37 / 280
91.8%
Facility 91.8%
MA AVG 82%
Rank #23 / 92
+12%
4.47
Facility 4.47
MA AVG 3.93
Rank #13 / 89
-31%+14%
$10.5k
Facility $10.5k
MA AVG $76.6k
Rank #60 / 90
23
Facility 23
MA AVG 32.7
Rank #38 / 89
4.6
Facility 4.6
MA AVG 7.2
Rank #26 / 89
3132-
12
Facility 12
MA AVG 53
Rank #456 / 499
Jay Aframe
$24.0M
Facility $24.0M
MA AVG $17.4M
Rank #30 / 92
$17.3M
Facility $17.3M
MA AVG $6.5M
Rank #7 / 92
72%
Facility 72%
MA AVG 43.6%
Rank #5 / 92
225173
Notre Dame du Lac
NH

Nursing Home Licensed facility providing 24/7 skilled nursing care for residents with complex, ongoing medical needs. Staffed by RNs, LPNs, and CNAs. Inspected and star-rated annually by CMS. Accepts Medicare (short-term rehab) and Medicaid (long-term care).

AL

Assisted Living A licensed, long-term care setting for seniors or individuals with disabilities who need help with daily activities — like bathing, dressing, and medication management — but not 24-hour skilled nursing. Offers housing, meals, and around-the-clock support while aiming to maximize resident independence.

HC

Home Care Professional care delivered in the person's own home — from companionship and errands to skilled nursing and therapy. Allows seniors to age in place. Medicare covers skilled home health when medically necessary.

MC

Memory Care Secured, specialized care for people living with Alzheimer's or dementia. Staff trained in cognitive impairment, with higher staff-to-resident ratios and an environment designed to reduce confusion and wandering risk.

NC

Nursing Care

PC

Palliative Care

RC

Respite Care Short-term temporary care — days to weeks — to give family caregivers a break. Full care provided during the stay. Often used after hospitalization or to trial a facility before a permanent placement decision.

Worcester (Booth Apartments Area)
110
Facility 110
MA AVG 94
Rank #80 / 280
95.6%
Facility 95.6%
MA AVG 82%
Rank #9 / 92
+17%
4.14
Facility 4.14
MA AVG 3.93
Rank #30 / 89
-5%+5%
$0
Facility $0
MA AVG $76.6k
Rank #1 / 90
16
Facility 16
MA AVG 32.7
Rank #23 / 89
4.0
Facility 4.0
MA AVG 7.2
Rank #18 / 89
-118-
13
Facility 13
MA AVG 53
Rank #450 / 499
Ellen Agritelley
$21.4M
Facility $21.4M
MA AVG $17.4M
Rank #43 / 92
$13.3M
Facility $13.3M
MA AVG $6.5M
Rank #22 / 92
62.4%
Facility 62.4%
MA AVG 43.6%
Rank #15 / 92
225577
Parsons Hill Rehabilitation and Health Care Center
NH

Nursing Home Licensed facility providing 24/7 skilled nursing care for residents with complex, ongoing medical needs. Staffed by RNs, LPNs, and CNAs. Inspected and star-rated annually by CMS. Accepts Medicare (short-term rehab) and Medicaid (long-term care).

HC

Home Care Professional care delivered in the person's own home — from companionship and errands to skilled nursing and therapy. Allows seniors to age in place. Medicare covers skilled home health when medically necessary.

NC

Nursing Care

RC

Respite Care Short-term temporary care — days to weeks — to give family caregivers a break. Full care provided during the stay. Often used after hospitalization or to trial a facility before a permanent placement decision.

Worcester (Webster Square)
162
Facility 162
MA AVG 94
Rank #21 / 280
91.4%
Facility 91.4%
MA AVG 82%
Rank #26 / 92
+11%
3.50
Facility 3.50
MA AVG 3.93
Rank #69 / 89
-75%-11%
$0
Facility $0
MA AVG $76.6k
Rank #1 / 90
50
Facility 50
MA AVG 32.7
Rank #78 / 89
6.3
Facility 6.3
MA AVG 7.2
Rank #50 / 89
-149-
76
Facility 76
MA AVG 53
Rank #146 / 499
-
$30.0M
Facility $30.0M
MA AVG $17.4M
Rank #15 / 92
$12.3M
Facility $12.3M
MA AVG $6.5M
Rank #26 / 92
41.1%
Facility 41.1%
MA AVG 43.6%
Rank #79 / 92
225390

Frequently Asked Questions about The Lillie Mansion at Lutheran

What neighborhood is The Lillie Mansion at Lutheran in?

The Lillie Mansion at Lutheran is in the Central Business District neighborhood.

Is The Lillie Mansion at Lutheran in a walkable area?

The Lillie Mansion at Lutheran has a walk score of 88. Very walkable. Most errands can be accomplished on foot, and many essentials are within a short walk.

What is the occupancy rate at The Lillie Mansion at Lutheran?

The Lillie Mansion at Lutheran's occupancy is 93.5%.

Are there photos of The Lillie Mansion at Lutheran?

Yes — there are 18 photos of The Lillie Mansion at Lutheran in the photo gallery on this page.

What is the phone number of The Lillie Mansion at Lutheran?

(857) 557-6227 will put you in contact with the team at The Lillie Mansion at Lutheran.

Is The Lillie Mansion at Lutheran Medicare or Medicaid certified?

Yes — The Lillie Mansion at Lutheran is a CMS-certified provider of Medicare and Medicaid.

Guides for Better Senior Living

Care Cost Calculator: See Prices in Your Area

Nursing Home Data Explorer

Don’t Wait Too Long: 7 Red Flag Signs Your Parent Needs Assisted Living Now

The True Cost of Assisted Living in 2025 – And How Families Are Paying For It

Understanding Senior Living Costs: Pricing Models, Discounts & Financial Assistance

Explore Open Rooms
1 Contact details
2 What type of senior care service are you looking for?
3 What budget do you have in mind for senior care?
4 How soon do you need to find care?
5 Additional details

Thank you for your interest!

Our team will be in touch shortly to help with next steps.