Ross Manor
Nursing Home, Assisted Living, Hospice Care, Memory Care & Nursing Care · Bangor, ME
CMS overall rating Info CMS (the Centers for Medicare & Medicaid Services) is the federal agency that rates nursing home quality. Its Overall Rating runs from 1 to 5 stars, combining health inspections, staffing, and quality measures, with inspections weighted most heavily.

Ross Manor

Nursing Home, Assisted Living, Hospice Care, Memory Care & Nursing Care · Bangor, ME
CMS overall rating Info CMS (the Centers for Medicare & Medicaid Services) is the federal agency that rates nursing home quality. Its Overall Rating runs from 1 to 5 stars, combining health inspections, staffing, and quality measures, with inspections weighted most heavily.
Calculator: See prices in your area
Ross Manor accepts Medicare, Medicaid, and private pay.

Overview of Ross Manor

Seventy-one days: that is the average length of stay at Ross Manor, a nursing home in Bangor, Maine, and it shows the facility is built for people recovering from surgery or illness, working through rehab, and moving back home. The 90.5% occupancy rate confirms the beds are in steady use.

The care model maps onto that pattern, where skilled rehabilitation and complete nursing home care are both on the program list, along with a memory-impaired living track that extends the facility’s reach to residents with longer-term needs. A doctor is on staff and nursing coverage runs around the clock.

Staffing breaks down to 4 hours 37 minutes of total nursing care per resident per day. Registered nurses account for 1 hour 12 minutes of that; nurse aides contribute 2 hours 57 minutes. The neighborhood sits at a Walk Score of 51, moderately walkable, with some errands accessible on foot and a reasonable mix of nearby amenities for family visiting.

Ross Manor accepts Medicare, Medicaid, and private pay, covering the coverage pathways most relevant to short-stay rehabilitation and longer nursing care alike. What we find is a facility with a short-stay rehabilitation core, supplemented by the capacity to hold residents who need ongoing care after recovery stalls or isn’t possible.

Quality ratings

Measured by Centers for Medicare & Medicaid Services (CMS)

Overall rating Info The Overall CMS Rating combines results from health inspections, staffing levels and quality measures. Health inspections carry the most weight. Staffing and quality scores can increase or decrease the final rating based on performance compared to state and national standards.
▲ 64.5% Above ME avg. ▲ 64.5% Above ME avg.ME average: 3.0Click the badge to see the full State ranking.Click here to see the full State ranking.
Health Inspection Info Based on the results of the facility's three most recent standard inspections and any complaint investigations. CMS reviews the number, scope, and severity of deficiencies, with more recent findings weighted more heavily.
▲ 40.6% Above ME avg. ▲ 40.6% Above ME avg.ME average: 2.8Click the badge to see the full State ranking.Click here to see the full State ranking.
Staffing Info Measures average nursing staff hours per resident per day, including Registered Nurses (RNs) and total nursing staff. Ratings are adjusted based on the level of care residents require and are compared to state and national benchmarks.
▲ 26.2% Above ME avg. ▲ 26.2% Above ME avg.ME average: 4.0Click the badge to see the full State ranking.Click here to see the full State ranking.
Quality Measures Info Based on clinical and physical health indicators reported to CMS, such as hospital readmissions, falls, pressure ulcers, and improvements in mobility. These measures reflect how well residents' health needs are being managed.
▼ 26.7% Below ME avg. ▼ 26.7% Below ME avg.ME average: 2.7Click the badge to see the full State ranking.Click here to see the full State ranking.

Staffing hours breakdown

Info Daily nursing hours per resident by staff type, reported to CMS. Higher is generally better — compare this facility to state and national averages to see where staffing stands.

Hours per resident per day — compared to Maine state averages

Total nursing care / resident Info This home is ranked 11th out of 34 homes in Maine for nurse hours. Total adjusted nursing hours per resident per day, combining RN, LPN, and aide time. CMS adjusts this for case-mix so facilities can be fairly compared.
4h 37m per day
Rank #11 / 34Nurse hours — State benchmarkedThis home is ranked 11th out of 34 homes in Maine. Shows adjusted nurse hours per resident per day benchmarked to the Maine average, with a ranking across 34 Maine facilities. More hours mean more direct care. The national average is about 3.5 hrs; below 3.0 is a red flag.Rankings are based only on facilities in Maine that report data for that category. Facilities without available data are excluded from the ranking.Click the rank badge to see the full State ranking.Click here to see the full State ranking.
This facility Maine avg (4h 30m per day)
vs Maine avg
+2%

2 of 6 metrics below state avg

Standout metric Weekend RN is +16% above state avg
Staff typeHours / Day / Residentvs state avg
Registered Nurse (RN) Info RNs hold the highest nursing license and can assess residents, interpret test results, and direct care plans. More RN hours per day often signals stronger clinical oversight and faster response to health changes. 1h 12m per day ▲ 15% State avg: 1h 3m per day · National avg: 41m per day
LPN / LVN Info Licensed Practical Nurses (LPNs) or Licensed Vocational Nurses (LVNs) deliver routine hands-on care — medication administration, wound dressing, and monitoring vital signs. They work under RN supervision and make up a large share of daily bedside care. 19m per day ▼ 32% State avg: 28m per day · National avg: 52m per day
Nurse Aide Info Certified Nurse Aides (CNAs) provide the most direct day-to-day assistance: bathing, dressing, feeding, and mobility. Nurse aide hours are typically the largest staffing category and directly affect residents' quality of life. 2h 57m per day ▲ 4% State avg: 2h 49m per day · National avg: 2h 20m per day
Weekend Total Nursing Info Combined nursing hours (RN + LPN + Nurse Aide) per resident per day on weekends. Staffing often drops on weekends — this figure reveals whether the facility maintains adequate coverage outside of weekday hours. 4h 1m per day ■ Avg State avg: 3h 59m per day · National avg: 3h 27m per day
Physical Therapist Info Hours per resident per day provided by licensed Physical Therapists (PTs) or PT Assistants. PT services help residents recover mobility after injury or illness and are especially important for post-acute (short-stay) rehabilitation. 2m per day ▼ 43% State avg: 4m per day · National avg: 4m per day
Weekend RN Info Registered nurse hours specifically on weekends. Facilities sometimes reduce RN presence on Saturdays and Sundays — a low weekend RN figure compared to weekday hours can indicate reduced clinical oversight when most administrative staff are absent. 52m per day ▲ 16% State avg: 45m per day · National avg: 29m per day

Capacity and availability

Medium-capacity home

Offers a balance of services and community atmosphere.

Total beds 103

This home usually has limited availability

Higher occupancy than the Maine average: 83.1%
Occupancy rate
90.5% Rank #145 / 251Occupancy rate — State benchmarkedThis home is ranked 145th out of 251 homes in Maine. Shows this facility's occupancy rate versus the Maine average, with its Statewide rank out of 251. Higher occupancy signals strong local demand and financial stability.Rankings are based only on facilities in Maine that report data for that category. Facilities without available data are excluded from the ranking.Click the rank badge to see the full State ranking.Click here to see the full State ranking.
Avg. Length of Stay
71 days
Walk Score
Walk Score: 51 / 100 Rank #104 / 422Walk Score — State benchmarkedThis home is ranked 104th out of 422 homes in Maine. Shows how walkable this facility's neighborhood is compared to the average Walk Score across Maine facilities. Higher scores benefit residents, families, and staff.Rankings are based only on facilities in Maine that report data for that category. Facilities without available data are excluded from the ranking.Click the rank badge to see the full State ranking.Click here to see the full State ranking.
Moderately walkable. Some errands can be accomplished on foot, with a mix of nearby amenities.

Safety & Compliance

Wheelchair Accessible
Emergency SystemsYes

Therapy & Rehabilitation

2 services
Rehabilitation Services
Short-Term Rehab

Staffing & Medical

2 services
Doctor on Staff
24-Hour Staffing

Amenities & Lifestyle

Specific Programsmemory-impaired living, skilled rehabilitation care, complete nursing care services

Contact Ross Manor

Penalties and fines

Federal penalties imposed by CMS for regulatory violations, including civil money penalties (fines) and denials of payment for new Medicare/Medicaid admissions.

Source: CMS Penalties Database

No penalties in the past 3 years

No civil money penalties or payment denials were reported in the last 3 years.

Breakdown by payment type

Medicare

49% of new residents, usually for short-term rehab.

Typical stay 27 days

Private pay

45% of new residents, often for short stays.

Typical stay 4 - 5 months

Medicaid

5% of new residents, often for long-term daily care.

Typical stay 2 years

Finances and operations

Based on CMS SNF Cost Report for fiscal year ending in 12/2023.

For-profit
Corporation
Net patient revenue Info Net patient revenue — what the home actually collects for resident care, after contractual allowances, bad debt and discounts are subtracted from its gross charges (CMS cost report, Worksheet G-3). It covers resident care only; money the home earns from other sources is shown separately as "Other income."
$17.8M
Net patient income Info Net patient income: net patient revenue minus the home's total operating expenses. A positive figure means it earns more from resident care than it spends to deliver it; a negative figure means the opposite. It excludes non-operating "other income."
-$1.4M
For-profit Corporation
Net patient revenue Info Net patient revenue — what the home actually collects for resident care, after contractual allowances, bad debt and discounts are subtracted from its gross charges (CMS cost report, Worksheet G-3). It covers resident care only; money the home earns from other sources is shown separately as "Other income."
$17.8M Rank #4 / 40Revenue — State benchmarkedThis home is ranked 4th out of 40 homes in Maine. Shows this facility's annual revenue compared to the Maine average. Higher revenue generally means more resources for staffing and capital — read alongside Payroll %.Rankings are based only on facilities in Maine that report data for that category. Facilities without available data are excluded from the ranking.Click the rank badge to see the full State ranking.Click here to see the full State ranking.
Net patient income Info Net patient income: net patient revenue minus the home's total operating expenses. A positive figure means it earns more from resident care than it spends to deliver it; a negative figure means the opposite. It excludes non-operating "other income."
-$1.4M
Other income Info Money the home earns outside of resident care — such as investments, grants, rentals and other non-operating sources (CMS cost report, Worksheet G-3). It is tracked separately from net patient revenue: it is not part of that figure, and it is not included in net patient income.
$777.3K
Payroll costs Info Staff salaries plus wage-related costs — benefits such as payroll taxes, health insurance and retirement — from the home's own accounting records (CMS cost report, Worksheet A). Contract or agency labor is counted separately, under other operating costs. Rank #6 / 40Payroll — State benchmarkedThis home is ranked 6th out of 40 homes in Maine. Shows total annual staff payroll benchmarked to the Maine average. Higher payroll investment relative to peers often signals better staffing and less reliance on cheaper contract labor.Rankings are based only on facilities in Maine that report data for that category. Facilities without available data are excluded from the ranking.Click the rank badge to see the full State ranking.Click here to see the full State ranking.
$9.2M 52% of net patient revenue Info Payroll as a share of revenue: staff salaries and wage-related benefits divided by net patient revenue. A higher figure means more of each revenue dollar goes to staff pay. Rank #24 / 40Payroll % — State benchmarkedThis home is ranked 24th out of 40 homes in Maine. Shows payroll as a percentage of revenue versus the Maine average. Well-run Maine facilities typically land around 60–66% — the top third Statewide. Below 25% may signal understaffing or heavy agency use — read with Staffing ratings.Rankings are based only on facilities in Maine that report data for that category. Facilities without available data are excluded from the ranking.Click the rank badge to see the full State ranking.Click here to see the full State ranking.
Other operating costs Info Everything it costs to run the home apart from payroll — food, utilities, supplies, maintenance, contract labor and administration. Calculated as total operating expense minus payroll (staff salaries and wage-related benefits).
$9.9M
Total costs Info The home's total operating expense for the year — all the costs of running it, salaries included (CMS cost report, Worksheet G-3).
$19.1M

Who this home usually serves

TYPE OF STAY

Mostly short-term rehab stays

Most residents typically stay for a few weeks or months before returning home or moving on.

New residents most often arrive under Medicare (49% of admissions), and a typical Medicare stay runs around 27 days.

Admissions
491 total

Coverage residents most often arrive under.

Medicare 49%
Private pay 45%
Medicaid 5%
Discharges
511 total

Coverage residents most often leave under.

Medicare 41%
Private pay 45%
Medicaid 14%

Compare Nursing Homes around Bangor

The information below is reported by the Maine Department of Health and Human Services, Division of Licensing and Certification.

4 facilities compared · CMS & ME Dept. of Health data

Westgate Manor
NH
AL
HC
MC
NC
PC
RC
Bangor (Union Street)
65
Facility 65
ME AVG 20
Rank #38 / 357
98.3%
Facility 98.3%
ME AVG 83.1%
Rank #117 / 251
+18%
3.99
Facility 3.99
ME AVG 4.50
Rank #20 / 34
+32%-11%
$0
Facility $0
ME AVG $26.4k
Rank #1 / 34
17
Facility 17
ME AVG 28.5
Rank #4 / 34
5.7
Facility 5.7
ME AVG 5.9
Rank #16 / 34
-63A-
23
Facility 23
ME AVG 31
Rank #208 / 422
Rebecca Lopiansky
$11.2M
Facility $11.2M
ME AVG $16.9M
Rank #17 / 40
$6.2M
Facility $6.2M
ME AVG $4.7M
Rank #24 / 40
55.1%
Facility 55.1%
ME AVG 37.8%
Rank #31 / 40
205105
Eastside Center for Health and Rehabilitation
NH
HC
PC
RC
Bangor (Tree Streets)
69
Facility 69
ME AVG 20
Rank #36 / 357
89.4%
Facility 89.4%
ME AVG 83.1%
Rank #149 / 251
+8%
3.50
Facility 3.50
ME AVG 4.50
Rank #27 / 34
+20%-22%
$11.2k
Facility $11.2k
ME AVG $26.4k
Rank #26 / 34
26
Facility 26
ME AVG 28.5
Rank #11 / 34
3.3
Facility 3.3
ME AVG 5.9
Rank #3 / 34
362-
17
Facility 17
ME AVG 31
Rank #242 / 422
Robert Cleaves
$9.2M
Facility $9.2M
ME AVG $16.9M
Rank #31 / 40
$5.0M
Facility $5.0M
ME AVG $4.7M
Rank #27 / 40
54.8%
Facility 54.8%
ME AVG 37.8%
Rank #14 / 40
205106
Brewer Rehab and Living Center
NH
HC
NC
PC
RC
Brewer
111
Facility 111
ME AVG 20
Rank #7 / 357
92.3%
Facility 92.3%
ME AVG 83.1%
Rank #138 / 251
+11%
4.54
Facility 4.54
ME AVG 4.50
Rank #15 / 34
+18%+1%
$0
Facility $0
ME AVG $26.4k
Rank #1 / 34
36
Facility 36
ME AVG 28.5
Rank #24 / 34
4.5
Facility 4.5
ME AVG 5.9
Rank #9 / 34
299-
49
Facility 49
ME AVG 31
Rank #113 / 422
Vk Health Facilities, LLC
$17.2M
Facility $17.2M
ME AVG $16.9M
Rank #10 / 40
$8.8M
Facility $8.8M
ME AVG $4.7M
Rank #8 / 40
51%
Facility 51%
ME AVG 37.8%
Rank #5 / 40
205062
Bangor Nursing & Rehabilitation Center
NH
MC
NC
RC
Bangor (Texas Avenue)
60
Facility 60
ME AVG 20
Rank #42 / 357
88.8%
Facility 88.8%
ME AVG 83.1%
Rank #155 / 251
+7%
3.75
Facility 3.75
ME AVG 4.50
Rank #23 / 34
+20%-17%
$12.8k
Facility $12.8k
ME AVG $26.4k
Rank #28 / 34
53
Facility 53
ME AVG 28.5
Rank #33 / 34
5.9
Facility 5.9
ME AVG 5.9
Rank #20 / 34
152-
13
Facility 13
ME AVG 31
Rank #265 / 422
Phillip Bennett
$4.0M
Facility $4.0M
ME AVG $16.9M
Rank #36 / 40
$968.1k
Facility $968.1k
ME AVG $4.7M
Rank #30 / 40
24.4%
Facility 24.4%
ME AVG 37.8%
Rank #8 / 40
205020

Financial Assistance for
Nursing Home in Maine

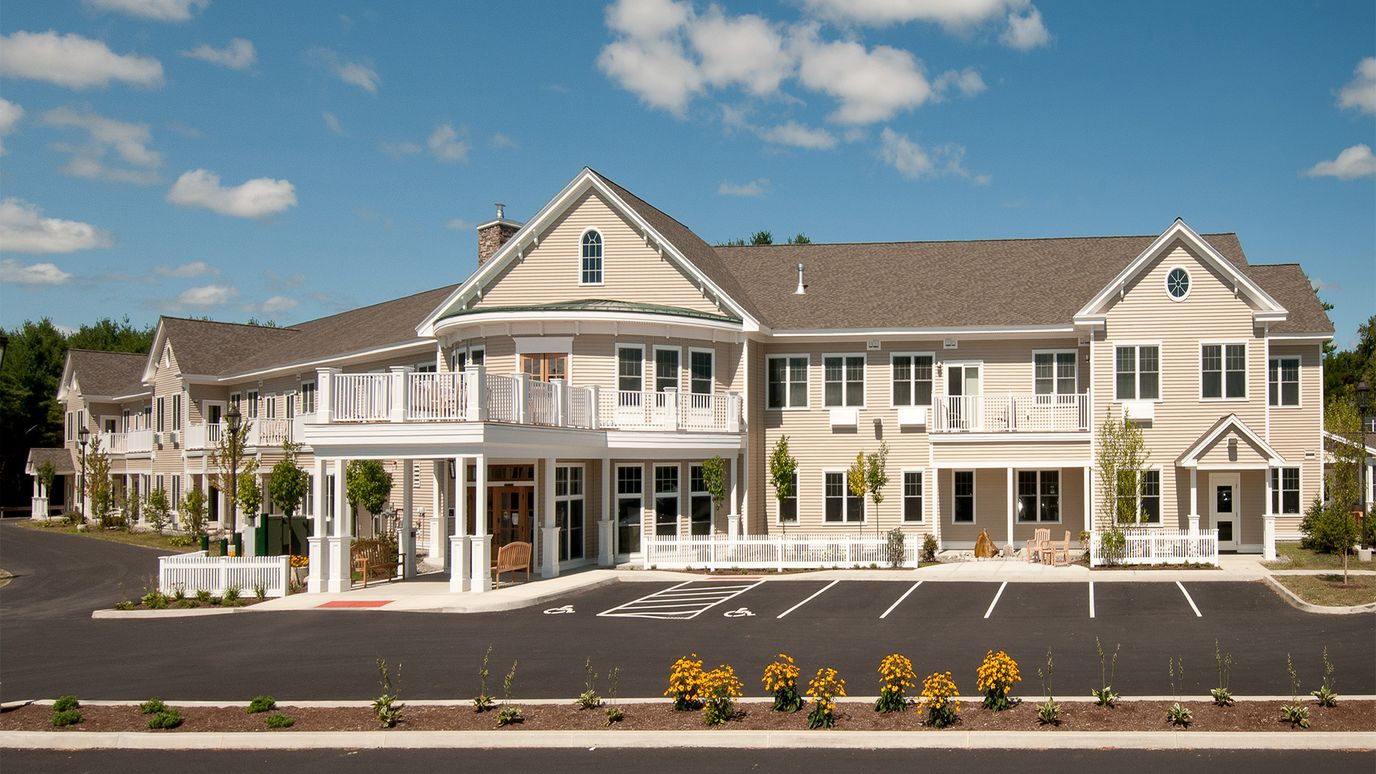
Ross Manor is located in Bangor, Maine.
Here are the financial assistance programs available to residents in Maine.

Get Financial aid guidance

Home and Community Benefits for the Elderly

MaineCare HCB Program

Age 65+ or 18+ with disability
General Maine resident, Medicaid- eligible, nursing home-level care need.
Income Limits (2025) ~$2,829/month 300% FBR, individual
Asset Limits $2,000 (individual), $3,000 (couple).
ME

Rural access emphasized.

Benefits
Personal care (5-7 hours/day) Respite (240 hours/year) Meals ($6/meal) Adult day services ($60/day)

Maine Statewide Respite Program

ME Respite Program

Age
General Caregiver of someone 60+ with dementia, Maine resident.
Income Limits ~$2,500/month individual, varies
Asset Limits $40,000 individual
ME

Limited to dementia caregivers; capped funding.

Benefits
In-home respite (up to 30 days/year) Adult day care (~$60/day)

MaineCare Long-Term Care (Nursing Facility Services)

MaineCare Nursing Facility Services

Age 65+
General Maine resident, Medicaid-eligible, requires nursing home-level care.
Income Limits (2025) $943/month (individual); must be less than nursing home cost for full coverage.
Asset Limits $2,000 (individual), $3,000 (couple); spousal allowance up to $155,356.
ME

Home equity limit of $636,000; estate recovery applies post-55.

Benefits
24/7 nursing care Meals Therapy Medications (hours unlimited per medical need)

Consumer-Directed Home-Based Care (CDHBC)

Maine Consumer-Directed Personal Assistance Services

Age 65+
General Maine resident, needs ADL assistance, income/asset limits apply.
Income Limits (2025) ~$2,000/month varies by AAA
Asset Limits Not strict; prioritizes low-income.
ME

Available through five Area Agencies on Aging.

Benefits
Personal care (20-30 hours/week) PERS Adult day care Home modifications

Home Accessibility and Repair Program

Maine State Housing Authority Home Accessibility and Repair

Age 62+
General Maine resident, homeowner, low-income.
Income Limits (2025) ~$34,000/year individual, 80% AMI, varies by county
Asset Limits Not specified; focus on income.
ME

Includes Elderly Hardship Grants for urgent repairs.

Benefits
Wheelchair ramps Grab bars Roof repairs (up to $20,000/project)

Program of All-Inclusive Care for the Elderly (PACE)

Maine PACE (not widely available yet)

Age 55+
General Maine resident, Medicare/Medicaid-eligible, nursing home-level care need, community-safe.
Income Limits (2025) No strict limit; Medicaid portion $2,901/month max.
Asset Limits $2,000 (individual) for Medicaid portion.
ME

Pilot phase; check availability with DHHS.

Benefits
Medical care Personal care Day center Transportation Respite (tailored to need)

Veterans Aid and Attendance (A&A) Benefit

Maine VA Aid and Attendance

Age
General Wartime veteran/spouse, age 65+ or disabled, needs ADL help, Maine resident.
Income Limits (2025) Net income minus medical expenses < $1,984/month individual with A&A
Asset Limits $155,356 net worth limit
ME

High veteran population in rural areas.

Benefits
Cash benefit ($1,478-$2,471/month, varies by status) for care costs

Medicare Savings Programs (MSP)

Maine Medicare Savings Programs

Age 65+
General Maine resident, Medicare Part A/B enrollee.
Income Limits (2025) $2,014/month (individual, QMB), $2,706/month (SLMB/QI).
Asset Limits $9,090 (individual), $13,630 (couple).
ME

Includes Qualified Medicare Beneficiary (QMB), Specified Low-Income Medicare Beneficiary (SLMB), and Qualified Individual (QI).

Benefits
Covers Medicare premiums (up to $174.70/month Part B) Co-pays Deductibles

Frequently Asked Questions about Ross Manor

Is Ross Manor in a walkable area?

Ross Manor has a walk score of 51. Moderately walkable. Some errands can be accomplished on foot, with a mix of nearby amenities.

What is the occupancy rate at Ross Manor?

Ross Manor's occupancy is 90.5%.

Does Ross Manor operate as a for-profit or non-profit?

Ross Manor is registered as a for-profit.

Are there photos of Ross Manor?

Yes — there are 4 photos of Ross Manor in the photo gallery on this page.

What is the phone number of Ross Manor?

(207) 941-8400 will put you in contact with the team at Ross Manor.

Is Ross Manor Medicare or Medicaid certified?

Ross Manor is not currently listed as a CMS-certified provider of Medicare or Medicaid.

Guides for Better Senior Living

Care Cost Calculator: See Prices in Your Area

Nursing Home Data Explorer

Don’t Wait Too Long: 7 Red Flag Signs Your Parent Needs Assisted Living Now

The True Cost of Assisted Living in 2025 – And How Families Are Paying For It

Understanding Senior Living Costs: Pricing Models, Discounts & Financial Assistance