Bangor Nursing & Rehabilitation Center
Nursing Home, Memory Care, Nursing Care & Respite Care · Bangor, ME
CMS overall rating Info CMS (the Centers for Medicare & Medicaid Services) is the federal agency that rates nursing home quality. Its Overall Rating runs from 1 to 5 stars, combining health inspections, staffing, and quality measures, with inspections weighted most heavily.

Bangor Nursing & Rehabilitation Center

Nursing Home, Memory Care, Nursing Care & Respite Care · Bangor, ME
CMS overall rating Info CMS (the Centers for Medicare & Medicaid Services) is the federal agency that rates nursing home quality. Its Overall Rating runs from 1 to 5 stars, combining health inspections, staffing, and quality measures, with inspections weighted most heavily.
Calculator: See prices in your area
Bangor Nursing & Rehabilitation Center accepts Medicare, Medicaid, and private pay.

Overview of Bangor Nursing & Rehabilitation Center

Bangor Nursing & Rehabilitation Center takes a holistic approach to memory care, offering specialized memory care therapy. The home focuses on enhancing cognitive function, memory retention, and overall brain health. Through personalized treatment plans and evidence-based techniques, residents with memory care needs receive comprehensive care and support. At Bangor Nursing & Rehabilitation Center, they understand that providing engaging nursing home activities can also greatly enhance the quality of life for seniors. The dedicated staff is committed to creating an environment where residents can thrive, maintain their independence, and enjoy a fulfilling and meaningful lifestyle.

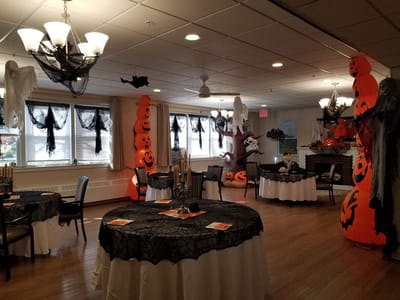
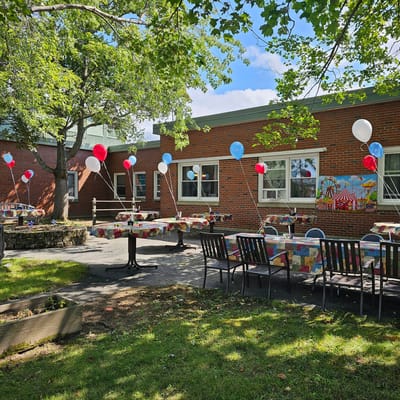
Seniors residing in Bangor Nursing & Rehabilitation Center can participate in a wide range of stimulating and fulfilling programs designed to promote social interaction, mental agility, and overall well-being. From group outings and hobby clubs to educational workshops and cultural events, there’s something for everyone to enjoy.

Quality ratings

Measured by Centers for Medicare & Medicaid Services (CMS)

Overall rating Info The Overall CMS Rating combines results from health inspections, staffing levels and quality measures. Health inspections carry the most weight. Staffing and quality scores can increase or decrease the final rating based on performance compared to state and national standards.
▼ 67.1% Below ME avg. ▼ 67.1% Below ME avg.ME average: 3.0Click the badge to see the full State ranking.Click here to see the full State ranking.
Health Inspection Info Based on the results of the facility's three most recent standard inspections and any complaint investigations. CMS reviews the number, scope, and severity of deficiencies, with more recent findings weighted more heavily.
▼ 64.8% Below ME avg. ▼ 64.8% Below ME avg.ME average: 2.8Click the badge to see the full State ranking.Click here to see the full State ranking.
Staffing Info Measures average nursing staff hours per resident per day, including Registered Nurses (RNs) and total nursing staff. Ratings are adjusted based on the level of care residents require and are compared to state and national benchmarks.
At ME avg. At ME avg.ME average: 4.0Click the badge to see the full State ranking.Click here to see the full State ranking.
Quality Measures Info Based on clinical and physical health indicators reported to CMS, such as hospital readmissions, falls, pressure ulcers, and improvements in mobility. These measures reflect how well residents' health needs are being managed.
▼ 26.7% Below ME avg. ▼ 26.7% Below ME avg.ME average: 2.7Click the badge to see the full State ranking.Click here to see the full State ranking.

Staffing hours breakdown

Info Daily nursing hours per resident by staff type, reported to CMS. Higher is generally better — compare this facility to state and national averages to see where staffing stands.

Hours per resident per day — compared to Maine state averages

Total nursing care / resident Info This home is ranked 23rd out of 34 homes in Maine for nurse hours. Total adjusted nursing hours per resident per day, combining RN, LPN, and aide time. CMS adjusts this for case-mix so facilities can be fairly compared.
3h 45m per day
Rank #23 / 34Nurse hours — State benchmarkedThis home is ranked 23rd out of 34 homes in Maine. Shows adjusted nurse hours per resident per day benchmarked to the Maine average, with a ranking across 34 Maine facilities. More hours mean more direct care. The national average is about 3.5 hrs; below 3.0 is a red flag.Rankings are based only on facilities in Maine that report data for that category. Facilities without available data are excluded from the ranking.Click the rank badge to see the full State ranking.Click here to see the full State ranking.
This facility Maine avg (4h 30m per day)
vs Maine avg
-17%

4 of 6 metrics below state avg

Standout metric Registered Nurse (RN) is +16% above state avg
Staff typeHours / Day / Residentvs state avg
Registered Nurse (RN) Info RNs hold the highest nursing license and can assess residents, interpret test results, and direct care plans. More RN hours per day often signals stronger clinical oversight and faster response to health changes. 1h 13m per day ▲ 16% State avg: 1h 3m per day · National avg: 41m per day
LPN / LVN Info Licensed Practical Nurses (LPNs) or Licensed Vocational Nurses (LVNs) deliver routine hands-on care — medication administration, wound dressing, and monitoring vital signs. They work under RN supervision and make up a large share of daily bedside care. 24m per day ▼ 12% State avg: 27m per day · National avg: 52m per day
Nurse Aide Info Certified Nurse Aides (CNAs) provide the most direct day-to-day assistance: bathing, dressing, feeding, and mobility. Nurse aide hours are typically the largest staffing category and directly affect residents' quality of life. 2h 22m per day ▼ 17% State avg: 2h 51m per day · National avg: 2h 21m per day
Weekend Total Nursing Info Combined nursing hours (RN + LPN + Nurse Aide) per resident per day on weekends. Staffing often drops on weekends — this figure reveals whether the facility maintains adequate coverage outside of weekday hours. 3h 40m per day ▼ 6% State avg: 3h 55m per day · National avg: 3h 26m per day
Physical Therapist Info Hours per resident per day provided by licensed Physical Therapists (PTs) or PT Assistants. PT services help residents recover mobility after injury or illness and are especially important for post-acute (short-stay) rehabilitation. 3m per day ▼ 27% State avg: 4m per day · National avg: 4m per day
Weekend RN Info Registered nurse hours specifically on weekends. Facilities sometimes reduce RN presence on Saturdays and Sundays — a low weekend RN figure compared to weekday hours can indicate reduced clinical oversight when most administrative staff are absent. 48m per day ▲ 8% State avg: 44m per day · National avg: 29m per day

Capacity and availability

This home usually has limited availability

Higher occupancy than the Maine average: 83.1%
Occupancy rate
88.8% Rank #155 / 251Occupancy rate — State benchmarkedThis home is ranked 155th out of 251 homes in Maine. Shows this facility's occupancy rate versus the Maine average, with its Statewide rank out of 251. Higher occupancy signals strong local demand and financial stability.Rankings are based only on facilities in Maine that report data for that category. Facilities without available data are excluded from the ranking.Click the rank badge to see the full State ranking.Click here to see the full State ranking.
Avg. Length of Stay
80 days
Bed community size
60-bed community Rank #42 / 357Bed count — State benchmarkedThis home is ranked 42nd out of 357 homes in Maine. Shows this facility's certified or reported bed count compared to other Maine facilities. Larger communities may offer more amenities, programs, and on-site services for residents and families.Rankings are based only on facilities in Maine that report data for that category. Facilities without available data are excluded from the ranking.Click the rank badge to see the full State ranking.Click here to see the full State ranking.
A moderately sized community that may balance personal attention with shared amenities and social activities.
Walk Score
Walk Score: 13 / 100 Rank #265 / 422Walk Score — State benchmarkedThis home is ranked 265th out of 422 homes in Maine. Shows how walkable this facility's neighborhood is compared to the average Walk Score across Maine facilities. Higher scores benefit residents, families, and staff.Rankings are based only on facilities in Maine that report data for that category. Facilities without available data are excluded from the ranking.Click the rank badge to see the full State ranking.Click here to see the full State ranking.
Car-dependent. Most errands require a car, with limited nearby walkable options.

Therapy & Rehabilitation

3 services
Rehabilitation Services
Respite Care
Short-Term Rehab

Additional Services

3 services
Rehabilitation And Skilled Medical Care
Short-Term Respite Care
Long-Term Nursing Care

Amenities & Lifestyle

Specific ProgramsShort-Term Rehabilitation

Contact Bangor Nursing & Rehabilitation Center

Staffing Data

Reporting period: October 1 – December 31, 2025 (Q4 2025). Source: CMS Payroll-Based Journal report.

Total staff 112
Employees 61
Contractors 51
Staff to resident ratio 2.20 : 1
8% more staff per resident than Maine average
Maine average ratio: 2.03 : 1 Maine average ratio: 2.03 : 1See full Maine ranking
Avg staff/day 29
Average shift 8.3 hours
0% compared with Maine average
Maine average: 8.1 hours Maine average shift: 8.1 hoursSee full Maine ranking
Total staff hours (quarter) 22,148

Nursing staff breakdown

Q4 2025 · Oct 1 – Dec 31 More info This data comes from the CMS Payroll-Based Journal report covering October 1 – December 31, 2025.
Registered Nurse

Manages medical care and health needs.

RN Staff Info 20 total: 11 full-time employees and 9 contractors. 20
Average shift length Info Average shift length. Calculated as total hours divided by days worked and average staff per day. 8.9 hours
Licensed Practical Nurse

Assists with medical care and medications.

LPN Staff Info 6 total: 3 full-time employees and 3 contractors. 6
Average shift length Info Average shift length. Calculated as total hours divided by days worked and average staff per day. 10.4 hours
Certified Nursing Assistant

Helps with daily care and mobility.

CNA Staff Info 58 total: 32 full-time employees and 26 contractors. 58
Average shift length Info Average shift length. Calculated as total hours divided by days worked and average staff per day. 8.7 hours

Contractor staffing

Q4 2025 · Oct 1 – Dec 31 More info This data comes from the CMS Payroll-Based Journal report covering October 1 – December 31, 2025.

Total hours from contractors

18.4%

4,068 contractor hours this quarter

Certified Nursing Assistant: 26 Registered Nurse: 9 Respiratory Therapy Technician: 4 Licensed Practical Nurse: 3 Speech Language Pathologist: 2 Physical Therapy Assistant: 1 Occupational Therapy Assistant: 1 Clinical Nurse Specialist: 1 Occupational Therapy Aide: 1 Qualified Social Worker: 1 Physical Therapy Aide: 1 Medical Director: 1

Staff by category

Q4 2025 · Oct 1 – Dec 31 More info This data comes from the CMS Payroll-Based Journal report covering October 1 – December 31, 2025.
Certified Nursing Assistant32265811,38292100%8.7
Registered Nurse119204,09392100%8.9
Licensed Practical Nurse3361,9088896%10.4
Clinical Nurse Specialist2131,2476773%8.4
Dietitian2028686368%7.4
Administrator1015286672%8
Nurse Practitioner1014966267%8
Physical Therapy Assistant1124756267%7.7
Dental Services Staff1014395964%7.4
Speech Language Pathologist1232664448%6
Respiratory Therapy Technician3472335661%3.6
Occupational Therapy Aide0111123235%3.5
Qualified Social Worker112301617%1.9
Occupational Therapy Assistant0113067%5
Medical Director0113055%5.9
Physical Therapy Aide1121255%2.4
Other Dietary Services Staff101311%2.8
58 Certified Nursing Assistant
% of Days 100%
20 Registered Nurse
% of Days 100%
6 Licensed Practical Nurse
% of Days 96%
3 Clinical Nurse Specialist
% of Days 73%
2 Dietitian
% of Days 68%
1 Administrator
% of Days 72%
1 Nurse Practitioner
% of Days 67%
2 Physical Therapy Assistant
% of Days 67%
1 Dental Services Staff
% of Days 64%
3 Speech Language Pathologist
% of Days 48%
7 Respiratory Therapy Technician
% of Days 61%
1 Occupational Therapy Aide
% of Days 35%
2 Qualified Social Worker
% of Days 17%
1 Occupational Therapy Assistant
% of Days 7%
1 Medical Director
% of Days 5%
2 Physical Therapy Aide
% of Days 5%
1 Other Dietary Services Staff
% of Days 1%

Penalties and fines

Includes penalties issued in 2024

Federal penalties imposed by CMS for regulatory violations, including civil money penalties (fines) and denials of payment for new Medicare/Medicaid admissions.

Source: CMS Penalties Database (Data as of Jan 2026)

Total fines amount $13K Rank #28 / 34Federal fines — State benchmarkedThis home is ranked 28th out of 34 homes in Maine. Shows this facility's cumulative CMS federal fine dollars versus the Maine average among facilities with fines, and where it ranks among 34 facilities in the pool. Lower total dollars mean a better rank.Rankings are based only on facilities in Maine that report data for that category. Facilities without available data are excluded from the ranking.Click the rank badge to see the full State ranking.Click here to see the full State ranking.
47% lower than Maine average

Maine average: $24K

Number of fines 1
18% fewer fines than Maine average

Maine average: 1.2

Payment Denials Info Serious action where Medicare and/or Medicaid temporarily stops payments for new residents until issues are fixed. 0
100% fewer payment denials than Maine average

Maine average: 0.2

Fines amount comparison
This facility $13K
Maine average $24K
Penalty History

Penalties are imposed by CMS for violations of federal nursing home regulations.

1 penalty in the past 3 years

Dec 19, 2024 · $13K

Civil Money Penalty Info Fines imposed for noncompliance, which can be assessed per day or per instance of violation. Dec 19, 2024
$13K

Last updated: Jan 2026

Quality of care over time

These measures show how residents usually do over time at this home, based on health outcomes and preventive care.

High-risk clinical events score Info A composite score based on pressure ulcers, falls with injury, weight loss, walking ability decline, and activities of daily living decline. 19.0
34% worse than Maine average

Maine average: 14.2

Functional decline score Info A composite score based on activities of daily living decline, walking ability decline, and incontinence. 38.0
30% worse than Maine average

Maine average: 29.1

Long-stay resident measures
Significantly below average Maine avg: 2.6 Info CMS star rating based on long-stay quality measure performance. 5 stars = significantly above average, 1 star = significantly below average.
Need for Help with Daily Activities Increased Info Percent of long-stay residents whose need for help with daily activities has increased 20.5%
21% better than Maine average

Maine average: 26.0%

Walking Ability Worsened Info Percent of long-stay residents whose ability to move independently worsened 63.5%
102% worse than Maine average

Maine average: 31.4%

Low Risk Residents with Bowel/Bladder Incontinence Info Percent of low risk long-stay residents who lose control of their bowels or bladder 30.0%
In line with Maine average

Maine average: 29.8%

Falls with Major Injury Info Percent of long-stay residents experiencing one or more falls with major injury 5.3%
20% worse than Maine average

Maine average: 4.4%

High Risk Residents with Pressure Ulcers Info Percent of long-stay high risk residents with pressure ulcers 3.4%
25% better than Maine average

Maine average: 4.5%

Urinary Tract Infection Info Percent of long-stay residents with a urinary tract infection 1.8%
35% better than Maine average

Maine average: 2.8%

Lost Too Much Weight Info Percent of long-stay residents who lose too much weight 2.2%
59% better than Maine average

Maine average: 5.5%

Depressive Symptoms Info Percent of long-stay residents who have depressive symptoms 5.0%
52% better than Maine average

Maine average: 10.5%

Antipsychotic Use Info Percent of long-stay residents who received an antipsychotic medication 25.9%
31% worse than Maine average

Maine average: 19.8%

Pneumococcal Vaccine Info Percent of long-stay residents assessed and appropriately given the pneumococcal vaccine 91.2%
In line with Maine average

Maine average: 90.1%

Influenza Vaccine Info Percent of long-stay residents assessed and appropriately given the seasonal influenza vaccine 95.7%
In line with Maine average

Maine average: 95.5%

Hospitalizations per 1,000 days Info Number of hospitalizations per 1,000 long-stay resident days. 1.92
38% worse than Maine average

Maine average: 1.39

ED visits per 1,000 days Info Number of outpatient emergency department visits per 1,000 long-stay resident days. 2.53
22% worse than Maine average

Maine average: 2.08

Short-stay resident measures
Average Maine avg: 3.3 Info CMS star rating based on short-stay quality measure performance. 5 stars = much above average, 1 star = much below average.
Pneumococcal Vaccine Info Percent of short-stay residents assessed and appropriately given the pneumococcal vaccine 53.1%
25% worse than Maine average

Maine average: 70.8%

Antipsychotic medication increase Info Percent of short-stay residents who newly received an antipsychotic medication 1.3%
11% better than Maine average

Maine average: 1.4%

Influenza Vaccine Info Percent of short-stay residents assessed and appropriately given the seasonal influenza vaccine 67.8%
9% worse than Maine average

Maine average: 74.5%

Re-hospitalized after SNF stay Info Percentage of short-stay residents who were re-hospitalized after their nursing home admission. 29.0%
41% worse than Maine average

Maine average: 20.5%

Emergency department visits Info Percentage of short-stay residents who had an outpatient emergency department visit. 11.5%
26% better than Maine average

Maine average: 15.6%

Falls with major injury Info Percentage of SNF residents who experience falls with major injury during their stay. 0.0%
100% better than Maine average

Maine average: 0.8%

Ability to care for self at discharge Info Percentage of residents at or above expected ability to care for themselves at discharge. 48.0%
11% worse than Maine average

Maine average: 53.7%

Successful return to home or community Info Rate of successful return to home or community from a skilled nursing facility. 55.8%
10% better than Maine average

Maine average: 50.6%

Breakdown by payment type

Medicare

37% of new residents, usually for short-term rehab.

Typical stay 26 days

Private pay

43% of new residents, often for short stays.

Typical stay 1 - 2 months

Medicaid

20% of new residents, often for long-term daily care.

Typical stay 11 - 12 months

Facility Characteristics

Source: CMS Long-Term Care Facility Characteristics (Data as of Jan 2026)

Total residents 51
Medicare
8
15.7% of residents
Medicaid
34
66.7% of residents
Private pay or other
9
17.6% of residents
Programs & Services
Residents Group

Residents meet regularly to discuss policies, care quality, and activities

Active Resident Council

Organized group of residents that meets regularly to discuss facility policies, quality of life, and activities.

Finances and operations

Based on CMS SNF Cost Report for fiscal year ending in 12/2023.

Nonprofit
Church Related
Net patient revenue Info Net patient revenue — what the home actually collects for resident care, after contractual allowances, bad debt and discounts are subtracted from its gross charges (CMS cost report, Worksheet G-3). It covers resident care only; money the home earns from other sources is shown separately as "Other income."
$4.0M
Net patient income Info Net patient income: net patient revenue minus the home's total operating expenses. A positive figure means it earns more from resident care than it spends to deliver it; a negative figure means the opposite. It excludes non-operating "other income."
-$1.2M
Nonprofit Church Related
Net patient revenue Info Net patient revenue — what the home actually collects for resident care, after contractual allowances, bad debt and discounts are subtracted from its gross charges (CMS cost report, Worksheet G-3). It covers resident care only; money the home earns from other sources is shown separately as "Other income."
$4.0M Rank #36 / 40Revenue — State benchmarkedThis home is ranked 36th out of 40 homes in Maine. Shows this facility's annual revenue compared to the Maine average. Higher revenue generally means more resources for staffing and capital — read alongside Payroll %.Rankings are based only on facilities in Maine that report data for that category. Facilities without available data are excluded from the ranking.Click the rank badge to see the full State ranking.Click here to see the full State ranking.
Net patient income Info Net patient income: net patient revenue minus the home's total operating expenses. A positive figure means it earns more from resident care than it spends to deliver it; a negative figure means the opposite. It excludes non-operating "other income."
-$1.2M
Other income Info Money the home earns outside of resident care — such as investments, grants, rentals and other non-operating sources (CMS cost report, Worksheet G-3). It is tracked separately from net patient revenue: it is not part of that figure, and it is not included in net patient income.
$62.8K
Payroll costs Info Staff salaries plus wage-related costs — benefits such as payroll taxes, health insurance and retirement — from the home's own accounting records (CMS cost report, Worksheet A). Contract or agency labor is counted separately, under other operating costs. Rank #30 / 40Payroll — State benchmarkedThis home is ranked 30th out of 40 homes in Maine. Shows total annual staff payroll benchmarked to the Maine average. Higher payroll investment relative to peers often signals better staffing and less reliance on cheaper contract labor.Rankings are based only on facilities in Maine that report data for that category. Facilities without available data are excluded from the ranking.Click the rank badge to see the full State ranking.Click here to see the full State ranking.
$968.1K 24.4% of net patient revenue Info Payroll as a share of revenue: staff salaries and wage-related benefits divided by net patient revenue. A higher figure means more of each revenue dollar goes to staff pay. Rank #8 / 40Payroll % — State benchmarkedThis home is ranked 8th out of 40 homes in Maine. Shows payroll as a percentage of revenue versus the Maine average. Well-run Maine facilities typically land around 60–66% — the top third Statewide. Below 25% may signal understaffing or heavy agency use — read with Staffing ratings.Rankings are based only on facilities in Maine that report data for that category. Facilities without available data are excluded from the ranking.Click the rank badge to see the full State ranking.Click here to see the full State ranking.
Other operating costs Info Everything it costs to run the home apart from payroll — food, utilities, supplies, maintenance, contract labor and administration. Calculated as total operating expense minus payroll (staff salaries and wage-related benefits).
$4.2M
Total costs Info The home's total operating expense for the year — all the costs of running it, salaries included (CMS cost report, Worksheet G-3).
$5.2M

Who this home usually serves

TYPE OF STAY

Mix of rehab and long-term care

This home supports both short-term rehab and long-term care, with residents staying for a wide range of durations.

New residents most often arrive under private pay (43% of admissions), and a typical private pay stay runs around 1 - 2 months.

Admissions
97 total

Coverage residents most often arrive under.

Medicare 37%
Private pay 43%
Medicaid 20%
Discharges
123 total

Coverage residents most often leave under.

Medicare 24%
Private pay 50%
Medicaid 26%

Managed by Janet Hope

President

Janet Hope joined Bangor Nursing & Rehabilitation Center in June 2023 as its President. She has extensive experience in senior healthcare communities throughout Maine. Janet holds a Certificate of Business Administration and a Bachelor of Arts in Psychology from the University of Maine in Orono. She is a Licensed Social Worker and Multi-Level Nursing Home Administrator, actively supporting regional healthcare associations and conferences.

Places of interest near Bangor Nursing & Rehabilitation Center

Address 2.6 miles from city center Info Estimated distance in miles from Bangor's city center to Bangor Nursing & Rehabilitation Center's address, calculated via Google Maps.

Calculate Travel Distance to Bangor Nursing & Rehabilitation Center

Add your location

Address

Compare Nursing Homes around Bangor

The information below is reported by the Maine Department of Health and Human Services, Division of Licensing and Certification.

4 facilities compared · CMS & ME Dept. of Health data

Westgate Manor
NH
AL
HC
MC
NC
PC
RC
Bangor (Union Street)
65
Facility 65
ME AVG 20
Rank #38 / 357
98.3%
Facility 98.3%
ME AVG 83.1%
Rank #117 / 251
+18%
3.99
Facility 3.99
ME AVG 4.50
Rank #20 / 34
+32%-11%
$0
Facility $0
ME AVG $26.4k
Rank #1 / 34
17
Facility 17
ME AVG 28.5
Rank #4 / 34
5.7
Facility 5.7
ME AVG 5.9
Rank #16 / 34
-63A-
23
Facility 23
ME AVG 31
Rank #208 / 422
Rebecca Lopiansky
$11.2M
Facility $11.2M
ME AVG $16.9M
Rank #17 / 40
$6.2M
Facility $6.2M
ME AVG $4.7M
Rank #24 / 40
55.1%
Facility 55.1%
ME AVG 37.8%
Rank #31 / 40
205105
Eastside Center for Health and Rehabilitation
NH
HC
PC
RC
Bangor (Tree Streets)
69
Facility 69
ME AVG 20
Rank #36 / 357
89.4%
Facility 89.4%
ME AVG 83.1%
Rank #149 / 251
+8%
3.50
Facility 3.50
ME AVG 4.50
Rank #27 / 34
+20%-22%
$11.2k
Facility $11.2k
ME AVG $26.4k
Rank #26 / 34
26
Facility 26
ME AVG 28.5
Rank #11 / 34
3.3
Facility 3.3
ME AVG 5.9
Rank #3 / 34
362-
17
Facility 17
ME AVG 31
Rank #242 / 422
Robert Cleaves
$9.2M
Facility $9.2M
ME AVG $16.9M
Rank #31 / 40
$5.0M
Facility $5.0M
ME AVG $4.7M
Rank #27 / 40
54.8%
Facility 54.8%
ME AVG 37.8%
Rank #14 / 40
205106
Brewer Rehab and Living Center
NH
HC
NC
PC
RC
Brewer
111
Facility 111
ME AVG 20
Rank #7 / 357
92.3%
Facility 92.3%
ME AVG 83.1%
Rank #138 / 251
+11%
4.54
Facility 4.54
ME AVG 4.50
Rank #15 / 34
+18%+1%
$0
Facility $0
ME AVG $26.4k
Rank #1 / 34
36
Facility 36
ME AVG 28.5
Rank #24 / 34
4.5
Facility 4.5
ME AVG 5.9
Rank #9 / 34
299-
49
Facility 49
ME AVG 31
Rank #113 / 422
Vk Health Facilities, LLC
$17.2M
Facility $17.2M
ME AVG $16.9M
Rank #10 / 40
$8.8M
Facility $8.8M
ME AVG $4.7M
Rank #8 / 40
51%
Facility 51%
ME AVG 37.8%
Rank #5 / 40
205062
Bangor Nursing & Rehabilitation Center
NH
MC
NC
RC
Bangor (Texas Avenue)
60
Facility 60
ME AVG 20
Rank #42 / 357
88.8%
Facility 88.8%
ME AVG 83.1%
Rank #155 / 251
+7%
3.75
Facility 3.75
ME AVG 4.50
Rank #23 / 34
+20%-17%
$12.8k
Facility $12.8k
ME AVG $26.4k
Rank #28 / 34
53
Facility 53
ME AVG 28.5
Rank #33 / 34
5.9
Facility 5.9
ME AVG 5.9
Rank #20 / 34
152-
13
Facility 13
ME AVG 31
Rank #265 / 422
Phillip Bennett
$4.0M
Facility $4.0M
ME AVG $16.9M
Rank #36 / 40
$968.1k
Facility $968.1k
ME AVG $4.7M
Rank #30 / 40
24.4%
Facility 24.4%
ME AVG 37.8%
Rank #8 / 40
205020

Financial Assistance for
Nursing Home in Maine

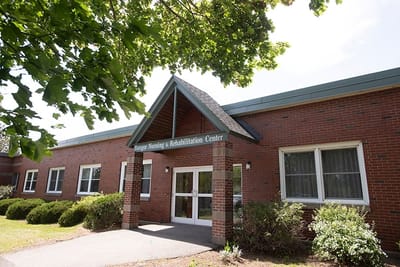
Bangor Nursing & Rehabilitation Center is located in Bangor, Maine.
Here are the financial assistance programs available to residents in Maine.

Get Financial aid guidance

Home and Community Benefits for the Elderly

MaineCare HCB Program

Age 65+ or 18+ with disability
General Maine resident, Medicaid- eligible, nursing home-level care need.
Income Limits (2025) ~$2,829/month 300% FBR, individual
Asset Limits $2,000 (individual), $3,000 (couple).
ME

Rural access emphasized.

Benefits
Personal care (5-7 hours/day) Respite (240 hours/year) Meals ($6/meal) Adult day services ($60/day)

Maine Statewide Respite Program

ME Respite Program

Age
General Caregiver of someone 60+ with dementia, Maine resident.
Income Limits ~$2,500/month individual, varies
Asset Limits $40,000 individual
ME

Limited to dementia caregivers; capped funding.

Benefits
In-home respite (up to 30 days/year) Adult day care (~$60/day)

MaineCare Long-Term Care (Nursing Facility Services)

MaineCare Nursing Facility Services

Age 65+
General Maine resident, Medicaid-eligible, requires nursing home-level care.
Income Limits (2025) $943/month (individual); must be less than nursing home cost for full coverage.
Asset Limits $2,000 (individual), $3,000 (couple); spousal allowance up to $155,356.
ME

Home equity limit of $636,000; estate recovery applies post-55.

Benefits
24/7 nursing care Meals Therapy Medications (hours unlimited per medical need)

Consumer-Directed Home-Based Care (CDHBC)

Maine Consumer-Directed Personal Assistance Services

Age 65+
General Maine resident, needs ADL assistance, income/asset limits apply.
Income Limits (2025) ~$2,000/month varies by AAA
Asset Limits Not strict; prioritizes low-income.
ME

Available through five Area Agencies on Aging.

Benefits
Personal care (20-30 hours/week) PERS Adult day care Home modifications

Home Accessibility and Repair Program

Maine State Housing Authority Home Accessibility and Repair

Age 62+
General Maine resident, homeowner, low-income.
Income Limits (2025) ~$34,000/year individual, 80% AMI, varies by county
Asset Limits Not specified; focus on income.
ME

Includes Elderly Hardship Grants for urgent repairs.

Benefits
Wheelchair ramps Grab bars Roof repairs (up to $20,000/project)

Program of All-Inclusive Care for the Elderly (PACE)

Maine PACE (not widely available yet)

Age 55+
General Maine resident, Medicare/Medicaid-eligible, nursing home-level care need, community-safe.
Income Limits (2025) No strict limit; Medicaid portion $2,901/month max.
Asset Limits $2,000 (individual) for Medicaid portion.
ME

Pilot phase; check availability with DHHS.

Benefits
Medical care Personal care Day center Transportation Respite (tailored to need)

Veterans Aid and Attendance (A&A) Benefit

Maine VA Aid and Attendance

Age
General Wartime veteran/spouse, age 65+ or disabled, needs ADL help, Maine resident.
Income Limits (2025) Net income minus medical expenses < $1,984/month individual with A&A
Asset Limits $155,356 net worth limit
ME

High veteran population in rural areas.

Benefits
Cash benefit ($1,478-$2,471/month, varies by status) for care costs

Medicare Savings Programs (MSP)

Maine Medicare Savings Programs

Age 65+
General Maine resident, Medicare Part A/B enrollee.
Income Limits (2025) $2,014/month (individual, QMB), $2,706/month (SLMB/QI).
Asset Limits $9,090 (individual), $13,630 (couple).
ME

Includes Qualified Medicare Beneficiary (QMB), Specified Low-Income Medicare Beneficiary (SLMB), and Qualified Individual (QI).

Benefits
Covers Medicare premiums (up to $174.70/month Part B) Co-pays Deductibles

Frequently Asked Questions about Bangor Nursing & Rehabilitation Center

What neighborhood is Bangor Nursing & Rehabilitation Center in?

Bangor Nursing & Rehabilitation Center is in the Texas Avenue neighborhood.

Is Bangor Nursing & Rehabilitation Center in a walkable area?

Bangor Nursing & Rehabilitation Center has a walk score of 13. Car-dependent. Most errands require a car, with limited nearby walkable options.

What is the occupancy rate at Bangor Nursing & Rehabilitation Center?

Bangor Nursing & Rehabilitation Center's occupancy is 88.8%.

Does Bangor Nursing & Rehabilitation Center operate as a for-profit or non-profit?

Bangor Nursing & Rehabilitation Center is registered as a non-profit.

Are there photos of Bangor Nursing & Rehabilitation Center?

Yes — there are 5 photos of Bangor Nursing & Rehabilitation Center in the photo gallery on this page.

What is the address of Bangor Nursing & Rehabilitation Center?

Bangor Nursing & Rehabilitation Center is located at 103 Texas Ave Suite B, Bangor, ME 04401.

What is the phone number of Bangor Nursing & Rehabilitation Center?

(207) 947-4557 will put you in contact with the team at Bangor Nursing & Rehabilitation Center.

Guides for Better Senior Living

Care Cost Calculator: See Prices in Your Area

Nursing Home Data Explorer

Don’t Wait Too Long: 7 Red Flag Signs Your Parent Needs Assisted Living Now

The True Cost of Assisted Living in 2025 – And How Families Are Paying For It

Understanding Senior Living Costs: Pricing Models, Discounts & Financial Assistance