


Total staff
176
Employees
136
Contractors
40
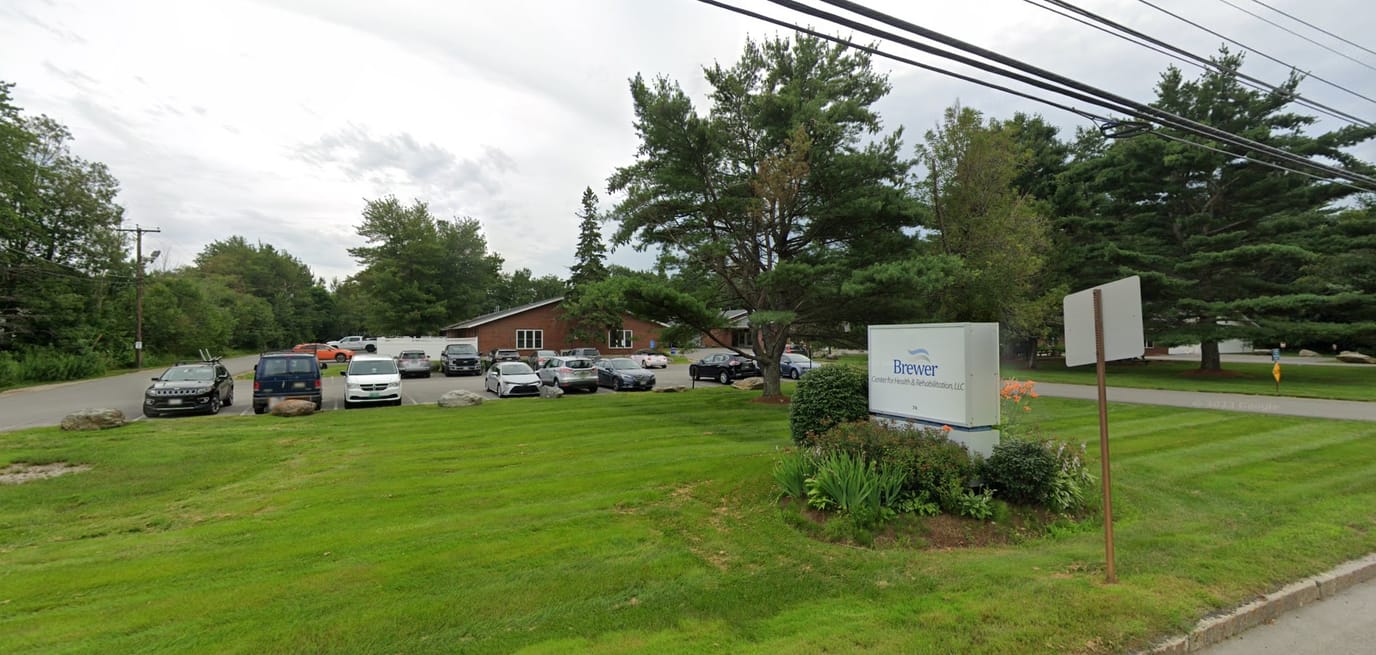
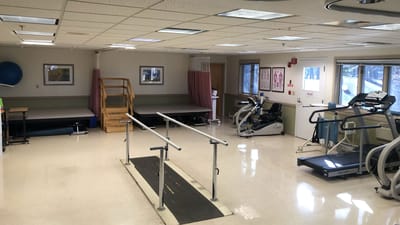


Rehabilitation drives the day-to-day at Brewer Rehab and Living Center, a 111-bed nursing home in Brewer, Maine. Physical, occupational, and speech therapy are all available on-site, and skilled nursing coverage runs deep: wound care, catheter care, ileostomy care, and restorative nursing all show up in the daily routine. A Walk Score of 49 puts the area in somewhat walkable range, useful for a short errand, though most trips off the property still mean a car.
Residents have access to in-house primary care and specialty physicians, and nurse practitioners add another layer of oversight on top of 24-hour skilled nursing staff. There’s also a state-approved Nurse Aide Training and Competency Evaluation Program running on-site, plus an Active Resident Council. That means residents have a structured voice in how the place runs.
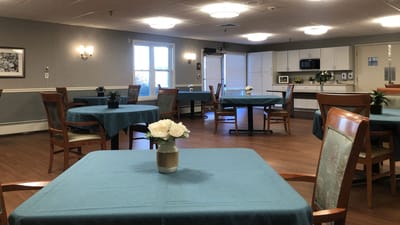
Staffing splits across roles, with registered nurses, licensed nurses, and nurse aides each covering a share of daily care. Nurse aides log the most direct time, around three hours per resident each day. Daily recreation and spiritual programming round out the schedule.
Occupancy sits at 92.3%, and Medicare, Medicaid, and private pay are all accepted. Vk Health Facilities, LLC owns the property.
Its deep clinical oversight, training program for staff, and resident council mean Brewer Rehab and Living Center is a rehabilitation-focused community built around both recovery and resident voice.
| Staff type | Hours / Day / Resident | vs state avg |
|---|---|---|
|
Registered Nurse (RN)
| 1h 22m per day | ▲ 31% State avg: 1h 3m per day · National avg: 41m per day |
|
LPN / LVN
| 31m per day | ▲ 15% State avg: 27m per day · National avg: 52m per day |
|
Nurse Aide
| 3h 3m per day | ▲ 7% State avg: 2h 51m per day · National avg: 2h 21m per day |
|
Weekend Total Nursing
| 4h 26m per day | ▲ 13% State avg: 3h 55m per day · National avg: 3h 26m per day |
|
Physical Therapist
| 4m per day | ▼ 10% State avg: 4m per day · National avg: 4m per day |
|
Weekend RN
| 53m per day | ▲ 21% State avg: 44m per day · National avg: 29m per day |
Reporting period: October 1 – December 31, 2025 (Q4 2025). Source: CMS Payroll-Based Journal report.
Manages medical care and health needs.
Assists with medical care and medications.
Helps with daily care and mobility.
Total hours from contractors
8,251 contractor hours this quarter
| Certified Nursing Assistant | 68 | 10 | 78 | 23,779 | 92 | 100% | 8.4 |
| Registered Nurse | 27 | 4 | 31 | 10,015 | 92 | 100% | 9.1 |
| Licensed Practical Nurse | 12 | 4 | 16 | 4,707 | 92 | 100% | 10.2 |
| Medication Aide/Technician | 10 | 0 | 10 | 4,021 | 92 | 100% | 9.1 |
| Clinical Nurse Specialist | 7 | 0 | 7 | 2,013 | 66 | 72% | 8 |
| Physical Therapy Assistant | 0 | 4 | 4 | 1,817 | 77 | 84% | 7.9 |
| Speech Language Pathologist | 0 | 6 | 6 | 1,815 | 73 | 79% | 7.8 |
| Qualified Social Worker | 0 | 2 | 2 | 913 | 64 | 70% | 7.9 |
| Other Dietary Services Staff | 6 | 0 | 6 | 867 | 80 | 87% | 7 |
| Respiratory Therapy Technician | 0 | 5 | 5 | 551 | 77 | 84% | 6.1 |
| Administrator | 1 | 0 | 1 | 512 | 64 | 70% | 8 |
| Nurse Practitioner | 1 | 0 | 1 | 504 | 63 | 68% | 8 |
| Dietitian | 1 | 0 | 1 | 504 | 59 | 64% | 8.5 |
| Dental Services Staff | 1 | 0 | 1 | 472 | 59 | 64% | 8 |
| Mental Health Service Worker | 1 | 0 | 1 | 464 | 59 | 64% | 7.9 |
| Physical Therapy Aide | 0 | 1 | 1 | 316 | 32 | 35% | 9.9 |
| Occupational Therapy Assistant | 0 | 4 | 4 | 80 | 27 | 29% | 2.6 |
| Nurse Aide in Training | 1 | 0 | 1 | 27 | 10 | 11% | 2.7 |
Federal penalties imposed by CMS for regulatory violations, including civil money penalties (fines) and denials of payment for new Medicare/Medicaid admissions.
Source: CMS Penalties Database (Data as of Jan 2026)
Maine average: $24K
Maine average: 1.2
Maine average: 0.2
No penalties in the past 3 years
No civil money penalties or payment denials were reported in the last 3 years.
These measures show how residents usually do over time at this home, based on health outcomes and preventive care.
Maine average: 14.2
Maine average: 29.1
Maine average: 26.0%
Maine average: 31.4%
Maine average: 29.8%
Maine average: 4.4%
Maine average: 4.5%
Maine average: 2.8%
Maine average: 5.5%
Maine average: 10.5%
Maine average: 19.8%
Maine average: 90.1%
Maine average: 95.5%
Maine average: 1.39
Maine average: 2.08
Maine average: 70.8%
Maine average: 1.4%
Maine average: 74.5%
Maine average: 20.5%
Maine average: 15.6%
Maine average: 0.8%
Maine average: 53.7%
Maine average: 50.6%
Quality measures are calculated from Minimum Data Set (MDS) assessments. For most measures, lower percentages indicate better care quality.
34% of new residents, usually for short-term rehab.
51% of new residents, often for short stays.
15% of new residents, often for long-term daily care.
Source: CMS Long-Term Care Facility Characteristics (Data as of Jan 2026)
Residents meet regularly to discuss policies, care quality, and activities
State-approved Nurse Aide Training and Competency Evaluation Program on-site
Organized group of residents that meets regularly to discuss facility policies, quality of life, and activities.
Data sourced from CMS Long-Term Care Facility Characteristics quarterly report. Payer mix reflects the current resident census by primary payment source.
Historical financial and operational data for Brewer Rehab and Living Center from 2012–2023, based on CMS SNF Cost Reports.
Key figures below are for fiscal year ending in 12/2023.
Based on CMS SNF Cost Report for fiscal year ending in 12/2023.
This home supports both short-term rehab and long-term care, with residents staying for a wide range of durations.
Most new residents arrive under private pay (51% of admissions), and a typical private pay stay runs around 1 - 2 months.
Coverage residents most often arrive under.
Coverage residents most often leave under.
Jessica Porter is the Center Administrator at Brewer Center for Health and Rehabilitation. She brings extensive experience in long-term care, having served in social services and admissions leadership roles. Over the past five years, Jessica has successfully led the center with a focus on patient care and operational efficiency. She holds a degree from the University of Maine at Farmington.
![]() 1.2 miles from city center
1.2 miles from city center
![]() Estimated distance in miles from Brewer's city center to Brewer Rehab and Living Center's address, calculated via Google Maps.
Estimated distance in miles from Brewer's city center to Brewer Rehab and Living Center's address, calculated via Google Maps.
Add your location
The information below is reported by the Maine Department of Health and Human Services, Division of Licensing and Certification.
| Westgate Manor | NH AL HOS MC PC RESC RC SNF | Bangor (Union Street) | 65
Facility
65
ME AVG
20
Rank
#37 / 356 |
96.5%
Facility
96.5%
ME AVG
87.2
Rank
#117 / 240 | +11% | 3.99
Facility
3.99
ME AVG
4.50
Rank
#20 / 34 | +32% | -11% | $0
Facility
$0
ME AVG
$26.4k
Rank
#1 / 34 | 17
Facility
17
ME AVG
28.5
Rank
#4 / 34 | 5.7
Facility
5.7
ME AVG
5.9
Rank
#16 / 34 | - | 63 | A- |
23
Facility
23
ME AVG
31
Rank
#208 / 422 | Rebecca Lopiansky | $11.2MFiscal year ending 12/2023
Facility
$11.2MFiscal year ending 12/2023
ME AVG
$16.9M
Rank
#17 / 40 | $6.2MFiscal year ending 12/2023
Facility
$6.2MFiscal year ending 12/2023
ME AVG
$4.7M
Rank
#24 / 40 | 55.1%Fiscal year ending 12/2023
Facility
55.1%Fiscal year ending 12/2023
ME AVG
37.8%
Rank
#31 / 40 | 205105 | ||||
| Sylvia Ross Home-Assisted Living | NH AL HOS MC SNF | Broadway Bangor | 40
Facility
40
ME AVG
20
Rank
#62 / 356 |
97.5%
Facility
97.5%
ME AVG
87.2
Rank
#113 / 240 | +12% | 4.61
Facility
4.61
ME AVG
4.50
Rank
#11 / 34 | +20% | +2% | $8.0k
Facility
$8.0k
ME AVG
$26.4k
Rank
#18 / 34 | 40
Facility
40
ME AVG
28.5
Rank
#26 / 34 | 5.7
Facility
5.7
ME AVG
5.9
Rank
#16 / 34 | 1 | 39 | - |
95
Facility
95
ME AVG
31
Rank
#4 / 422 | Wanda Pelkey | $17.8MFiscal year ending 12/2023
Facility
$17.8MFiscal year ending 12/2023
ME AVG
$16.9M
Rank
#4 / 40 | $9.2MFiscal year ending 12/2023
Facility
$9.2MFiscal year ending 12/2023
ME AVG
$4.7M
Rank
#7 / 40 | 52%Fiscal year ending 12/2023
Facility
52%Fiscal year ending 12/2023
ME AVG
37.8%
Rank
#24 / 40 | 205064 | ||||
| Brewer Rehab and Living Center | NH HOS PC RC SNF | Brewer | 111
Facility
111
ME AVG
20
Rank
#7 / 356 |
89.5%
Facility
89.5%
ME AVG
87.2
Rank
#149 / 240 | +3% | 4.54
Facility
4.54
ME AVG
4.50
Rank
#15 / 34 | +18% | +1% | $0
Facility
$0
ME AVG
$26.4k
Rank
#1 / 34 | 36
Facility
36
ME AVG
28.5
Rank
#24 / 34 | 4.5
Facility
4.5
ME AVG
5.9
Rank
#9 / 34 | 2 | 99 | - |
49
Facility
49
ME AVG
31
Rank
#113 / 422 | Vk Health Facilities, LLC | $17.2MFiscal year ending 12/2023
Facility
$17.2MFiscal year ending 12/2023
ME AVG
$16.9M
Rank
#10 / 40 | $8.8MFiscal year ending 12/2023
Facility
$8.8MFiscal year ending 12/2023
ME AVG
$4.7M
Rank
#9 / 40 | 51%Fiscal year ending 12/2023
Facility
51%Fiscal year ending 12/2023
ME AVG
37.8%
Rank
#5 / 40 | 205062 | ||||
| Eastside Center for Health and Rehabilitation | NH HOS PC RC SNF | Bangor (Tree Streets) | 69
Facility
69
ME AVG
20
Rank
#35 / 356 |
89.9%
Facility
89.9%
ME AVG
87.2
Rank
#148 / 240 | +3% | 3.50
Facility
3.50
ME AVG
4.50
Rank
#27 / 34 | +20% | -22% | $11.2k
Facility
$11.2k
ME AVG
$26.4k
Rank
#26 / 34 | 26
Facility
26
ME AVG
28.5
Rank
#11 / 34 | 3.3
Facility
3.3
ME AVG
5.9
Rank
#3 / 34 | 3 | 62 | - |
17
Facility
17
ME AVG
31
Rank
#242 / 422 | Robert Cleaves | $9.2MFiscal year ending 12/2023
Facility
$9.2MFiscal year ending 12/2023
ME AVG
$16.9M
Rank
#32 / 40 | $5.0MFiscal year ending 12/2023
Facility
$5.0MFiscal year ending 12/2023
ME AVG
$4.7M
Rank
#27 / 40 | 54.8%Fiscal year ending 12/2023
Facility
54.8%Fiscal year ending 12/2023
ME AVG
37.8%
Rank
#13 / 40 | 205106 | ||||
| Bangor Nursing & Rehabilitation Center | NH MC RC SNF | Bangor (Texas Avenue) | 60
Facility
60
ME AVG
20
Rank
#41 / 356 |
87.0%
Facility
87.0%
ME AVG
87.2
Rank
#161 / 240 | 0% | 3.75
Facility
3.75
ME AVG
4.50
Rank
#23 / 34 | +20% | -17% | $12.8k
Facility
$12.8k
ME AVG
$26.4k
Rank
#28 / 34 | 53
Facility
53
ME AVG
28.5
Rank
#33 / 34 | 5.9
Facility
5.9
ME AVG
5.9
Rank
#20 / 34 | 1 | 52 | - |
13
Facility
13
ME AVG
31
Rank
#265 / 422 | Phillip Bennett | $5.1M*Fiscal year ending 12/2022These figures are from this home's most recent complete cost report — an older period than most facilities report. Compare with that in mind.
Facility
$5.1M*Fiscal year ending 12/2022These figures are from this home's most recent complete cost report — an older period than most facilities report. Compare with that in mind.
ME AVG
$16.9M
Rank
#37 / 40 | $2.0M*Fiscal year ending 12/2022These figures are from this home's most recent complete cost report — an older period than most facilities report. Compare with that in mind.
Facility
$2.0M*Fiscal year ending 12/2022These figures are from this home's most recent complete cost report — an older period than most facilities report. Compare with that in mind.
ME AVG
$4.7M
Rank
#34 / 40 | 38.8%*Fiscal year ending 12/2022These figures are from this home's most recent complete cost report — an older period than most facilities report. Compare with that in mind.
Facility
38.8%*Fiscal year ending 12/2022These figures are from this home's most recent complete cost report — an older period than most facilities report. Compare with that in mind.
ME AVG
37.8%
Rank
#15 / 40 | 205020 |
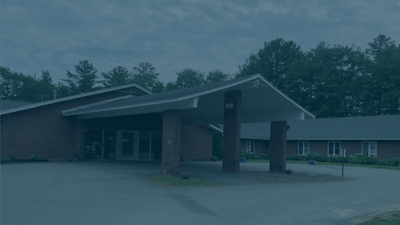
Brewer Rehab and Living Center is located in Brewer, Maine.
Here are the financial assistance programs available to residents in Maine.
Brewer Rehab and Living Center is in the Brewer neighborhood.
Brewer Rehab and Living Center has a walk score of 49. Somewhat walkable. A few nearby services may be reachable on foot, but most trips require transportation.
Brewer Rehab and Living Center's occupancy is 92.3%.
Brewer Rehab and Living Center is registered as a for-profit.
Yes — there are 9 photos of Brewer Rehab and Living Center in the photo gallery on this page.
Brewer Rehab and Living Center is located at 74 Parkway S, Brewer, ME 04412.
(207) 989-7300 will put you in contact with the team at Brewer Rehab and Living Center.
Care Cost Calculator: See Prices in Your Area
Nursing Home Data Explorer
Don’t Wait Too Long: 7 Red Flag Signs Your Parent Needs Assisted Living Now
The True Cost of Assisted Living in 2025 – And How Families Are Paying For It
Understanding Senior Living Costs: Pricing Models, Discounts & Financial Assistance


