Treviso Transitional Care
Nursing Home & Skilled Nursing · Longview, TX
CMS overall rating Info CMS (the Centers for Medicare & Medicaid Services) is the federal agency that rates nursing home quality. Its Overall Rating runs from 1 to 5 stars, combining health inspections, staffing, and quality measures, with inspections weighted most heavily.

Treviso Transitional Care

Nursing Home & Skilled Nursing · Longview, TX
CMS overall rating Info CMS (the Centers for Medicare & Medicaid Services) is the federal agency that rates nursing home quality. Its Overall Rating runs from 1 to 5 stars, combining health inspections, staffing, and quality measures, with inspections weighted most heavily.
Calculator: See prices in your area
Treviso Transitional Care accepts Medicaid, Medicare, and private pay.

Overview of Treviso Transitional Care

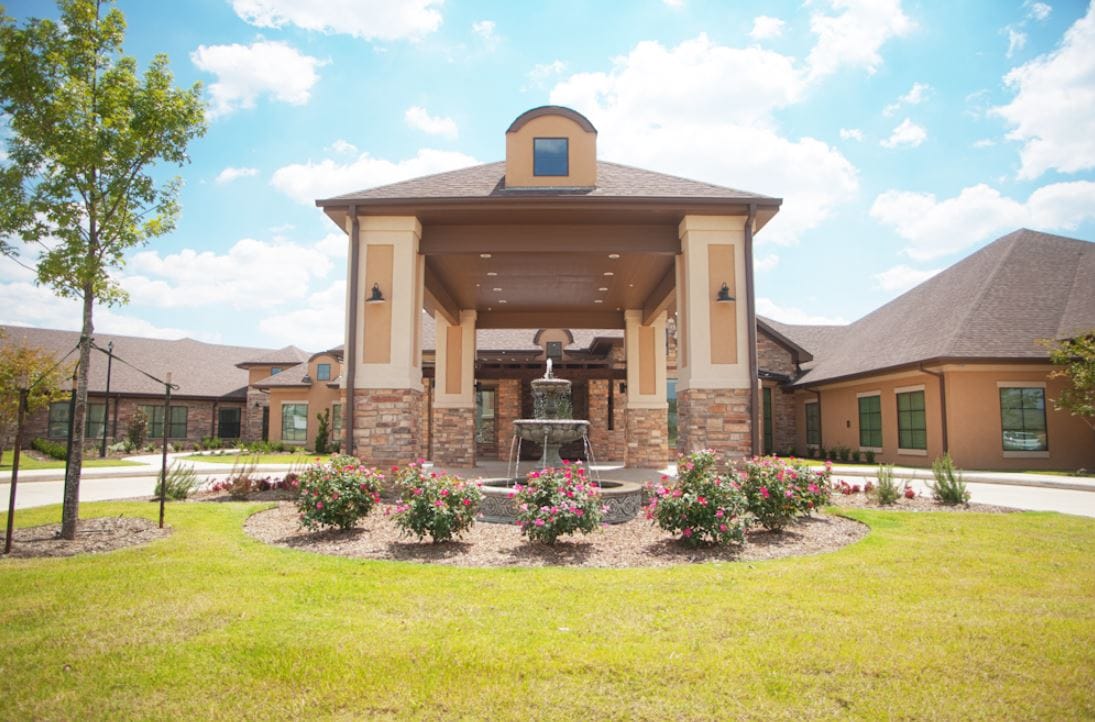
Treviso Transitional Care, situated in Longview, Texas, is a Medicaid and Medicare-certified for-profit nursing home. This facility prioritizes creating a supportive environment where senior residents’ comfort and well-being are prioritized. They also participate in Medicare and Medicaid programs, making this center accessible to many individuals seeking quality senior living options in the Longview area. 

Treviso Transitional Care prides itself on its team of experienced and highly skilled clinicians dedicated to ensuring the best possible care for its residents. With a capacity of 62 beds, this facility caters to both short-term rehabilitation and long-term care needs.

Quality ratings

Measured by Centers for Medicare & Medicaid Services (CMS)

Overall rating Info The Overall CMS Rating combines results from health inspections, staffing levels and quality measures. Health inspections carry the most weight. Staffing and quality scores can increase or decrease the final rating based on performance compared to state and national standards.
▼ 64.2% Below TX avg. ▼ 64.2% Below TX avg.TX average: 2.8Click the badge to see the full State ranking.Click here to see the full State ranking.
Health Inspection Info Based on the results of the facility's three most recent standard inspections and any complaint investigations. CMS reviews the number, scope, and severity of deficiencies, with more recent findings weighted more heavily.
▼ 63.8% Below TX avg. ▼ 63.8% Below TX avg.TX average: 2.8Click the badge to see the full State ranking.Click here to see the full State ranking.
Staffing Info Measures average nursing staff hours per resident per day, including Registered Nurses (RNs) and total nursing staff. Ratings are adjusted based on the level of care residents require and are compared to state and national benchmarks.
▼ 52.9% Below TX avg. ▼ 52.9% Below TX avg.TX average: 2.1Click the badge to see the full State ranking.Click here to see the full State ranking.
Quality Measures Info Based on clinical and physical health indicators reported to CMS, such as hospital readmissions, falls, pressure ulcers, and improvements in mobility. These measures reflect how well residents' health needs are being managed.
▲ 6.5% Above TX avg. ▲ 6.5% Above TX avg.TX average: 3.8Click the badge to see the full State ranking.Click here to see the full State ranking.

Staffing hours breakdown

Info Daily nursing hours per resident by staff type, reported to CMS. Higher is generally better — compare this facility to state and national averages to see where staffing stands.

Hours per resident per day — compared to Texas state averages

Total nursing care / resident Info This home is ranked 146th out of 296 homes in Texas for nurse hours. Total adjusted nursing hours per resident per day, combining RN, LPN, and aide time. CMS adjusts this for case-mix so facilities can be fairly compared.
3h 29m per day
Rank #146 / 296Nurse hours — State benchmarkedThis home is ranked 146th out of 296 homes in Texas. Shows adjusted nurse hours per resident per day benchmarked to the Texas average, with a ranking across 296 Texas facilities. More hours mean more direct care. The national average is about 3.5 hrs; below 3.0 is a red flag.Rankings are based only on facilities in Texas that report data for that category. Facilities without available data are excluded from the ranking.Click the rank badge to see the full State ranking.Click here to see the full State ranking.
This facility Texas avg (3h 38m per day)
vs Texas avg
-4%

3 of 6 metrics below state avg

Standout metric LPN / LVN is +6% above state avg
Staff typeHours / Day / Residentvs state avg
Registered Nurse (RN) Info RNs hold the highest nursing license and can assess residents, interpret test results, and direct care plans. More RN hours per day often signals stronger clinical oversight and faster response to health changes. 14m per day ▼ 45% State avg: 26m per day · National avg: 41m per day
LPN / LVN Info Licensed Practical Nurses (LPNs) or Licensed Vocational Nurses (LVNs) deliver routine hands-on care — medication administration, wound dressing, and monitoring vital signs. They work under RN supervision and make up a large share of daily bedside care. 1h 0m per day ▲ 6% State avg: 57m per day · National avg: 52m per day
Nurse Aide Info Certified Nurse Aides (CNAs) provide the most direct day-to-day assistance: bathing, dressing, feeding, and mobility. Nurse aide hours are typically the largest staffing category and directly affect residents' quality of life. 2h 1m per day ■ Avg State avg: 2h 1m per day · National avg: 2h 21m per day
Weekend Total Nursing Info Combined nursing hours (RN + LPN + Nurse Aide) per resident per day on weekends. Staffing often drops on weekends — this figure reveals whether the facility maintains adequate coverage outside of weekday hours. 2h 55m per day ■ Avg State avg: 2h 59m per day · National avg: 3h 26m per day
Physical Therapist Info Hours per resident per day provided by licensed Physical Therapists (PTs) or PT Assistants. PT services help residents recover mobility after injury or illness and are especially important for post-acute (short-stay) rehabilitation. 3m per day ▼ 26% State avg: 4m per day · National avg: 4m per day
Weekend RN Info Registered nurse hours specifically on weekends. Facilities sometimes reduce RN presence on Saturdays and Sundays — a low weekend RN figure compared to weekday hours can indicate reduced clinical oversight when most administrative staff are absent. 14m per day ▼ 32% State avg: 21m per day · National avg: 29m per day

Capacity and availability

Avg. Length of Stay Info Average number of days residents stay at this facility, based on CMS cost report data. Shorter stays often reflect post-acute or rehab care; longer stays reflect long-term care.
65 days
Bed community size
140-bed community Rank #86 / 988Bed count — State benchmarkedThis home is ranked 86th out of 988 homes in Texas. Shows this facility's certified or reported bed count compared to other Texas facilities. Larger communities may offer more amenities, programs, and on-site services for residents and families.Rankings are based only on facilities in Texas that report data for that category. Facilities without available data are excluded from the ranking.Click the rank badge to see the full State ranking.Click here to see the full State ranking.
A larger shared setting that may offer more common spaces and organized community services.
Years in operation
11 years in operation Rank #390 / 583Years in operation — State benchmarkedThis home is ranked 390th out of 583 homes in Texas. Shows how long this facility has been in operation compared to other Texas facilities. Longer operating histories may benefit residents, families, and staff.Rankings are based only on facilities in Texas that report data for that category. Facilities without available data are excluded from the ranking.Click the rank badge to see the full State ranking.Click here to see the full State ranking.
A community with a solid operating history and experience delivering ongoing care.
Walk Score
Walk Score: 32 / 100 Rank #902 / 1391Walk Score — State benchmarkedThis home is ranked 902nd out of 1391 homes in Texas. Shows how walkable this facility's neighborhood is compared to the average Walk Score across Texas facilities. Higher scores benefit residents, families, and staff.Rankings are based only on facilities in Texas that report data for that category. Facilities without available data are excluded from the ranking.Click the rank badge to see the full State ranking.Click here to see the full State ranking.
Somewhat walkable. A few nearby services may be reachable on foot, but most trips require transportation.

About this community

License Details

Facility TypeNursing
StatusLicensed
IssuanceJanuary 9, 2023
ExpirationJanuary 9, 2026 Expired
CountyGregg
License Number311636
Year Opened9/3/2014
QualificationNursing

Ownership & Operating Entity

Treviso Transitional Care is administered by Matthew Mewborn.

Management CompanyHMG PARK MANOR OF LONGVIEW, LLC
OwnerWinnie-Stowell Hospital District
Ownership TypeHOSPITAL DISTRICT/AUTHORITY

Type Of Units

Medicare
63 units
Medicaid and Medicare
77 units
Total beds
140 units

Staffing

Key information about the people who lead and staff this community.

Leadership

Memory & Specialized Care

1 service
No Alzheimer's certification

Contact Treviso Transitional Care

Inspection History

In Texas, the Health and Human Services Commission (HHSC) is the primary regulatory body that conducts unannounced inspections and publishes quality reports for all long-term care homes.

Since 2023 · 3 years of data 3 citations

Inspection Scorecard Info This scorecard compares key inspection, citation, and complaint metrics at this facility against the Texas state average. Metrics rated ≥15% worse than average are highlighted in red; those ≥15% better are highlighted in green.

Since 2023 vs. Texas state average
Overall vs. TX average 1 Worse Metrics worse than Texas average:
• Health citations (50% above)
3 Better Metrics better than Texas average:
• Total citations (50% below)
• Life safety citations (50% below)
• Citations per year (50% below)
Latest Inspection August 26, 2025 Routine

Citations Info Citations are formal regulatory issues recorded during state inspections.

This FacilityTX Averagevs. TX Avg
Total citations Info Formal regulatory issues recorded by inspectors across all inspection types. 36 This facility has 50% fewer total citations than a typical Texas nursing home (3 vs. TX avg 6).↓ 50% better
Health citations Info Citations related to resident care, clinical practices, and day-to-day operations. 32 This facility has 50% more health citations than a typical Texas nursing home (3 vs. TX avg 2).↑ 50% worse
Life safety citations Info Citations related to building safety — fire prevention, emergency egress, and similar. 36 This facility has 50% fewer life safety citations than a typical Texas nursing home (3 vs. TX avg 6).↓ 50% better
Citations per year Info Average citations per year since 2023. 12 This facility has 50% fewer citations per year than a typical Texas nursing home (1 vs. TX avg 2).↓ 50% better

Inspection Reports Summary Info An editor-reviewed summary of the themes and findings across this facility's recent inspection reports.

  • The most recent inspection on August 26, 2025, found 13 deficiencies including infection control, care planning, respiratory care, and resident dignity issues.
  • A November 15, 2023, complaint investigation substantiated Immediate Jeopardy for failure to prevent and report a resident elopement, with inadequate supervision and delayed investigation.
  • Multiple complaint investigations in 2024 found substantiated issues with call light malfunctions, delayed hospital transfers, verbal abuse, medication errors, and property theft by staff.

Health Inspection History

Inspections since 2023
Total health inspections 7

Texas average 7.4


Last Health inspection on Aug 2025

Total health citations
51 Rank #281 / 299Health citations — State benchmarkedThis home is ranked 281st out of 299 homes in Texas. Shows this facility's total health deficiency citations benchmarked to the Texas State average, with a ranking across all 299 TX facilities. Lower citation counts earn a better rank.Rankings are based only on facilities in Texas that report data for that category. Facilities without available data are excluded from the ranking.Click the rank badge to see the full State ranking.Click here to see the full State ranking.

Texas average 25.9

Citations per inspection
7.29 Rank #294 / 299Citations per inspection — State benchmarkedThis home is ranked 294th out of 299 homes in Texas. Shows average deficiency citations per CMS inspection for this facility versus the Texas mean across 299 facilities with citation data. Lower is better.Rankings are based only on facilities in Texas that report data for that category. Facilities without available data are excluded from the ranking.Click the rank badge to see the full State ranking.Click here to see the full State ranking.

Texas average 3.67


Health citations are formal notices following inspections when they fail to comply with safety and care standards.

37 of 51 citations resulted from standard inspections; and 14 of 51 resulted from complaint investigations.

Breakdown of citation severity (last 3 years)
Critical health citations
4
100% worse than Texas average

Texas average: 2


Serious health citations
0
100% better than Texas average

Texas average: 0.4

4 critical citations Texas average: 2

0 serious citations Texas average: 0.4

47 moderate citations Texas average: 23

0 minor citations Texas average: 0.4
Citations history (last 3 years)
Abuse/Neglect moderate citation Aug 26, 2025
Corrected

Infection Control moderate citation Aug 26, 2025
Corrected

Nutrition moderate citation Aug 26, 2025
Corrected

Quality of Care moderate citation Aug 26, 2025
Corrected

Staffing Data

Reporting period: October 1 – December 31, 2025 (Q4 2025). Source: CMS Payroll-Based Journal report.

Total staff 115
Employees 95
Contractors 20
Staff to resident ratio 1.24 : 1
16% fewer staff per resident than Texas average
Texas average ratio: 1.48 : 1 Texas average ratio: 1.48 : 1See full Texas ranking
Avg staff/day 47
Average shift 8.4 hours
0% compared with Texas average
Texas average: 8.1 hours Texas average shift: 8.1 hoursSee full Texas ranking
Total staff hours (quarter) 36,368

Nursing staff breakdown

Q4 2025 · Oct 1 – Dec 31 More info This data comes from the CMS Payroll-Based Journal report covering October 1 – December 31, 2025.
Registered Nurse

Manages medical care and health needs.

RN Staff Info All 8 RN Staff are full-time employees. No contractors work on this role. 8
Average shift length Info Average shift length. Calculated as total hours divided by days worked and average staff per day. 8.3 hours
Licensed Practical Nurse

Assists with medical care and medications.

LPN Staff Info All 30 LPN Staff are full-time employees. No contractors work on this role. 30
Average shift length Info Average shift length. Calculated as total hours divided by days worked and average staff per day. 8.9 hours
Certified Nursing Assistant

Helps with daily care and mobility.

CNA Staff Info All 46 CNA Staff are full-time employees. No contractors work on this role. 46
Average shift length Info Average shift length. Calculated as total hours divided by days worked and average staff per day. 8.5 hours

Contractor staffing

Q4 2025 · Oct 1 – Dec 31 More info This data comes from the CMS Payroll-Based Journal report covering October 1 – December 31, 2025.

Total hours from contractors

12%

4,346 contractor hours this quarter

Speech Language Pathologist: 6 Physical Therapy Aide: 5 Physical Therapy Assistant: 3 Respiratory Therapy Technician: 2 Occupational Therapy Aide: 2 Qualified Social Worker: 1 Medical Director: 1

Staff by category

Q4 2025 · Oct 1 – Dec 31 More info This data comes from the CMS Payroll-Based Journal report covering October 1 – December 31, 2025.
Certified Nursing Assistant4604616,31192100%8.5
Licensed Practical Nurse300309,27192100%8.9
Medication Aide/Technician6062,35392100%10
Registered Nurse8081,7198896%8.3
Physical Therapy Aide0551,4568795%6.4
Speech Language Pathologist0661,3467278%7.4
Dietitian1015065762%8.9
Physical Therapy Assistant0334957076%6.8
Dental Services Staff1014836065%8.1
Nurse Practitioner1014806470%7.5
Mental Health Service Worker1014806470%7.5
Qualified Social Worker0114656267%7.5
Respiratory Therapy Technician0224577278%6.2
Administrator1014205661%7.5
Occupational Therapy Aide022972729%3.6
Medical Director011301213%2.5
46 Certified Nursing Assistant
% of Days 100%
30 Licensed Practical Nurse
% of Days 100%
6 Medication Aide/Technician
% of Days 100%
8 Registered Nurse
% of Days 96%
5 Physical Therapy Aide
% of Days 95%
6 Speech Language Pathologist
% of Days 78%
1 Dietitian
% of Days 62%
3 Physical Therapy Assistant
% of Days 76%
1 Dental Services Staff
% of Days 65%
1 Nurse Practitioner
% of Days 70%
1 Mental Health Service Worker
% of Days 70%
1 Qualified Social Worker
% of Days 67%
2 Respiratory Therapy Technician
% of Days 78%
1 Administrator
% of Days 61%
2 Occupational Therapy Aide
% of Days 29%
1 Medical Director
% of Days 13%

Penalties and fines

Includes penalties issued in 2023

Federal penalties imposed by CMS for regulatory violations, including civil money penalties (fines) and denials of payment for new Medicare/Medicaid admissions.

Source: CMS Penalties Database (Data as of Jan 2026)

Total fines amount $151K Rank #274 / 301Federal fines — State benchmarkedThis home is ranked 274th out of 301 homes in Texas. Shows this facility's cumulative CMS federal fine dollars versus the Texas average among facilities with fines, and where it ranks among 301 facilities in the pool. Lower total dollars mean a better rank.Rankings are based only on facilities in Texas that report data for that category. Facilities without available data are excluded from the ranking.Click the rank badge to see the full State ranking.Click here to see the full State ranking.
87% higher than Texas average

Texas average: $80K

Number of fines 1
60% fewer fines than Texas average

Texas average: 2.5

Payment Denials Info Serious action where Medicare and/or Medicaid temporarily stops payments for new residents until issues are fixed. 1
354% more payment denials than Texas average

Texas average: 0.2

Fines amount comparison
This facility $151K
Texas average $80K
Penalty History

Penalties are imposed by CMS for violations of federal nursing home regulations.

2 penalties in the past 3 years

Multiple penalties were reported in the last 3 years.

Civil Money Penalty Info Fines imposed for noncompliance, which can be assessed per day or per instance of violation. Oct 12, 2023
$151K
Payment Denial Info Serious action where Medicare and/or Medicaid temporarily stops payments for new residents until issues are fixed. Oct 12, 2023
5 days

Last updated: Jan 2026

Quality of care over time

These measures show how residents usually do over time at this home, based on health outcomes and preventive care.

High-risk clinical events score Info A composite score based on pressure ulcers, falls with injury, weight loss, walking ability decline, and activities of daily living decline. 3.6
59% better than Texas average

Texas average: 8.6

Functional decline score Info A composite score based on activities of daily living decline, walking ability decline, and incontinence. 8.8
45% better than Texas average

Texas average: 16.0

Long-stay resident measures
Significantly above average Texas avg: 4.1 Info CMS star rating based on long-stay quality measure performance. 5 stars = significantly above average, 1 star = significantly below average.
Need for Help with Daily Activities Increased Info Percent of long-stay residents whose need for help with daily activities has increased 8.8%
45% better than Texas average

Texas average: 16.2%

Walking Ability Worsened Info Percent of long-stay residents whose ability to move independently worsened 7.1%
56% better than Texas average

Texas average: 16.2%

Low Risk Residents with Bowel/Bladder Incontinence Info Percent of low risk long-stay residents who lose control of their bowels or bladder 10.5%
33% better than Texas average

Texas average: 15.7%

Falls with Major Injury Info Percent of long-stay residents experiencing one or more falls with major injury 0.8%
77% better than Texas average

Texas average: 3.2%

High Risk Residents with Pressure Ulcers Info Percent of long-stay high risk residents with pressure ulcers 0.6%
86% better than Texas average

Texas average: 4.4%

Urinary Tract Infection Info Percent of long-stay residents with a urinary tract infection 0.0%
100% better than Texas average

Texas average: 0.8%

Lost Too Much Weight Info Percent of long-stay residents who lose too much weight 0.5%
87% better than Texas average

Texas average: 3.5%

Depressive Symptoms Info Percent of long-stay residents who have depressive symptoms 1.2%
58% better than Texas average

Texas average: 2.9%

Antipsychotic Use Info Percent of long-stay residents who received an antipsychotic medication 1.2%
85% better than Texas average

Texas average: 7.9%

Pneumococcal Vaccine Info Percent of long-stay residents assessed and appropriately given the pneumococcal vaccine 100.0%
In line with Texas average

Texas average: 97.3%

Influenza Vaccine Info Percent of long-stay residents assessed and appropriately given the seasonal influenza vaccine 100.0%
In line with Texas average

Texas average: 97.9%

Hospitalizations per 1,000 days Info Number of hospitalizations per 1,000 long-stay resident days. 3.67
72% worse than Texas average

Texas average: 2.13

ED visits per 1,000 days Info Number of outpatient emergency department visits per 1,000 long-stay resident days. 2.07
In line with Texas average

Texas average: 2.07

Short-stay resident measures
Average Texas avg: 3.1 Info CMS star rating based on short-stay quality measure performance. 5 stars = much above average, 1 star = much below average.
Pneumococcal Vaccine Info Percent of short-stay residents assessed and appropriately given the pneumococcal vaccine 99.9%
10% better than Texas average

Texas average: 90.4%

Antipsychotic medication increase Info Percent of short-stay residents who newly received an antipsychotic medication 0.4%
75% better than Texas average

Texas average: 1.4%

Influenza Vaccine Info Percent of short-stay residents assessed and appropriately given the seasonal influenza vaccine 99.5%
13% better than Texas average

Texas average: 88.0%

Re-hospitalized after SNF stay Info Percentage of short-stay residents who were re-hospitalized after their nursing home admission. 23.3%
10% better than Texas average

Texas average: 25.9%

Emergency department visits Info Percentage of short-stay residents who had an outpatient emergency department visit. 16.0%
33% worse than Texas average

Texas average: 12.0%

Falls with major injury Info Percentage of SNF residents who experience falls with major injury during their stay. 0.0%
100% better than Texas average

Texas average: 0.8%

Ability to care for self at discharge Info Percentage of residents at or above expected ability to care for themselves at discharge. 67.1%
25% better than Texas average

Texas average: 53.7%

Successful return to home or community Info Rate of successful return to home or community from a skilled nursing facility. 54.4%
8% better than Texas average

Texas average: 50.6%

Breakdown by payment type

Medicare

29% of new residents, usually for short-term rehab.

Typical stay 26 days

Private pay

64% of new residents, often for short stays.

Typical stay 28 days

Medicaid

6% of new residents, often for long-term daily care.

Typical stay 1 - 2 years

Facility Characteristics

Source: CMS Long-Term Care Facility Characteristics (Data as of Jan 2026)

Total residents 93
Medicare
3
3.2% of residents
Medicaid
62
66.7% of residents
Private pay or other
28
30.1% of residents
Programs & Services
Residents Group

Residents meet regularly to discuss policies, care quality, and activities

Active Resident Council

Organized group of residents that meets regularly to discuss facility policies, quality of life, and activities.

Finances and operations

Based on CMS SNF Cost Report for fiscal year ending in 08/2024.

For-profit
Operated by a single business entity.
Net patient revenue Info Net patient revenue — what the home actually collects for resident care, after contractual allowances, bad debt and discounts are subtracted from its gross charges (CMS cost report, Worksheet G-3). It covers resident care only; money the home earns from other sources is shown separately as "Other income."
$6.6M
Net patient income Info Net patient income: net patient revenue minus the home's total operating expenses. A positive figure means it earns more from resident care than it spends to deliver it; a negative figure means the opposite. It excludes non-operating "other income."
-$1.1M
For-profit Operated by a single business entity.
Net patient revenue Info Net patient revenue — what the home actually collects for resident care, after contractual allowances, bad debt and discounts are subtracted from its gross charges (CMS cost report, Worksheet G-3). It covers resident care only; money the home earns from other sources is shown separately as "Other income."
$6.6M Rank #132 / 304Revenue — State benchmarkedThis home is ranked 132nd out of 304 homes in Texas. Shows this facility's annual revenue compared to the Texas average. Higher revenue generally means more resources for staffing and capital — read alongside Payroll %.Rankings are based only on facilities in Texas that report data for that category. Facilities without available data are excluded from the ranking.Click the rank badge to see the full State ranking.Click here to see the full State ranking.
Net patient income Info Net patient income: net patient revenue minus the home's total operating expenses. A positive figure means it earns more from resident care than it spends to deliver it; a negative figure means the opposite. It excludes non-operating "other income."
-$1.1M
Payroll costs Info Staff salaries plus wage-related costs — benefits such as payroll taxes, health insurance and retirement — from the home's own accounting records (CMS cost report, Worksheet A). Contract or agency labor is counted separately, under other operating costs. Rank #211 / 304Payroll — State benchmarkedThis home is ranked 211th out of 304 homes in Texas. Shows total annual staff payroll benchmarked to the Texas average. Higher payroll investment relative to peers often signals better staffing and less reliance on cheaper contract labor.Rankings are based only on facilities in Texas that report data for that category. Facilities without available data are excluded from the ranking.Click the rank badge to see the full State ranking.Click here to see the full State ranking.
$3.4M 51.1% of net patient revenue Info Payroll as a share of revenue: staff salaries and wage-related benefits divided by net patient revenue. A higher figure means more of each revenue dollar goes to staff pay. Rank #267 / 304Payroll % — State benchmarkedThis home is ranked 267th out of 304 homes in Texas. Shows payroll as a percentage of revenue versus the Texas average. Well-run Texas facilities typically land around 51–63% — the top third Statewide. Below 25% may signal understaffing or heavy agency use — read with Staffing ratings.Rankings are based only on facilities in Texas that report data for that category. Facilities without available data are excluded from the ranking.Click the rank badge to see the full State ranking.Click here to see the full State ranking.
Other operating costs Info Everything it costs to run the home apart from payroll — food, utilities, supplies, maintenance, contract labor and administration. Calculated as total operating expense minus payroll (staff salaries and wage-related benefits).
$4.3M
Total costs Info The home's total operating expense for the year — all the costs of running it, salaries included (CMS cost report, Worksheet G-3).
$7.7M

Who this home usually serves

TYPE OF STAY

Primarily short stays

Residents typically stay for brief periods, with frequent admissions and discharges throughout the year.

Most new residents arrive under private pay (64% of admissions), and a typical private pay stay runs around 28 days.

Admissions
407 total

Coverage residents most often arrive under.

Medicare 29%
Private pay 64%
Medicaid 6%
Discharges
362 total

Coverage residents most often leave under.

Medicare 27%
Private pay 64%
Medicaid 10%

Places of interest near Treviso Transitional Care

Address 3.5 miles from city center Info Estimated distance in miles from Longview's city center to Treviso Transitional Care's address, calculated via Google Maps.

Calculate Travel Distance to Treviso Transitional Care

Add your location

Address

Compare Nursing Homes around Longview

The information below is reported by the Texas Health and Human Services Commission.

4 facilities compared · CMS & TX Dept. of Health data

Highland Pines Nursing and Rehabilitation Center
NH
PC
SNF
Longview
171
Facility 171
TX AVG 80
Rank #36 / 988
64.2%
Facility 64.2%
TX AVG 63.5%
Rank #170 / 304
+1%
3.75
Facility 3.75
TX AVG 3.63
Rank #93 / 296
+1%+3%
$17.6k
Facility $17.6k
TX AVG $81.8k
Rank #129 / 301
48
Facility 48
TX AVG 25.9
Rank #273 / 299
6.9
Facility 6.9
TX AVG 3.7
Rank #292 / 299
195-
53
Facility 53
TX AVG 41
Rank #433 / 1391
Hp Nursing & Rehab LLC
$9.4MFiscal year ending 12/2023
Facility $9.4MFiscal year ending 12/2023
TX AVG $8.4M
Rank #148 / 304
$5.0MFiscal year ending 12/2023
Facility $5.0MFiscal year ending 12/2023
TX AVG $3.5M
Rank #113 / 304
53.2%Fiscal year ending 12/2023
Facility 53.2%Fiscal year ending 12/2023
TX AVG 47%
Rank #90 / 304
675133
Longview Hill Nursing Center and Rehabilitation
NH
HOS
MC
PC
RC
SNF
Longview (Pegues Estates)
198
Facility 198
TX AVG 80
Rank #13 / 988
62.1%
Facility 62.1%
TX AVG 63.5%
Rank #183 / 304
-2%
3.85
Facility 3.85
TX AVG 3.63
Rank #93 / 296
-7%+6%
$256.6k
Facility $256.6k
TX AVG $81.8k
Rank #291 / 301
69
Facility 69
TX AVG 25.9
Rank #296 / 299
6.9
Facility 6.9
TX AVG 3.7
Rank #292 / 299
7115A+
42
Facility 42
TX AVG 41
Rank #682 / 1391
Regency Ihs Of Longview LLC
$8.7MFiscal year ending 12/2023
Facility $8.7MFiscal year ending 12/2023
TX AVG $8.4M
Rank #182 / 304
$5.5MFiscal year ending 12/2023
Facility $5.5MFiscal year ending 12/2023
TX AVG $3.5M
Rank #72 / 304
63.5%Fiscal year ending 12/2023
Facility 63.5%Fiscal year ending 12/2023
TX AVG 47%
Rank #22 / 304
455684
Treviso Transitional Care
NH
SNF
Longview (East Hawkins Parkway)
140
Facility 140
TX AVG 80
Rank #86 / 988
--
3.48
Facility 3.48
TX AVG 3.63
Rank #146 / 296
-9%-4%
$150.7k
Facility $150.7k
TX AVG $81.8k
Rank #274 / 301
51
Facility 51
TX AVG 25.9
Rank #281 / 299
7.3
Facility 7.3
TX AVG 3.7
Rank #294 / 299
412-
32
Facility 32
TX AVG 41
Rank #902 / 1391
Hmg Park Manor Of Longview, LLC
$6.6MFiscal year ending 08/2024
Facility $6.6MFiscal year ending 08/2024
TX AVG $8.4M
Rank #132 / 304
$3.4MFiscal year ending 08/2024
Facility $3.4MFiscal year ending 08/2024
TX AVG $3.5M
Rank #211 / 304
51.1%Fiscal year ending 08/2024
Facility 51.1%Fiscal year ending 08/2024
TX AVG 47%
Rank #267 / 304
676368
Whispering Pines Lodge
NH
MC
SNF
Longview
116
Facility 116
TX AVG 80
Rank #275 / 988
69.2%
Facility 69.2%
TX AVG 63.5%
Rank #138 / 304
+9%
3.85
Facility 3.85
TX AVG 3.63
Rank #93 / 296
+22%+6%
$624.5k
Facility $624.5k
TX AVG $81.8k
Rank #301 / 301
52
Facility 52
TX AVG 25.9
Rank #283 / 299
4.0
Facility 4.0
TX AVG 3.7
Rank #215 / 299
1263-
15
Facility 15
TX AVG 41
Rank #1167 / 1391
-
$6.6MFiscal year ending 12/2023
Facility $6.6MFiscal year ending 12/2023
TX AVG $8.4M
Rank #226 / 304
$4.2MFiscal year ending 12/2023
Facility $4.2MFiscal year ending 12/2023
TX AVG $3.5M
Rank #209 / 304
63.5%Fiscal year ending 12/2023
Facility 63.5%Fiscal year ending 12/2023
TX AVG 47%
Rank #104 / 304
675386

Financial Assistance for
Nursing Home in Texas

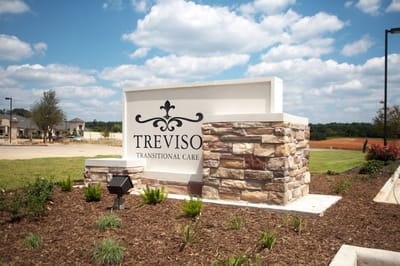
Treviso Transitional Care is located in Longview, Texas.
Here are the financial assistance programs available to residents in Texas.

Get Financial aid guidance

Community Care for the Aged and Disabled (CCAD)

TX Medicaid CCAD

Age 65+ or disabled
General Texas resident, Medicaid-eligible, care need (not always nursing home level).
Income Limits (2025) ~$2,829/month 300% FBR, individual
Asset Limits $2,000 (individual), $3,000 (couple).
TX

Large state; rural access challenges.

Benefits
Personal care (5-7 hours/day) Respite (240 hours/year) Adult day care (~$60/day) Home aides

Texas Community Care Services

TX CCS

Age 60+
General Texas resident, at risk of decline.
Income Limits ~$2,000/month individual, varies
Asset Limits $5,000 individual
TX

Limited funding; high demand in urban areas.

Benefits
In-home care (3-5 hours/week) Respite (up to 10 days/year) Transportation (~5 trips/month)

Area Agency on Aging (AAA) Services

Texas AAA Services

Age 60+
General TX resident; no income/asset limits.
Income Limits (2025) None; donations encouraged.
Asset Limits Not assessed.
TX

28 AAAs; includes Meals on Wheels in some areas.

Benefits
Meals (~$5-$7/meal) Transportation Homemaker services (~4 hours/week) Respite (~5 days/year) Legal aid

Medicare Savings Program (MSP)

Texas Medicare Savings Program

Age 65+ or disabled
General TX resident, Medicare Part A/B.
Income Limits (2025) ~$2,510/month (QMB), ~$3,380/month (SLMB), ~$3,598/month (QI)—individual.
Asset Limits $9,430 (individual), $14,130 (couple).
TX

Includes Extra Help for Part D; no waitlist.

Benefits
Covers Part B premiums ($174.70/month) Deductibles ($240/year) Copays (~20%)

Family Caregiver Support Program (FCSP)

Texas Family Caregiver Support Program

Age
General Caregivers of 60+ needing care or 55+ caregivers of others; TX resident; 2+ ADLs.
Income Limits (2025) No strict cap; prioritizes low-income ~$24,980/year
Asset Limits Not assessed.
TX

High rural demand; includes grandparent caregivers.

Benefits
Respite (4-6 hours/week or 5 days/year) Adult day care ($60/day) Training Supplies (~$500/year)

VA Aid and Attendance (A&A) and Housebound Benefits

Texas VA Aid and Attendance/Housebound

Age 65+ or disabled veteran/spouse
General TX resident, wartime service, ADL help (A&A) or homebound.
Income Limits (2025) Net income < ~$1,984/month (veteran with dependent, A&A); pension offsets income.
Asset Limits ~$155,356 net worth
TX

High veteran population; supports rural/urban needs.

Benefits
Cash (~$1,433-$2,642/month veteran, ~$951-$1,318 spouse) for care costs

Property Tax Exemption for Seniors

Texas Senior Property Tax Exemption

Age 65+
General TX resident, homeowner (homestead).
Income Limits (2025) None; tax-based eligibility.
Asset Limits Not assessed.
TX

$25,000+ exemption; optional freeze in some counties; saves ~$500-$1,000/year.

Benefits
Tax exemption or freeze (~$500-$1,000/year savings)

Senior Farmers’ Market Nutrition Program (SFMNP)

Texas SFMNP

Age 60+
General TX resident, low-income.
Income Limits (2025) ~$2,322/month 185% FPL
Asset Limits Not assessed.
TX

Vouchers (~$50/season); serves ~20,000 via 28 AAAs.

Benefits
Vouchers (~$50/season) for produce at farmers’ markets

Frequently Asked Questions about Treviso Transitional Care

What neighborhood is Treviso Transitional Care in?

Treviso Transitional Care is in the East Hawkins Parkway neighborhood of Longview.

Who is the owner of Treviso Transitional Care?

Treviso Transitional Care is legally operated by Winnie-Stowell Hospital District, and administered by Matthew Mewborn.

Is Treviso Transitional Care in a walkable area?

Treviso Transitional Care has a walk score of 32. Somewhat walkable. A few nearby services may be reachable on foot, but most trips require transportation.

What is the license number of Treviso Transitional Care?

According to TX state health department records, Treviso Transitional Care's license number is 311636.

When does Treviso Transitional Care's license expire?

According to TX state health department records, Treviso Transitional Care's license expires on January 9, 2026.

What is the occupancy rate at Treviso Transitional Care?

Treviso Transitional Care's occupancy is 50.5%.

Does Treviso Transitional Care operate as a for-profit or non-profit?

Treviso Transitional Care is registered as a for-profit in TX.

Guides for Better Senior Living

Care Cost Calculator: See Prices in Your Area

Nursing Home Data Explorer

Don’t Wait Too Long: 7 Red Flag Signs Your Parent Needs Assisted Living Now

The True Cost of Assisted Living in 2025 – And How Families Are Paying For It

Understanding Senior Living Costs: Pricing Models, Discounts & Financial Assistance