Capitol Hill Healthcare in Montgomery
Nursing Home & Memory Care · Montgomery, AL
CMS overall rating Info CMS (the Centers for Medicare & Medicaid Services) is the federal agency that rates nursing home quality. Its Overall Rating runs from 1 to 5 stars, combining health inspections, staffing, and quality measures, with inspections weighted most heavily.

Capitol Hill Healthcare in Montgomery

Nursing Home & Memory Care · Montgomery, AL
CMS overall rating Info CMS (the Centers for Medicare & Medicaid Services) is the federal agency that rates nursing home quality. Its Overall Rating runs from 1 to 5 stars, combining health inspections, staffing, and quality measures, with inspections weighted most heavily.
Calculator: See prices in your area
Capitol Hill Healthcare in Montgomery accepts Medicare, Medicaid, and private pay.

Overview of Capitol Hill Healthcare in Montgomery

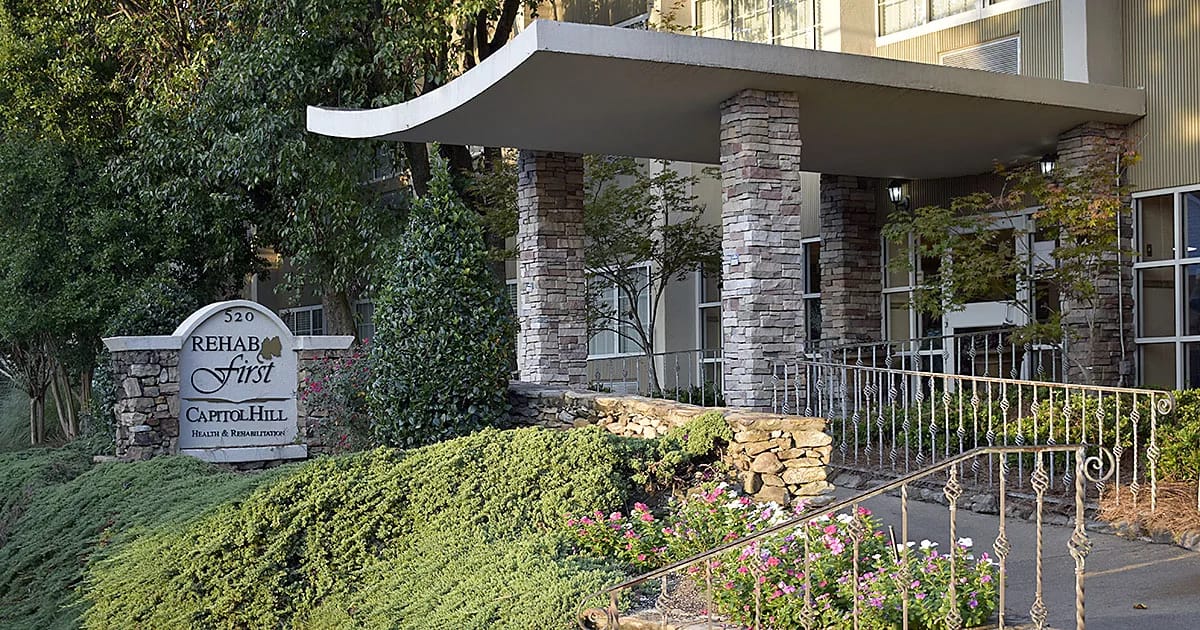
Capitol Hill Healthcare in Montgomery’s unwavering commitment is evident in the round-the-clock care they provide to individuals requiring rehabilitation or nursing support. In addition to their comprehensive long-term and skilled nursing care, they specialize in transitional services, providing short-term solutions that accelerate patients’ recovery through focused treatment and specialized care. Their expertise covers a broad spectrum, including stroke care, diabetes management, wound care, and more. Physical, occupational, and speech therapies are tailored to each resident’s specific needs, fostering independence and well-being.
Their 284-bed skilled facility boasts state-of-the-art equipment, ensuring residents have access to cutting-edge resources. Recognizing the importance of personal care, they go the extra mile by offering on-site beautician services and a salon, allowing residents to pamper themselves without leaving the comfort of their home. Mealtimes are a treat, with a registered dietitian and dietary manager meticulously crafting menus to suit individual preferences and dietary requirements. Their diligent housekeeping staff and dedicated maintenance team also work tirelessly to maintain an orderly and secure environment, ensuring residents feel at ease.

(334) 834-2920

Quality ratings

Measured by Centers for Medicare & Medicaid Services (CMS)

Overall rating Info The Overall CMS Rating combines results from health inspections, staffing levels and quality measures. Health inspections carry the most weight. Staffing and quality scores can increase or decrease the final rating based on performance compared to state and national standards.
▲ 36.0% Above AL avg. ▲ 36.0% Above AL avg.AL average: 2.9Click the badge to see the full State ranking.Click here to see the full State ranking.
Health Inspection Info Based on the results of the facility's three most recent standard inspections and any complaint investigations. CMS reviews the number, scope, and severity of deficiencies, with more recent findings weighted more heavily.
▲ 41.1% Above AL avg. ▲ 41.1% Above AL avg.AL average: 2.8Click the badge to see the full State ranking.Click here to see the full State ranking.
Staffing Info Measures average nursing staff hours per resident per day, including Registered Nurses (RNs) and total nursing staff. Ratings are adjusted based on the level of care residents require and are compared to state and national benchmarks.
▼ 15.3% Below AL avg. ▼ 15.3% Below AL avg.AL average: 3.5Click the badge to see the full State ranking.Click here to see the full State ranking.
Quality Measures Info Based on clinical and physical health indicators reported to CMS, such as hospital readmissions, falls, pressure ulcers, and improvements in mobility. These measures reflect how well residents' health needs are being managed.
At AL avg. At AL avg.AL average: 3.0Click the badge to see the full State ranking.Click here to see the full State ranking.

Staffing hours breakdown

Info Daily nursing hours per resident by staff type, reported to CMS. Higher is generally better — compare this facility to state and national averages to see where staffing stands.

Hours per resident per day — compared to Alabama state averages

Total nursing care / resident Info This home is ranked 52nd out of 136 homes in Alabama for nurse hours. Total adjusted nursing hours per resident per day, combining RN, LPN, and aide time. CMS adjusts this for case-mix so facilities can be fairly compared.
4h 36m per day
Rank #52 / 136Nurse hours — State benchmarkedThis home is ranked 52nd out of 136 homes in Alabama. Shows adjusted nurse hours per resident per day benchmarked to the Alabama average, with a ranking across 136 Alabama facilities. More hours mean more direct care. The national average is about 3.5 hrs; below 3.0 is a red flag.Ranking totals vary by category as each rank only includes facilities that report data for that metric. Homes missing that data point aren't included in the ranking.Click the rank badge to see the full State ranking.Click here to see the full State ranking.
This facility Alabama avg (4h 22m per day)
vs Alabama avg
+5%

3 of 6 metrics below state avg

Standout metric LPN / LVN is +61% above state avg
Staff type Hours / Day / Resident vs state avg
Registered Nurse (RN) Info RNs hold the highest nursing license and can assess residents, interpret test results, and direct care plans. More RN hours per day often signals stronger clinical oversight and faster response to health changes. 24m per day ▼ 37% State avg: 38m per day · National avg: 41m per day
LPN / LVN Info Licensed Practical Nurses (LPNs) or Licensed Vocational Nurses (LVNs) deliver routine hands-on care — medication administration, wound dressing, and monitoring vital signs. They work under RN supervision and make up a large share of daily bedside care. 1h 16m per day ▲ 61% State avg: 47m per day · National avg: 52m per day
Nurse Aide Info Certified Nurse Aides (CNAs) provide the most direct day-to-day assistance: bathing, dressing, feeding, and mobility. Nurse aide hours are typically the largest staffing category and directly affect residents' quality of life. 2h 34m per day ■ Avg State avg: 2h 30m per day · National avg: 2h 21m per day
Weekend Total Nursing Info Combined nursing hours (RN + LPN + Nurse Aide) per resident per day on weekends. Staffing often drops on weekends — this figure reveals whether the facility maintains adequate coverage outside of weekday hours. 3h 36m per day ▲ 10% State avg: 3h 17m per day · National avg: 3h 26m per day
Physical Therapist Info Hours per resident per day provided by licensed Physical Therapists (PTs) or PT Assistants. PT services help residents recover mobility after injury or illness and are especially important for post-acute (short-stay) rehabilitation. 1m per day ▼ 49% State avg: 2m per day · National avg: 4m per day
Weekend RN Info Registered nurse hours specifically on weekends. Facilities sometimes reduce RN presence on Saturdays and Sundays — a low weekend RN figure compared to weekday hours can indicate reduced clinical oversight when most administrative staff are absent. 9m per day ▼ 59% State avg: 22m per day · National avg: 29m per day

Capacity and availability

This home usually has availability

Lower occupancy than the Alabama average: 80.8%
Occupancy rate
68% Rank #104 / 138Occupancy rate — State benchmarkedThis home is ranked 104th out of 138 homes in Alabama. Shows this facility's occupancy rate versus the Alabama average, with its Statewide rank out of 138. Higher occupancy signals strong local demand and financial stability.Ranking totals vary by category as each rank only includes facilities that report data for that metric. Homes missing that data point aren't included in the ranking.Click the rank badge to see the full State ranking.Click here to see the full State ranking.
Avg. Length of Stay
92 days
Bed community size
284-bed community Rank #1 / 245Bed count — State benchmarkedThis home is ranked 1st out of 245 homes in Alabama. Shows this facility's certified or reported bed count compared to other Alabama facilities. Larger communities may offer more amenities, programs, and on-site services for residents and families.Ranking totals vary by category as each rank only includes facilities that report data for that metric. Homes missing that data point aren't included in the ranking.Click the rank badge to see the full State ranking.Click here to see the full State ranking.
A large-scale community that may provide a wide range of amenities, services, and structured programs.
Years in operation
40 years in operation
A longer operating history, which may indicate experience navigating regulations and delivering ongoing care.
Walk Score
Walk Score: 60 / 100 Rank #63 / 418Walk Score — State benchmarkedThis home is ranked 63rd out of 418 homes in Alabama. Shows how walkable this facility's neighborhood is compared to the average Walk Score across Alabama facilities. Higher scores benefit residents, families, and staff.Ranking totals vary by category as each rank only includes facilities that report data for that metric. Homes missing that data point aren't included in the ranking.Click the rank badge to see the full State ranking.Click here to see the full State ranking.
Moderately walkable. Some errands can be accomplished on foot, with a mix of nearby amenities.

About this community

License Details

CMS Certification Number15390

Staffing

Key information about the people who lead and staff this community.

Leadership

ContactMr. Charles London, CEO

Contact Capitol Hill Healthcare in Montgomery

Inspection History

In Alabama, the Department of Public Health, Bureau of Health Provider Standards conducts unannounced surveys to ensure facilities meet state licensing and federal certification safety standards.

Since 2018 · 8 years of data 8 deficiencies

Inspection Scorecard Info This scorecard compares key inspection, citation, and complaint metrics at this facility against the Alabama state average. Metrics rated ≥15% worse than average are highlighted in red; those ≥15% better are highlighted in green.

Since 2018 vs. Alabama state average
Overall vs. AL average 0 Worse No metrics in this bucket. 2 Better Metrics better than Alabama average:
• Total deficiencies (53% below)
• Deficiencies per year (52% below)
Latest Inspection April 1, 2021 Annual Inspection

Deficiencies Info Deficiencies are formal regulatory issues recorded during state inspections.

This Facility AL Average vs. AL Avg
Total deficiencies Info Formal regulatory issues recorded by inspectors across all inspection types. 8 17 This facility has 53% fewer total deficiencies than a typical Alabama nursing home (8 vs. AL avg 17).↓ 53% better
Deficiencies per year Info Average deficiencies per year since 2018. 1 2.1 This facility has 52% fewer deficiencies per year than a typical Alabama nursing home (1 vs. AL avg 2.1).↓ 52% better

Inspection Reports Summary Info An editor-reviewed summary of the themes and findings across this facility's recent inspection reports.

  • April 1, 2021 inspection found the facility failed to maintain clean and sanitary conditions for residents receiving enteral tube feeding, with heavy dried splatters on multiple surfaces and equipment.
  • March 29, 2018 complaint investigation substantiated infection control failures, including not disinfecting glucometers between residents, improper glove use, and inadequate hand hygiene during blood glucose testing and insulin injections.
  • February 21, 2019 inspection identified coding errors on Quarterly MDS assessments for pressure ulcers and anticoagulant medication, indicating documentation inaccuracies without immediate harm.

Health Inspection History

Inspections since 2018
Total health inspections 3

Alabama average 2.9


Last Health inspection on Apr 2021

Total health citations
3 Rank #5 / 136Health citations — State benchmarkedThis home is ranked 5th out of 136 homes in Alabama. Shows this facility's total health deficiency citations benchmarked to the Alabama State average, with a ranking across all 136 AL facilities. Lower citation counts earn a better rank.Ranking totals vary by category as each rank only includes facilities that report data for that metric. Homes missing that data point aren't included in the ranking.Click the rank badge to see the full State ranking.Click here to see the full State ranking.

Alabama average 10.4

Citations per inspection
1 Rank #1 / 136Citations per inspection — State benchmarkedThis home is ranked 1st out of 136 homes in Alabama. Shows average deficiency citations per CMS inspection for this facility versus the Alabama mean across 136 facilities with citation data. Lower is better.Ranking totals vary by category as each rank only includes facilities that report data for that metric. Homes missing that data point aren't included in the ranking.Click the rank badge to see the full State ranking.Click here to see the full State ranking.

Alabama average 3.46


Health citations are formal notices following inspections when they fail to comply with safety and care standards.

All 3 citations resulted from standard inspections.

Breakdown of citation severity (last 8 years)
Critical health citations
0
100% better than Alabama average

Alabama average: 0.7


Serious health citations
0
100% better than Alabama average

Alabama average: 0.2

0 critical citations Alabama average: 0.7

0 serious citations Alabama average: 0.2

3 moderate citations Alabama average: 9.1

0 minor citations Alabama average: 0.4
Citations history (last 8 years)
Resident Rights moderate citation Apr 01, 2021
Corrected

Care Planning moderate citation Feb 21, 2019
Corrected

Infection Control moderate citation Mar 29, 2018
Corrected

Staffing Data

Reporting period: October 1 – December 31, 2025 (Q4 2025). Source: CMS Payroll-Based Journal report.

Total staff 250
Employees 229
Contractors 21
Staff to resident ratio 1.28 : 1
18% fewer staff per resident than Alabama average
Alabama average ratio: 1.56 : 1 Alabama average ratio: 1.56 : 1See full Alabama ranking
Avg staff/day 125
Average shift 8 hours
0% compared with Alabama average
Alabama average: 7.9 hours Alabama average shift: 7.9 hoursSee full Alabama ranking
Total staff hours (quarter) 92,064

Nursing staff breakdown

Q4 2025 · Oct 1 – Dec 31 More info This data comes from the CMS Payroll-Based Journal report covering October 1 – December 31, 2025.
Registered Nurse

Manages medical care and health needs.

RN Staff Info All 20 RN Staff are full-time employees. No contractors work on this role. 20
Average shift length Info Average shift length. Calculated as total hours divided by days worked and average staff per day. 8.1 hours
Licensed Practical Nurse

Assists with medical care and medications.

LPN Staff Info All 56 LPN Staff are full-time employees. No contractors work on this role. 56
Average shift length Info Average shift length. Calculated as total hours divided by days worked and average staff per day. 9.3 hours
Certified Nursing Assistant

Helps with daily care and mobility.

CNA Staff Info All 127 CNA Staff are full-time employees. No contractors work on this role. 127
Average shift length Info Average shift length. Calculated as total hours divided by days worked and average staff per day. 7.7 hours

Contractor staffing

Q4 2025 · Oct 1 – Dec 31 More info This data comes from the CMS Payroll-Based Journal report covering October 1 – December 31, 2025.

Total hours from contractors

4.4%

4,093 contractor hours this quarter

Speech Language Pathologist: 5 Respiratory Therapy Technician: 4 Physical Therapy Assistant: 4 Physical Therapy Aide: 3 Qualified Social Worker: 2 Therapeutic Recreation Specialist: 1 Medical Director: 1 Occupational Therapy Assistant: 1

Staff by category

Q4 2025 · Oct 1 – Dec 31 More info This data comes from the CMS Payroll-Based Journal report covering October 1 – December 31, 2025.
Certified Nursing Assistant 127 0 127 49,798 92 100% 7.7
Licensed Practical Nurse 56 0 56 22,049 92 100% 9.3
Registered Nurse 20 0 20 5,638 92 100% 8.1
RN Director of Nursing 7 0 7 3,243 72 78% 7.8
Clinical Nurse Specialist 6 0 6 2,021 75 82% 7.6
Medication Aide/Technician 4 0 4 1,639 89 97% 9.3
Speech Language Pathologist 0 5 5 1,334 71 77% 7
Physical Therapy Assistant 0 4 4 947 70 76% 7.5
Mental Health Service Worker 2 0 2 886 69 75% 7.5
Administrator 2 0 2 788 64 70% 7.4
Other Dietary Services Staff 1 0 1 519 66 72% 7.9
Occupational Therapy Aide 2 0 2 516 65 71% 5.4
Dietitian 1 0 1 498 64 70% 7.8
Physical Therapy Aide 0 3 3 497 62 67% 7.8
Therapeutic Recreation Specialist 0 1 1 453 61 66% 7.4
Qualified Social Worker 0 2 2 448 65 71% 6.9
Nurse Practitioner 1 0 1 377 52 57% 7.2
Respiratory Therapy Technician 0 4 4 341 65 71% 5.1
Occupational Therapy Assistant 0 1 1 59 12 13% 4.9
Medical Director 0 1 1 13 13 14% 1
127 Certified Nursing Assistant
% of Days 100%
56 Licensed Practical Nurse
% of Days 100%
20 Registered Nurse
% of Days 100%
7 RN Director of Nursing
% of Days 78%
6 Clinical Nurse Specialist
% of Days 82%
4 Medication Aide/Technician
% of Days 97%
5 Speech Language Pathologist
% of Days 77%
4 Physical Therapy Assistant
% of Days 76%
2 Mental Health Service Worker
% of Days 75%
2 Administrator
% of Days 70%
1 Other Dietary Services Staff
% of Days 72%
2 Occupational Therapy Aide
% of Days 71%
1 Dietitian
% of Days 70%
3 Physical Therapy Aide
% of Days 67%
1 Therapeutic Recreation Specialist
% of Days 66%
2 Qualified Social Worker
% of Days 71%
1 Nurse Practitioner
% of Days 57%
4 Respiratory Therapy Technician
% of Days 71%
1 Occupational Therapy Assistant
% of Days 13%
1 Medical Director
% of Days 14%

Penalties and fines

Federal penalties imposed by CMS for regulatory violations, including civil money penalties (fines) and denials of payment for new Medicare/Medicaid admissions.

Source: CMS Penalties Database

No penalties in the past 3 years

No civil money penalties or payment denials were reported in the last 3 years.

Quality of care over time

These measures show how residents usually do over time at this home, based on health outcomes and preventive care.

High-risk clinical events score Info A composite score based on pressure ulcers, falls with injury, weight loss, walking ability decline, and activities of daily living decline. 7.4
17% better than Alabama average

Alabama average: 8.9

Functional decline score Info A composite score based on activities of daily living decline, walking ability decline, and incontinence. 11.3
22% better than Alabama average

Alabama average: 14.5

Long-stay resident measures
Average Alabama avg: 3.3 Info CMS star rating based on long-stay quality measure performance. 5 stars = significantly above average, 1 star = significantly below average.
Need for Help with Daily Activities Increased Info Percent of long-stay residents whose need for help with daily activities has increased 10.5%
24% better than Alabama average

Alabama average: 13.9%

Walking Ability Worsened Info Percent of long-stay residents whose ability to move independently worsened 9.9%
38% better than Alabama average

Alabama average: 16.1%

Low Risk Residents with Bowel/Bladder Incontinence Info Percent of low risk long-stay residents who lose control of their bowels or bladder 13.4%
In line with Alabama average

Alabama average: 13.6%

Falls with Major Injury Info Percent of long-stay residents experiencing one or more falls with major injury 2.1%
39% better than Alabama average

Alabama average: 3.4%

High Risk Residents with Pressure Ulcers Info Percent of long-stay high risk residents with pressure ulcers 7.1%
19% worse than Alabama average

Alabama average: 5.9%

Urinary Tract Infection Info Percent of long-stay residents with a urinary tract infection 2.5%
9% better than Alabama average

Alabama average: 2.7%

Lost Too Much Weight Info Percent of long-stay residents who lose too much weight 7.5%
38% worse than Alabama average

Alabama average: 5.4%

Depressive Symptoms Info Percent of long-stay residents who have depressive symptoms 0.3%
77% better than Alabama average

Alabama average: 1.2%

Antipsychotic Use Info Percent of long-stay residents who received an antipsychotic medication 18.6%
10% better than Alabama average

Alabama average: 20.7%

Pneumococcal Vaccine Info Percent of long-stay residents assessed and appropriately given the pneumococcal vaccine 96.0%
5% better than Alabama average

Alabama average: 91.5%

Influenza Vaccine Info Percent of long-stay residents assessed and appropriately given the seasonal influenza vaccine 98.6%
In line with Alabama average

Alabama average: 94.8%

Hospitalizations per 1,000 days Info Number of hospitalizations per 1,000 long-stay resident days. 1.60
20% better than Alabama average

Alabama average: 2.00

ED visits per 1,000 days Info Number of outpatient emergency department visits per 1,000 long-stay resident days. 1.46
18% better than Alabama average

Alabama average: 1.79

Short-stay resident measures
Average Alabama avg: 2.1 Info CMS star rating based on short-stay quality measure performance. 5 stars = much above average, 1 star = much below average.
Pneumococcal Vaccine Info Percent of short-stay residents assessed and appropriately given the pneumococcal vaccine 99.2%
19% better than Alabama average

Alabama average: 83.7%

Antipsychotic medication increase Info Percent of short-stay residents who newly received an antipsychotic medication 2.4%
12% worse than Alabama average

Alabama average: 2.1%

Influenza Vaccine Info Percent of short-stay residents assessed and appropriately given the seasonal influenza vaccine 96.9%
21% better than Alabama average

Alabama average: 80.3%

Re-hospitalized after SNF stay Info Percentage of short-stay residents who were re-hospitalized after their nursing home admission. 34.0%
39% worse than Alabama average

Alabama average: 24.5%

Emergency department visits Info Percentage of short-stay residents who had an outpatient emergency department visit. 6.3%
45% better than Alabama average

Alabama average: 11.5%

Falls with major injury Info Percentage of SNF residents who experience falls with major injury during their stay. 1.2%
58% worse than Alabama average

Alabama average: 0.8%

Ability to care for self at discharge Info Percentage of residents at or above expected ability to care for themselves at discharge. 60.4%
13% better than Alabama average

Alabama average: 53.7%

Successful return to home or community Info Rate of successful return to home or community from a skilled nursing facility. 46.5%
8% worse than Alabama average

Alabama average: 50.6%

Breakdown by payment type

Medicare

12% of new residents, usually for short-term rehab.

Typical stay 1 months

Private pay

59% of new residents, often for short stays.

Typical stay 29 days

Medicaid

29% of new residents, often for long-term daily care.

Typical stay 8 - 9 months

Facility Characteristics

Source: CMS Long-Term Care Facility Characteristics (Data as of Jan 2026)

Total residents 196
Medicare
9
4.6% of residents
Medicaid
155
79.1% of residents
Private pay or other
32
16.3% of residents
Programs & Services
Residents Group

Residents meet regularly to discuss policies, care quality, and activities

Active Resident Council

Organized group of residents that meets regularly to discuss facility policies, quality of life, and activities.

Finances and operations

Based on CMS SNF Cost Report for fiscal year ending in 06/2024.

Voluntary non-profit community
Operated by a church.
Net patient revenue Info Net patient revenue — what the home actually collects for resident care, after contractual allowances, bad debt and discounts are subtracted from its gross charges (CMS cost report, Worksheet G-3). It covers resident care only; money the home earns from other sources is shown separately as "Other income."
$24.1M
Net patient income Info Net patient income: net patient revenue minus the home's total operating expenses. A positive figure means it earns more from resident care than it spends to deliver it; a negative figure means the opposite. It excludes non-operating "other income."
$1.8M
Voluntary non-profit community Operated by a church.
Net patient revenue Info Net patient revenue — what the home actually collects for resident care, after contractual allowances, bad debt and discounts are subtracted from its gross charges (CMS cost report, Worksheet G-3). It covers resident care only; money the home earns from other sources is shown separately as "Other income."
$24.1M Rank #1 / 135Revenue — State benchmarkedThis home is ranked 1st out of 135 homes in Alabama. Shows this facility's annual revenue compared to the Alabama average. Higher revenue generally means more resources for staffing and capital — read alongside Payroll %.Ranking totals vary by category as each rank only includes facilities that report data for that metric. Homes missing that data point aren't included in the ranking.Click the rank badge to see the full State ranking.Click here to see the full State ranking.
Net patient income Info Net patient income: net patient revenue minus the home's total operating expenses. A positive figure means it earns more from resident care than it spends to deliver it; a negative figure means the opposite. It excludes non-operating "other income."
$1.8M
Other income Info Money the home earns outside of resident care — such as investments, grants, rentals and other non-operating sources (CMS cost report, Worksheet G-3). It is tracked separately from net patient revenue: it is not part of that figure, and it is not included in net patient income.
$104.5K
Payroll costs Info Staff salaries plus wage-related costs — benefits such as payroll taxes, health insurance and retirement — from the home's own accounting records (CMS cost report, Worksheet A). Contract or agency labor is counted separately, under other operating costs. Rank #2 / 135Payroll — State benchmarkedThis home is ranked 2nd out of 135 homes in Alabama. Shows total annual staff payroll benchmarked to the Alabama average. Higher payroll investment relative to peers often signals better staffing and less reliance on cheaper contract labor.Ranking totals vary by category as each rank only includes facilities that report data for that metric. Homes missing that data point aren't included in the ranking.Click the rank badge to see the full State ranking.Click here to see the full State ranking.
$11.4M 47.3% of net patient revenue Info Payroll as a share of revenue: staff salaries and wage-related benefits divided by net patient revenue. A higher figure means more of each revenue dollar goes to staff pay. Rank #132 / 133Payroll % — State benchmarkedThis home is ranked 132nd out of 133 homes in Alabama. Shows payroll as a percentage of revenue versus the Alabama average. Well-run Alabama facilities typically land around 54–69% — the top third Statewide. Below 25% may signal understaffing or heavy agency use — read with Staffing ratings.Ranking totals vary by category as each rank only includes facilities that report data for that metric. Homes missing that data point aren't included in the ranking.Click the rank badge to see the full State ranking.Click here to see the full State ranking.
Other operating costs Info Everything it costs to run the home apart from payroll — food, utilities, supplies, maintenance, contract labor and administration. Calculated as total operating expense minus payroll (staff salaries and wage-related benefits).
$10.9M
Total costs Info The home's total operating expense for the year — all the costs of running it, salaries included (CMS cost report, Worksheet G-3).
$22.2M

Who this home usually serves

TYPE OF STAY

Mix of rehab and long-term care

This home supports both short-term rehab and long-term care, with residents staying for a wide range of durations.

Most new residents arrive under private pay (59% of admissions), and a typical private pay stay runs around 29 days.

Admissions
826 total

Coverage residents most often arrive under.

Medicare 12%
Private pay 59%
Medicaid 29%
Discharges
827 total

Coverage residents most often leave under.

Medicare 12%
Private pay 58%
Medicaid 30%

Places of interest near Capitol Hill Healthcare in Montgomery

Address 1 mile from city center — 1.14 miles to nearest hospital (Jackson Hospital)

Calculate Travel Distance to Capitol Hill Healthcare in Montgomery

Add your location

Address

Compare Nursing Home around Montgomery

The information below is reported by the Alabama Department of Public Health, Bureau of Health Provider Standards.

5 facilities compared · CMS & AL Dept. of Health data

Crowne Health Care of Montgomery
NH
MC
RC
Montgomery (Hillcrest)
185
Facility 185
AL AVG 90
Rank #12 / 245
78.9%
Facility 78.9%
AL AVG 80.8%
Rank #86 / 138
-2%
4.56
Facility 4.56
AL AVG 4.37
Rank #52 / 136
-22% +4%
$0
Facility $0
AL AVG $59.8k
Rank #1 / 137
5
Facility 5
AL AVG 10.4
Rank #22 / 136
2.5
Facility 2.5
AL AVG 3.5
Rank #33 / 136
1 156 A+
40
Facility 40
AL AVG 36
Rank #186 / 418
Leslie Smith
$16.3M
Facility $16.3M
AL AVG $11.1M
Rank #11 / 135
$8.1M
Facility $8.1M
AL AVG $4.7M
Rank #25 / 135
50%
Facility 50%
AL AVG 45%
Rank #109 / 133
15393
Capitol Hill Healthcare in Montgomery
NH
MC
Montgomery
284
Facility 284
AL AVG 90
Rank #1 / 245
68.0%
Facility 68.0%
AL AVG 80.8%
Rank #104 / 138
-16%
4.60
Facility 4.60
AL AVG 4.37
Rank #52 / 136
-22% +5%
$0
Facility $0
AL AVG $59.8k
Rank #1 / 137
3
Facility 3
AL AVG 10.4
Rank #5 / 136
1.0
Facility 1.0
AL AVG 3.5
Rank #1 / 136
- 218 -
60
Facility 60
AL AVG 36
Rank #63 / 418
Turenne & Associates, LLC
$24.1M
Facility $24.1M
AL AVG $11.1M
Rank #1 / 135
$11.4M
Facility $11.4M
AL AVG $4.7M
Rank #2 / 135
47.3%
Facility 47.3%
AL AVG 45%
Rank #132 / 133
15390
Rehab Select at Hillview Terrace
NH
RC
Montgomery (Sherwood)
143
Facility 143
AL AVG 90
Rank #38 / 245
94.5%
Facility 94.5%
AL AVG 80.8%
Rank #14 / 138
+17%
5.01
Facility 5.01
AL AVG 4.37
Rank #22 / 136
-20% +15%
$0
Facility $0
AL AVG $59.8k
Rank #1 / 137
16
Facility 16
AL AVG 10.4
Rank #114 / 136
5.3
Facility 5.3
AL AVG 3.5
Rank #116 / 136
- 139 -
62
Facility 62
AL AVG 36
Rank #54 / 418
Libby Alford
$14.6M
Facility $14.6M
AL AVG $11.1M
Rank #39 / 135
$8.6M
Facility $8.6M
AL AVG $4.7M
Rank #20 / 135
58.7%
Facility 58.7%
AL AVG 45%
Rank #27 / 133
15436
Diversicare of Montgomery
NH
AL
HC
MC
Montgomery (Forest Park)
138
Facility 138
AL AVG 90
Rank #43 / 245
78.3%
Facility 78.3%
AL AVG 80.8%
Rank #88 / 138
-3%
3.46
Facility 3.46
AL AVG 4.37
Rank #123 / 136
+22% -21%
$0
Facility $0
AL AVG $59.8k
Rank #1 / 137
14
Facility 14
AL AVG 10.4
Rank #106 / 136
4.7
Facility 4.7
AL AVG 3.5
Rank #105 / 136
- 108 A+
52
Facility 52
AL AVG 36
Rank #101 / 418
Quintella Crawford
$12.4M
Facility $12.4M
AL AVG $11.1M
Rank #46 / 135
$4.3M
Facility $4.3M
AL AVG $4.7M
Rank #91 / 135
34.9%
Facility 34.9%
AL AVG 45%
Rank #131 / 133
15040
Montgomery Health and Rehab
NH
Montgomery (Monterey Park)
121
Facility 121
AL AVG 90
Rank #62 / 245
81.0%
Facility 81.0%
AL AVG 80.8%
Rank #81 / 138
0%
3.79
Facility 3.79
AL AVG 4.37
Rank #111 / 136
+65% -13%
$0
Facility $0
AL AVG $59.8k
Rank #1 / 137
35
Facility 35
AL AVG 10.4
Rank #132 / 136
8.8
Facility 8.8
AL AVG 3.5
Rank #135 / 136
- 107 A+
24
Facility 24
AL AVG 36
Rank #283 / 418
Des Johnson
$3.1M
Facility $3.1M
AL AVG $11.1M
Rank #132 / 135
$2.0M
Facility $2.0M
AL AVG $4.7M
Rank #97 / 135
62.6%
Facility 62.6%
AL AVG 45%
Rank #1 / 133
15228

Financial Assistance for
Nursing Home in Alabama

Capitol Hill Healthcare in Montgomery is located in Montgomery, Alabama.
Here are the financial assistance programs available to residents in Alabama.

Get Financial aid guidance

Elderly and Disabled Waiver

Alabama Medicaid E&D Waiver

Age 65+ or disabled
General Alabama resident, Medicaid-eligible, requires nursing home-level care but can live in community with support.
Income Limits (2025) ~$2,829/month 300% FBR, individual
Asset Limits $2,000 (individual), $3,000 (couple) (excludes home, car).
AL

Must be assessed by a nurse for nursing home-level care need.

Benefits
In-home personal care (4-6 hours/day, e.g., bathing, dressing) Respite care (up to 240 hours/year) Adult day care (~$50/day avg.) Home-delivered meals Case management

Alabama Respite for Caregivers Program

Alabama Respite (via NFCSP)

Age Caregiver of someone 60+ (or with dementia)
General Alabama resident.
Income Limits No strict limit; prioritizes low-income.
Asset Limits Not applicable.
AL

Focus on rural caregivers; limited funding.

Benefits
In-home respite (4-6 hours/day) Adult day care (~$50/day) Short-term facility care (up to 5 days)

SenioRx Prescription Assistance Program

AL SenioRx

Age 55+
General Alabama resident, chronic illness requiring daily medication, not fully covered by other drug plans.
Income Limits ~$3,000/month individual, varies by AAA
Asset Limits Not strictly enforced; income-focused.
AL

High ROI; saved $43.5M for 6,825 participants in FY 2022.

Benefits
Prescription cost reduction (avg. $6,300/year savings per participant) Medication management support

Weatherization Assistance Program (WAP)

AL WAP

Age 60+ priority
General Alabama resident, own or rent home, low-income status.
Income Limits (2025) ~$2,510/month 200% of poverty level, individual
Asset Limits Not applicable; income-driven.
AL

Prioritizes seniors and disabled; limited annual funding.

Benefits
Insulation Weather stripping HVAC repairs (avg. $500-$1,000 in annual energy savings)

Section 202 Supportive Housing for the Elderly

AL Section 202

Age 62+
General Alabama resident, very low income, able to live independently with support.
Income Limits (2025) ~$1,500/month 50% of area median income, individual, varies by county
Asset Limits $10,000 individual, excludes home if owned
AL

High demand in urban areas like Birmingham; limited units statewide.

Benefits
Subsidized rent (30% of income, e.g., $300-$500/month) On-site services (housekeeping, transportation, ~$200/month value)

Alabama CARES Program

AL CARES

Age
General Caregivers of Alabama residents aged 60+ needing assistance with 3+ daily activities; no age limit for caregivers.
Income Limits No strict limit; cost-sharing based on recipient’s income e.g., ~$2,500/month threshold
Asset Limits Not applicable; focus on need.
AL

Prioritizes caregivers with greatest economic/social need; complements respite programs like AL Lifespan Respite.

Benefits
Respite care (up to 10 days/year) Counseling (4-6 sessions/year) Training (2-3 workshops/year) Supplemental supplies (e.g., $200/year avg.)

Frequently Asked Questions about Capitol Hill Healthcare in Montgomery

Is Capitol Hill Healthcare in Montgomery in a walkable area?

Capitol Hill Healthcare in Montgomery has a walk score of 60. Moderately walkable. Some errands can be accomplished on foot, with a mix of nearby amenities.

What is the occupancy rate at Capitol Hill Healthcare in Montgomery?

Capitol Hill Healthcare in Montgomery's occupancy is 73.4%.

Are there photos of Capitol Hill Healthcare in Montgomery?

Yes — there are 5 photos of Capitol Hill Healthcare in Montgomery in the photo gallery on this page.

What is the phone number of Capitol Hill Healthcare in Montgomery?

(334) 834-2920 will put you in contact with the team at Capitol Hill Healthcare in Montgomery.

Is Capitol Hill Healthcare in Montgomery Medicare or Medicaid certified?

Yes — Capitol Hill Healthcare in Montgomery is a CMS-certified provider of Medicare and Medicaid.

Guides for Better Senior Living

Care Cost Calculator: See Prices in Your Area

Nursing Home Data Explorer

Don’t Wait Too Long: 7 Red Flag Signs Your Parent Needs Assisted Living Now

The True Cost of Assisted Living in 2025 – And How Families Are Paying For It

Understanding Senior Living Costs: Pricing Models, Discounts & Financial Assistance