Ginger Cove
Nursing Home, Assisted Living, Home Care, Independent Living & Memory Care · Annapolis, MD
CMS overall rating Info CMS (the Centers for Medicare & Medicaid Services) is the federal agency that rates nursing home quality. Its Overall Rating runs from 1 to 5 stars, combining health inspections, staffing, and quality measures, with inspections weighted most heavily.

Ginger Cove

Nursing Home, Assisted Living, Home Care, Independent Living & Memory Care · Annapolis, MD
CMS overall rating Info CMS (the Centers for Medicare & Medicaid Services) is the federal agency that rates nursing home quality. Its Overall Rating runs from 1 to 5 stars, combining health inspections, staffing, and quality measures, with inspections weighted most heavily.
Calculator: See prices in your area
Ginger Cove accepts Medicare and private pay.

Overview of Ginger Cove

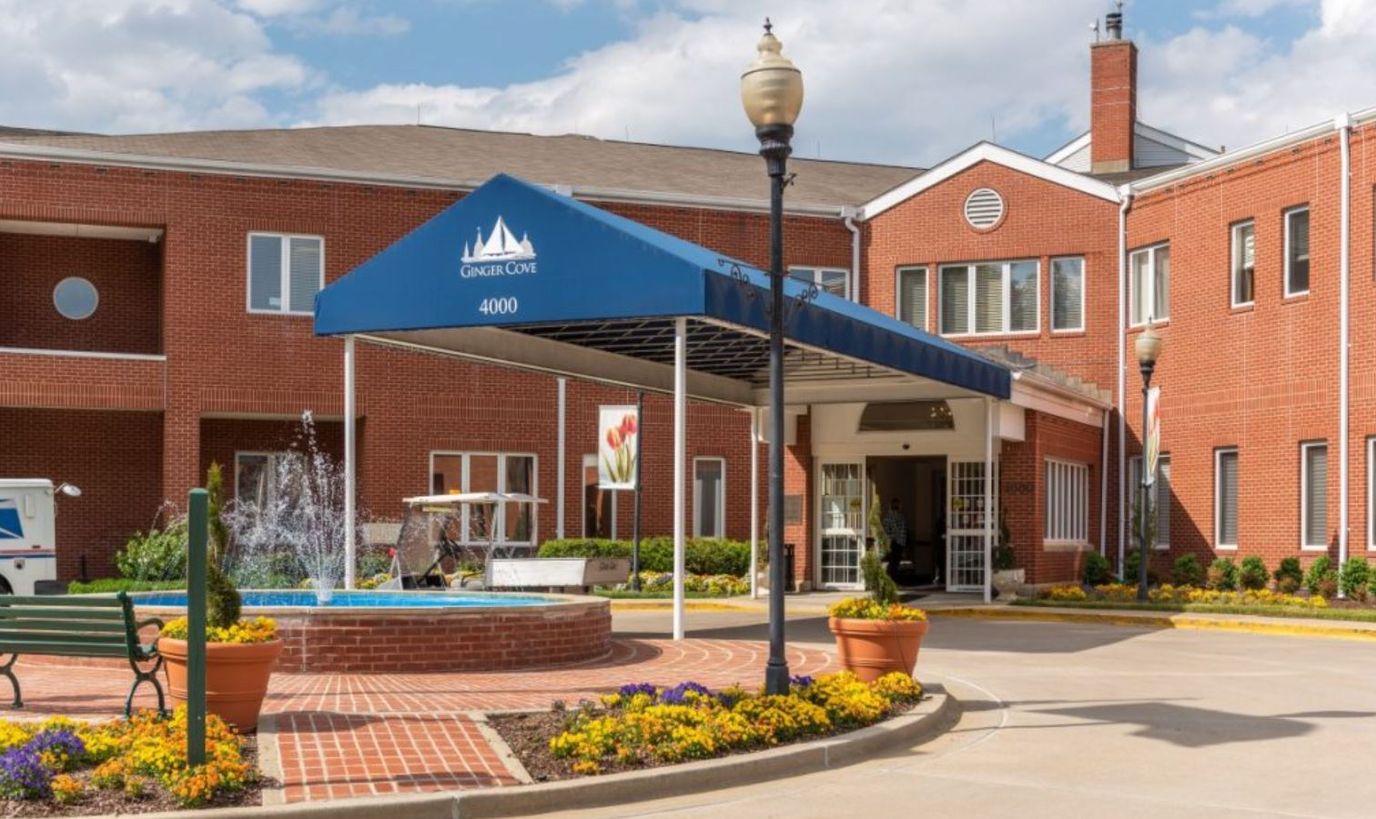
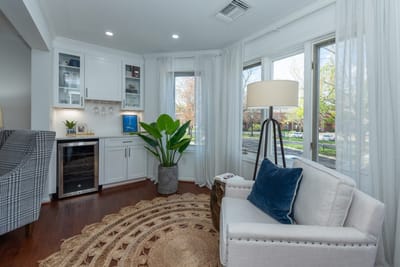
Ginger Cove in Annapolis, Maryland, offers a environment for residents of all needs. This Life-Care community caters to individuals 60 and over, providing independent living, assisted living, memory care, and nursing care options. Ginger Cove prioritizes resident well-being with a heartfelt, resident-centered approach. Their dedicated staff crafts personalized care plans to ensure your loved one receives the exact level of support needed. Residents thrive in a cozy, relaxing, and fun-filled atmosphere, enjoying delicious and nutritious meals served daily, along with a vibrant calendar of social gatherings, educational activities, and specialized programs.

A life free from everyday chores. Ginger Cove takes care of housekeeping, laundry, and even transportation to appointments. With newfound free time, residents can explore their interests in a variety of ways. Continuing education programs encourage lifelong learning, while an on-site wellness center and resort-inspired amenities like an indoor pool and walking trails promote physical and mental well-being. Prefer for a quiet afternoon in the meditation garden, a friendly game of croquet with neighbors, or a kayaking expedition on Gingerville Creek, there’s something for everyone. For those seeking adventure beyond campus, Ginger Cove provides safe and secure living while you explore historic Annapolis, venture to Washington D.C., or international Travels.

Quality ratings

Measured by Centers for Medicare & Medicaid Services (CMS)

Overall rating Info The Overall CMS Rating combines results from health inspections, staffing levels and quality measures. Health inspections carry the most weight. Staffing and quality scores can increase or decrease the final rating based on performance compared to state and national standards.
▲ 31.5% Above MD avg. ▲ 31.5% Above MD avg.MD average: 3.0Click the badge to see the full State ranking.Click here to see the full State ranking.
Health Inspection Info Based on the results of the facility's three most recent standard inspections and any complaint investigations. CMS reviews the number, scope, and severity of deficiencies, with more recent findings weighted more heavily.
▲ 77.5% Above MD avg. ▲ 77.5% Above MD avg.MD average: 2.8Click the badge to see the full State ranking.Click here to see the full State ranking.
Staffing Info Measures average nursing staff hours per resident per day, including Registered Nurses (RNs) and total nursing staff. Ratings are adjusted based on the level of care residents require and are compared to state and national benchmarks.
▲ 64.2% Above MD avg. ▲ 64.2% Above MD avg.MD average: 3.0Click the badge to see the full State ranking.Click here to see the full State ranking.
Quality Measures Info Based on clinical and physical health indicators reported to CMS, such as hospital readmissions, falls, pressure ulcers, and improvements in mobility. These measures reflect how well residents' health needs are being managed.
▼ 72.9% Below MD avg. ▼ 72.9% Below MD avg.MD average: 3.7Click the badge to see the full State ranking.Click here to see the full State ranking.

Staffing hours breakdown

Info Daily nursing hours per resident by staff type, reported to CMS. Higher is generally better — compare this facility to state and national averages to see where staffing stands.

Hours per resident per day — compared to Maryland state averages

Total nursing care / resident Info Total adjusted nursing hours per resident per day, combining RN, LPN, and aide time. CMS adjusts this for case-mix so facilities can be fairly compared.
5h 34m per day
This facility Maryland avg (3h 46m per day)
vs Maryland avg
+47%

2 of 6 metrics below state avg

Standout metric Registered Nurse (RN) is +107% above state avg
Staff typeHours / Day / Residentvs state avg
Registered Nurse (RN) Info RNs hold the highest nursing license and can assess residents, interpret test results, and direct care plans. More RN hours per day often signals stronger clinical oversight and faster response to health changes. 1h 41m per day ▲ 107% State avg: 49m per day · National avg: 41m per day
LPN / LVN Info Licensed Practical Nurses (LPNs) or Licensed Vocational Nurses (LVNs) deliver routine hands-on care — medication administration, wound dressing, and monitoring vital signs. They work under RN supervision and make up a large share of daily bedside care. 49m per day ▼ 11% State avg: 55m per day · National avg: 52m per day
Nurse Aide Info Certified Nurse Aides (CNAs) provide the most direct day-to-day assistance: bathing, dressing, feeding, and mobility. Nurse aide hours are typically the largest staffing category and directly affect residents' quality of life. 2h 25m per day ▲ 13% State avg: 2h 9m per day · National avg: 2h 20m per day
Weekend Total Nursing Info Combined nursing hours (RN + LPN + Nurse Aide) per resident per day on weekends. Staffing often drops on weekends — this figure reveals whether the facility maintains adequate coverage outside of weekday hours. 4h 25m per day ▲ 27% State avg: 3h 28m per day · National avg: 3h 26m per day
Physical Therapist Info Hours per resident per day provided by licensed Physical Therapists (PTs) or PT Assistants. PT services help residents recover mobility after injury or illness and are especially important for post-acute (short-stay) rehabilitation. 4m per day ▼ 13% State avg: 5m per day · National avg: 4m per day
Weekend RN Info Registered nurse hours specifically on weekends. Facilities sometimes reduce RN presence on Saturdays and Sundays — a low weekend RN figure compared to weekday hours can indicate reduced clinical oversight when most administrative staff are absent. 1h 13m per day ▲ 97% State avg: 37m per day · National avg: 28m per day

Capacity and availability

Avg. Length of Stay
139 days
Bed community size
96-bed community Rank #140 / 697Bed count — State benchmarkedThis home is ranked 140th out of 697 homes in Maryland. Shows this facility's certified or reported bed count compared to other Maryland facilities. Larger communities may offer more amenities, programs, and on-site services for residents and families.Rankings are based only on facilities in Maryland that report data for that category. Facilities without available data are excluded from the ranking.Click the rank badge to see the full State ranking.Click here to see the full State ranking.
A larger shared setting that may offer more common spaces and organized community services.
Years in operation
42 years in operation Rank #8 / 208Years in operation — State benchmarkedThis home is ranked 8th out of 208 homes in Maryland. Shows how long this facility has been in operation compared to other Maryland facilities. Longer operating histories may benefit residents, families, and staff.Rankings are based only on facilities in Maryland that report data for that category. Facilities without available data are excluded from the ranking.Click the rank badge to see the full State ranking.Click here to see the full State ranking.
A longer operating history, which may indicate experience navigating regulations and delivering ongoing care.
Walk Score
Walk Score: 51 / 100 Rank #413 / 985Walk Score — State benchmarkedThis home is ranked 413th out of 985 homes in Maryland. Shows how walkable this facility's neighborhood is compared to the average Walk Score across Maryland facilities. Higher scores benefit residents, families, and staff.Rankings are based only on facilities in Maryland that report data for that category. Facilities without available data are excluded from the ranking.Click the rank badge to see the full State ranking.Click here to see the full State ranking.
Moderately walkable. Some errands can be accomplished on foot, with a mix of nearby amenities.
BBB Rating
BBB Rating: A+ (Not Accredited)
An independent rating from the Better Business Bureau based on factors such as complaint history, transparency, and business practices.
How BBB ratings work

About this community

Occupancy

Occupancy rate
66%
Higher than the Maryland average: 60%
Occupied beds
63 / 96
Average occupied beds in Maryland homes 104 beds

Awards

Named One of America’s Best Continuing Care Communities.

License Details

Facility TypeAl
CountyAnne Arundel
CMS Certification Number215174
CertificationsCARF accredited
AccreditationsCARF accredited

Ownership & Operating Entity

Profit StatusNonprofit
Nonprofit OwnershipYes

Room costs

Private Room $287 - $299 per day
Apartment $275 - $280 per day

Safety & Compliance

Wheelchair Accessible
Emergency SystemsYes

Hospice Affiliations

AccentCare Hospice and Palliative Care of Maryland
Gilchrist Hospice Care
Hospice of the Chesapeake

Staffing

Key information about the people who lead and staff this community.

Leadership

No CNA training program
ContactDr. Edgar Mallick, Executive Director

Payment & Insurance

1 service
Accept Medicare

Therapy & Rehabilitation

3 services
Rehabilitation Services
Respite Care
Short-Term Rehab

Staffing & Medical

1 service
24-Hour Staffing

Memory & Specialized Care

4 services
Dedicated Alzheimer's Unit
Mild Alzheimer's Level
Moderate Alzheimer's Level
Severe Alzheimer's Level

Additional Policies & Features

Continuing Care Retirement Community (CCRC)
Minimum Age60
HousekeepingYes
Linen ServiceYes
Utilities IncludedYes

Amenities & Lifestyle

Exquisite Dining Venues
World-Class Wellness Center
Indoor Pool
Jacuzzi And Saunas
Fishing Pier
Private Deep-Water Dock
Community Garden Plots
Meditation Garden
Walking Paths
Croquet Court
Business Center
Art Gallery
Spacious Art Studio
On-Campus Atm
Convenience Store
Coffee Bar
Spa And Salon
Woodshop
Valet Service
Scheduled Transportation
Library
Performance Hall
Walk-In Clinic
Physical Therapy Clinic
Activities
Specific ProgramsMoving & Downsizing Assistance
Touring HoursMonday-Sunday: 9:00 AM - 5:00 PM

Dining & Nutrition

Food DescriptionDining venues offer beautiful settings, impeccable service, and fresh flavors inspired by the Chesapeake Bay.

Contact Ginger Cove

Inspection History

In Maryland, the Department of Health, Office of Health Care Quality is the state agency that conducts unannounced inspections and issues reports for all assisted living and nursing facilities.

Since 2018 · 8 years of data 23 citations 4 inspections

Inspection Scorecard Info This scorecard compares key inspection, citation, and complaint metrics at this facility against the Maryland state average. Metrics rated ≥15% worse than average are highlighted in red; those ≥15% better are highlighted in green.

Since 2018 vs. Maryland state average
Overall vs. MD average 3 Worse Metrics worse than Maryland average:
• Total citations (475% above)
• Citations per year (480% above)
• Citations per inspection (625% above)
1 Better Metrics better than Maryland average:
• Total inspections (20% below)
Latest Inspection November 24, 2025 Annual Inspection

Citations Info Citations are formal regulatory issues recorded during state inspections.

This FacilityMD Averagevs. MD Avg
Total citations Info Formal regulatory issues recorded by inspectors across all inspection types. 234 This facility has 475% more total citations than a typical Maryland nursing home (23 vs. MD avg 4).↑ 475% worse
Citations per year Info Average citations per year since 2018. 2.90.5 This facility has 480% more citations per year than a typical Maryland nursing home (2.9 vs. MD avg 0.5).↑ 480% worse
Citations per inspection Info Average citations per inspection. 5.80.8 This facility has 625% more citations per inspection than a typical Maryland nursing home (5.8 vs. MD avg 0.8).↑ 625% worse

Inspections Info State inspections evaluate whether the facility meets health and safety standards.

This FacilityMD Averagevs. MD Avg
Total inspections Info Combined count of all routine and focused inspections. Excludes complaint investigations. 45 This facility has 20% fewer total inspections than a typical Maryland nursing home (4 vs. MD avg 5).↓ 20% better

Health Inspection History

Inspections since 2018
Total health inspections 3

Maryland average 3.9


Last Health inspection on Jun 2024

Total health citations
19

Maryland average 49.9

Citations per inspection
6.33

Maryland average 12.81


Health citations are formal notices following inspections when they fail to comply with safety and care standards.

16 of 19 citations resulted from standard inspections; and 3 of 19 came from combined inspections (standard and complaint).

Breakdown of citation severity (last 8 years)
Critical health citations
0
100% better than Maryland average

Maryland average: 0.5


Serious health citations
0
100% better than Maryland average

Maryland average: 0.6

0 critical citations Maryland average: 0.5

0 serious citations Maryland average: 0.6

18 moderate citations Maryland average: 47.2

1 minor citation Maryland average: 1.7
Citations history (last 8 years)
Infection Control moderate citation Jun 04, 2024
Corrected

Nursing Services minor citation Jun 04, 2024
Corrected

Care Planning moderate citation Jun 04, 2024
Corrected

Care Planning moderate citation Jun 04, 2024
Corrected

Demographics

Resident demographic information for this facility.

Gender

  • Female 60%
  • Male 40%

Age Distribution

  • 85-94 64.4%
  • 95+ 22.2%
  • 75-84 13.3%

Ethnicity

  • White 100%

Staffing Data

Reporting period: October 1 – December 31, 2025 (Q4 2025). Source: CMS Payroll-Based Journal report.

Total staff 93
Employees 74
Contractors 19
Staff to resident ratio 2.38 : 1
31% more staff per resident than Maryland average
Maryland average ratio: 1.81 : 1 Maryland average ratio: 1.81 : 1See full Maryland ranking
Avg staff/day 31
Average shift 7.2 hours
10% worse than Maryland average
Maryland average: 8 hours Maryland average shift: 8 hoursSee full Maryland ranking
Total staff hours (quarter) 20,498

Nursing staff breakdown

Q4 2025 · Oct 1 – Dec 31 More info This data comes from the CMS Payroll-Based Journal report covering October 1 – December 31, 2025.
Registered Nurse

Manages medical care and health needs.

RN Staff Info All 16 RN Staff are full-time employees. No contractors work on this role. 16
Average shift length Info Average shift length. Calculated as total hours divided by days worked and average staff per day. 8.4 hours
Licensed Practical Nurse

Assists with medical care and medications.

LPN Staff Info All 13 LPN Staff are full-time employees. No contractors work on this role. 13
Average shift length Info Average shift length. Calculated as total hours divided by days worked and average staff per day. 9.6 hours
Certified Nursing Assistant

Helps with daily care and mobility.

CNA Staff Info All 36 CNA Staff are full-time employees. No contractors work on this role. 36
Average shift length Info Average shift length. Calculated as total hours divided by days worked and average staff per day. 7.3 hours

Contractor staffing

Q4 2025 · Oct 1 – Dec 31 More info This data comes from the CMS Payroll-Based Journal report covering October 1 – December 31, 2025.

Total hours from contractors

11%

2,259 contractor hours this quarter

Respiratory Therapy Technician: 7 Speech Language Pathologist: 5 Physical Therapy Aide: 2 Qualified Social Worker: 1 Physical Therapy Assistant: 1 Diagnostic X-ray Services Staff: 1 Medical Director: 1 Occupational Therapy Assistant: 1

Staff by category

Q4 2025 · Oct 1 – Dec 31 More info This data comes from the CMS Payroll-Based Journal report covering October 1 – December 31, 2025.
Certified Nursing Assistant360367,82992100%7.3
Registered Nurse160164,09592100%8.4
Licensed Practical Nurse130132,64092100%9.6
Other Dietary Services Staff3039768289%7.2
Clinical Nurse Specialist2029286470%7.7
Speech Language Pathologist0557836470%3.4
Administrator1014606065%7.7
Nurse Practitioner1014455964%7.5
Mental Health Service Worker1014375762%7.7
Occupational Therapy Aide1014305661%7.7
Physical Therapy Aide0224246672%6.2
Qualified Social Worker0112706166%4.4
Physical Therapy Assistant0112456267%3.9
Respiratory Therapy Technician0772356571%2.3
Medical Director0111922527%7.7
Diagnostic X-ray Services Staff011841112%7.7
Occupational Therapy Assistant0112567%4.2
36 Certified Nursing Assistant
% of Days 100%
16 Registered Nurse
% of Days 100%
13 Licensed Practical Nurse
% of Days 100%
3 Other Dietary Services Staff
% of Days 89%
2 Clinical Nurse Specialist
% of Days 70%
5 Speech Language Pathologist
% of Days 70%
1 Administrator
% of Days 65%
1 Nurse Practitioner
% of Days 64%
1 Mental Health Service Worker
% of Days 62%
1 Occupational Therapy Aide
% of Days 61%
2 Physical Therapy Aide
% of Days 72%
1 Qualified Social Worker
% of Days 66%
1 Physical Therapy Assistant
% of Days 67%
7 Respiratory Therapy Technician
% of Days 71%
1 Medical Director
% of Days 27%
1 Diagnostic X-ray Services Staff
% of Days 12%
1 Occupational Therapy Assistant
% of Days 7%

Penalties and fines

Federal penalties imposed by CMS for regulatory violations, including civil money penalties (fines) and denials of payment for new Medicare/Medicaid admissions.

Source: CMS Penalties Database

No penalties in the past 3 years

No civil money penalties or payment denials were reported in the last 3 years.

Quality of care over time

These measures show how residents usually do over time at this home, based on health outcomes and preventive care.

High-risk clinical events score Info A composite score based on pressure ulcers, falls with injury, weight loss, walking ability decline, and activities of daily living decline. 16.8
30% worse than Maryland average

Maryland average: 12.9

Functional decline score Info A composite score based on activities of daily living decline, walking ability decline, and incontinence. 35.5
38% worse than Maryland average

Maryland average: 25.7

Long-stay resident measures
Significantly below average Maryland avg: 3.7 Info CMS star rating based on long-stay quality measure performance. 5 stars = significantly above average, 1 star = significantly below average.
Need for Help with Daily Activities Increased Info Percent of long-stay residents whose need for help with daily activities has increased 34.3%
45% worse than Maryland average

Maryland average: 23.7%

Walking Ability Worsened Info Percent of long-stay residents whose ability to move independently worsened 30.2%
9% worse than Maryland average

Maryland average: 27.7%

Low Risk Residents with Bowel/Bladder Incontinence Info Percent of low risk long-stay residents who lose control of their bowels or bladder 42.0%
62% worse than Maryland average

Maryland average: 25.9%

Falls with Major Injury Info Percent of long-stay residents experiencing one or more falls with major injury 5.7%
148% worse than Maryland average

Maryland average: 2.3%

High Risk Residents with Pressure Ulcers Info Percent of long-stay high risk residents with pressure ulcers 5.0%
24% better than Maryland average

Maryland average: 6.5%

Urinary Tract Infection Info Percent of long-stay residents with a urinary tract infection 9.1%
468% worse than Maryland average

Maryland average: 1.6%

Lost Too Much Weight Info Percent of long-stay residents who lose too much weight 9.1%
57% worse than Maryland average

Maryland average: 5.8%

Depressive Symptoms Info Percent of long-stay residents who have depressive symptoms 0.0%
100% better than Maryland average

Maryland average: 20.2%

Antipsychotic Use Info Percent of long-stay residents who received an antipsychotic medication 15.2%
17% worse than Maryland average

Maryland average: 12.9%

Pneumococcal Vaccine Info Percent of long-stay residents assessed and appropriately given the pneumococcal vaccine 91.2%
In line with Maryland average

Maryland average: 92.0%

Influenza Vaccine Info Percent of long-stay residents assessed and appropriately given the seasonal influenza vaccine 100.0%
In line with Maryland average

Maryland average: 96.6%

Hospitalizations per 1,000 days Info Number of hospitalizations per 1,000 long-stay resident days. 2.23
69% worse than Maryland average

Maryland average: 1.32

ED visits per 1,000 days Info Number of outpatient emergency department visits per 1,000 long-stay resident days. 1.22
In line with Maryland average

Maryland average: 1.21

Short-stay resident measures
Significantly below average Maryland avg: 3.7 Info CMS star rating based on short-stay quality measure performance. 5 stars = much above average, 1 star = much below average.
Pneumococcal Vaccine Info Percent of short-stay residents assessed and appropriately given the pneumococcal vaccine 78.2%
In line with Maryland average

Maryland average: 78.4%

Antipsychotic medication increase Info Percent of short-stay residents who newly received an antipsychotic medication 9.9%
610% worse than Maryland average

Maryland average: 1.4%

Influenza Vaccine Info Percent of short-stay residents assessed and appropriately given the seasonal influenza vaccine 96.9%
20% better than Maryland average

Maryland average: 80.6%

Re-hospitalized after SNF stay Info Percentage of short-stay residents who were re-hospitalized after their nursing home admission. 28.1%
33% worse than Maryland average

Maryland average: 21.2%

Emergency department visits Info Percentage of short-stay residents who had an outpatient emergency department visit. 8.3%
16% better than Maryland average

Maryland average: 9.9%

Falls with major injury Info Percentage of SNF residents who experience falls with major injury during their stay. 0.0%
100% better than Maryland average

Maryland average: 0.8%

Ability to care for self at discharge Info Percentage of residents at or above expected ability to care for themselves at discharge. 36.7%
32% worse than Maryland average

Maryland average: 53.7%

Successful return to home or community Info Rate of successful return to home or community from a skilled nursing facility. 36.5%
28% worse than Maryland average

Maryland average: 50.6%

Breakdown by payment type

Medicare

29% of new residents, usually for short-term rehab.

Typical stay 18 days

Private pay

71% of new residents, often for short stays.

Typical stay 6 - 7 months

Facility Characteristics

Source: CMS Long-Term Care Facility Characteristics (Data as of Jan 2026)

Total residents 39
Private pay or other
39
100% of residents
Programs & Services
Residents Group

Residents meet regularly to discuss policies, care quality, and activities

CCRC

Part of a Continuing Care Retirement Community offering multiple care levels

Active Resident Council

Organized group of residents that meets regularly to discuss facility policies, quality of life, and activities.

Finances and operations

Based on CMS SNF Cost Report for fiscal year ending in 06/2024.

Nonprofit
Nonprofit Corporation
Net patient revenue Info Net patient revenue — what the home actually collects for resident care, after contractual allowances, bad debt and discounts are subtracted from its gross charges (CMS cost report, Worksheet G-3). It covers resident care only; money the home earns from other sources is shown separately as "Other income."
$5.0M
Net patient income Info Net patient income: net patient revenue minus the home's total operating expenses. A positive figure means it earns more from resident care than it spends to deliver it; a negative figure means the opposite. It excludes non-operating "other income."
-$26.0M
Nonprofit Nonprofit Corporation
Net patient revenue Info Net patient revenue — what the home actually collects for resident care, after contractual allowances, bad debt and discounts are subtracted from its gross charges (CMS cost report, Worksheet G-3). It covers resident care only; money the home earns from other sources is shown separately as "Other income."
$5.0M
Net patient income Info Net patient income: net patient revenue minus the home's total operating expenses. A positive figure means it earns more from resident care than it spends to deliver it; a negative figure means the opposite. It excludes non-operating "other income."
-$26.0M
Other income Info Money the home earns outside of resident care — such as investments, grants, rentals and other non-operating sources (CMS cost report, Worksheet G-3). It is tracked separately from net patient revenue: it is not part of that figure, and it is not included in net patient income.
$24.3M
Payroll costs Info Staff salaries plus wage-related costs — benefits such as payroll taxes, health insurance and retirement — from the home's own accounting records (CMS cost report, Worksheet A). Contract or agency labor is counted separately, under other operating costs.
$13.3M 265.4% of net patient revenue Info Payroll as a share of revenue: staff salaries and wage-related benefits divided by net patient revenue. A higher figure means more of each revenue dollar goes to staff pay.
Other operating costs Info Everything it costs to run the home apart from payroll — food, utilities, supplies, maintenance, contract labor and administration. Calculated as total operating expense minus payroll (staff salaries and wage-related benefits).
$17.7M
Total costs Info The home's total operating expense for the year — all the costs of running it, salaries included (CMS cost report, Worksheet G-3).
$31.0M

What does this home offer?

Room sizes icon
Room sizes icon

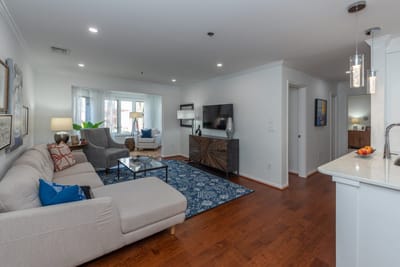
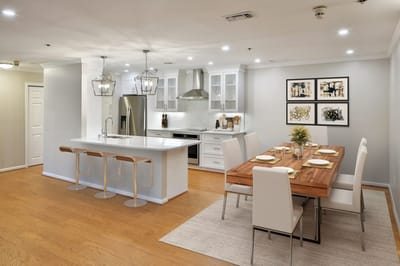
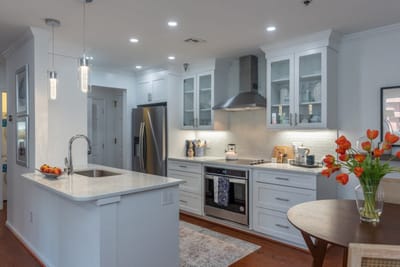
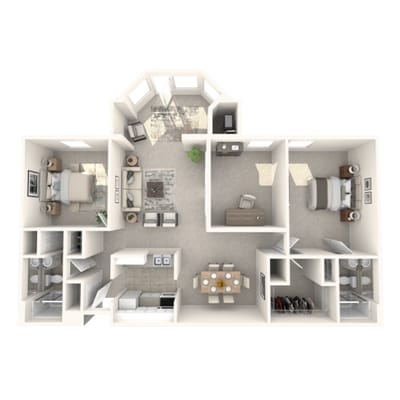
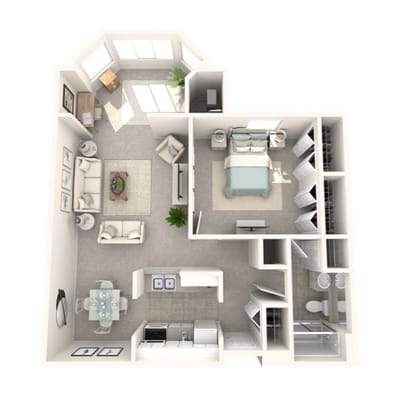
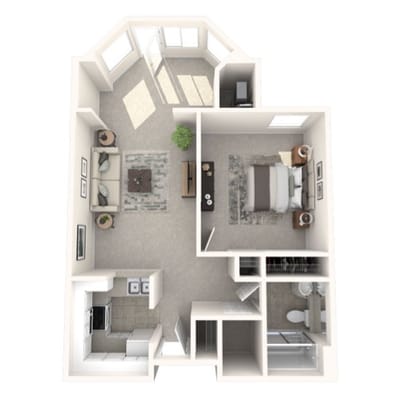
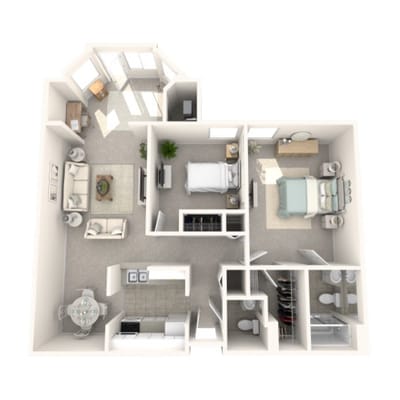
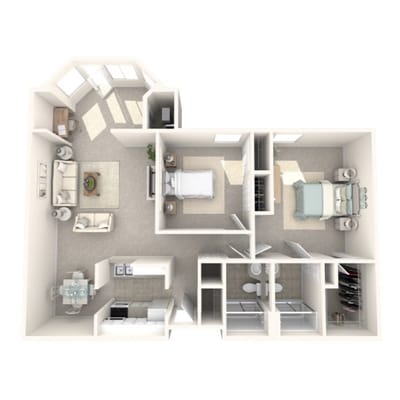
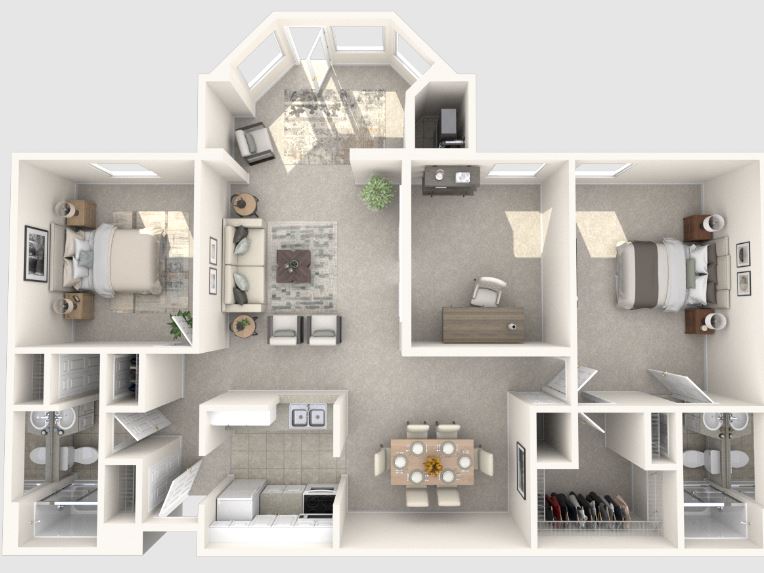
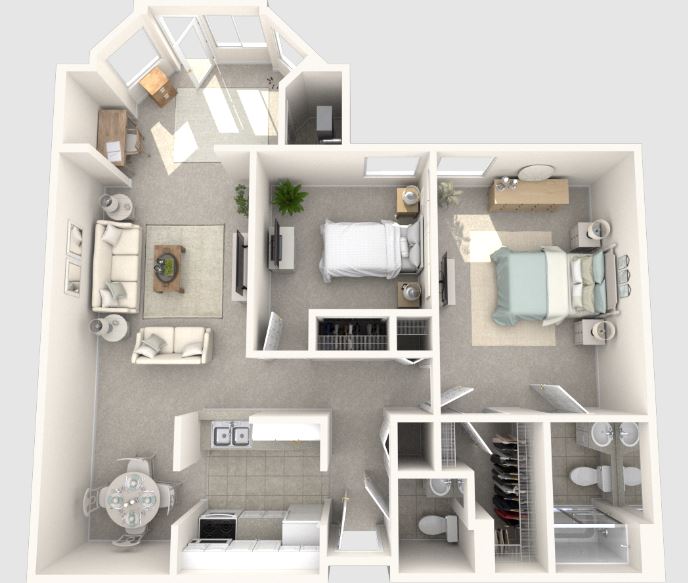
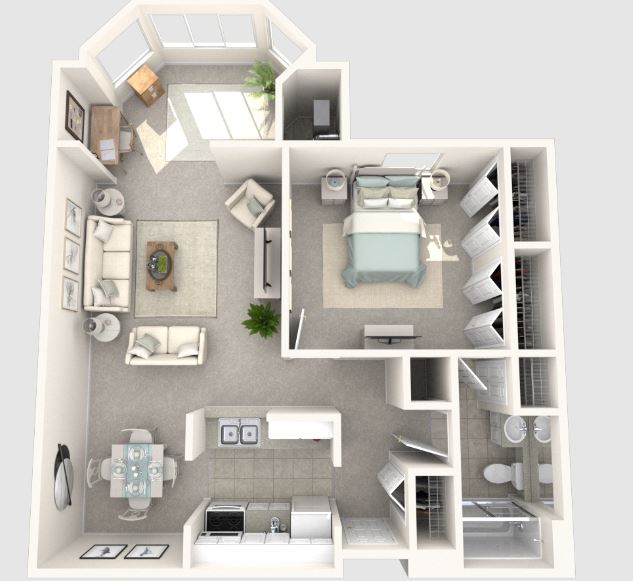
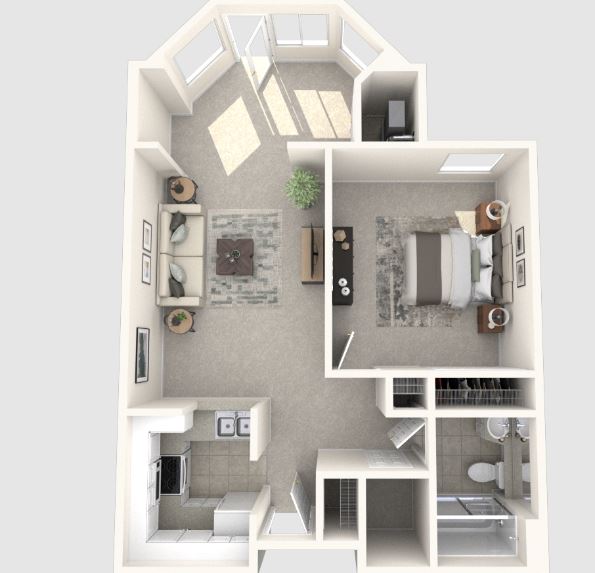
Room Sizes: 700 / 900 / 1,040 - 1,340 sq. ft

Housing options icon

Housing Options: 1 Bed / 2 Bed

Building type icon
Building type icon

Building Type: 3-story

Transportation services icon

Transportation Services

Fitness and recreation icon

Fitness and Recreation

Who this home usually serves

TYPE OF STAY

Primarily short stays

Residents typically stay for brief periods, with frequent admissions and discharges throughout the year.

Most new residents arrive under private pay (71% of admissions), and a typical private pay stay runs around 6 - 7 months.

Admissions
101 total

Coverage residents most often arrive under.

Medicare 29%
Private pay 71%
Discharges
97 total

Coverage residents most often leave under.

Medicare 13%
Private pay 87%

Managed by Phyllis Johns Boulden

Licensed Nursing Home Administrator/Chief Operating Officer

Phyllis Johns Boulden is the Licensed Nursing Home Administrator and Chief Operating Officer at Ginger Cove. With over three decades of dedicated service, she brings extensive expertise in senior living operations. Phyllis holds a master’s degree in healthcare administration from the College of Notre Dame, underscoring her commitment to quality care and leadership within the community.

Living Spaces & Floor Plans for Ginger Cove

Ginger Cove 2Bed B
Ginger Cove 2Bed
Ginger Cove 1 Bed B
Ginger Cove 1 Bed
One-Bedroom Traditional
Download PDF
One-Bedroom Deluxe
Download PDF
Two-Bedroom Traditional
Download PDF
Two-Bedroom Deluxe
Download PDF
Two-Bedroom Den
Download PDF
Ginger Cove – GIN-00112-24-Site-Plan-Map_vFINAL.pdf
Download PDF

Places of interest near Ginger Cove

Address 17.0 miles from city center Info Estimated distance in miles from Annapolis's city center to Ginger Cove's address, calculated via Google Maps.

Calculate Travel Distance to Ginger Cove

Add your location

Address

Compare Nursing Homes around Annapolis

The information below is reported by the Maryland Department of Health, Office of Health Care Quality.

5 facilities compared · CMS & MD Dept. of Health data

Complete Care at Annapolis
NH
HC
PC
RC
Annapolis
97
Facility 97
MD AVG 43
Rank #139 / 697
79.4% -4%3.26 -3%-14%$03210.7-75-
62
Facility 62
MD AVG 43
Rank #286 / 985
Pc Md5 Opco Holdco LLC$12.0M$4.8M39.7%215005
Ginger Cove
NH
AL
HC
IL
MC
Annapolis (River Crescent Drive)
96
Facility 96
MD AVG 43
Rank #140 / 697
66.1% -20%5.57 +25%+47%$0196.3-35A+
51
Facility 51
MD AVG 43
Rank #413 / 985
Phyllis Boulden$5.0M$13.3M265.4%215174
Autumn Lake Healthcare at Crofton
NH
RC
Crofton (Charing Cross)
180
Facility 180
MD AVG 43
Rank #19 / 697
88.0% +7%3.37 +35%-11%$0
27
Facility 27
MD AVG 49.9
Rank #28 / 149
6.8-160-
41
Facility 41
MD AVG 43
Rank #508 / 985
A&R Stern Family Cc Holdings LLC$27.2M$3.0M11.1%215120
Autumn Lake Healthcare at Spa Creek
NH
RC
Annapolis (Milkshake Lane)
130
Facility 130
MD AVG 43
Rank #66 / 697
88.3% +7%3.32 -41%-12%$0
65
Facility 65
MD AVG 49.9
Rank #118 / 149
13.01114-
48
Facility 48
MD AVG 43
Rank #448 / 985
35 Milkshake Holdco LLC$20.1M$1.5M7.2%215258
Autumn Lake Healthcare at Glen Burnie
NH
Glen Burnie (East Furnace Branch Road)
190
Facility 190
MD AVG 43
Rank #13 / 697
88.5% +7%3.15 -71%-17%$0
123
Facility 123
MD AVG 49.9
Rank #146 / 149
30.8-167-
50
Facility 50
MD AVG 43
Rank #419 / 985
7355 Furnace Branch Road East Opco LLC$25.1M$1.4M5.5%215266

Financial Assistance for
Nursing Home in Maryland

Ginger Cove is located in Annapolis, Maryland.
Here are the financial assistance programs available to residents in Maryland.

Get Financial aid guidance

Community Options Waiver

Maryland Medicaid Community Options Waiver

Age 65+ or disabled
General Maryland resident, Medicaid- eligible, nursing home-level care need.
Income Limits (2025) ~$2,829/month 300% FBR, individual
Asset Limits $2,000 (individual), $3,000 (couple) (excludes home, car).
MD

High urban demand; rural outreach efforts.

Benefits
Personal care (5-7 hours/day, e.g., bathing, dressing) Respite care (up to 240 hours/year) Adult day care ($70/day) Home modifications ($1,500 avg.)

Senior Care Program

Maryland Senior Care

Age 65+
General Maryland resident, at risk of nursing home placement.
Income Limits ~$2,000/month individual, varies by county
Asset Limits $11,000 individual
MD

Limited funding; waitlists common in high-demand areas.

Benefits
In-home care (3-5 hours/week) Respite care (up to 10 days/year) Meals (~$6/meal) Transportation (~5 trips/month) Case management

Maryland Nursing Home Medicaid

Maryland Medical Assistance (Medicaid) Nursing Home Program

Age 65+
General Maryland resident, Medicaid-eligible, requires nursing home-level care.
Income Limits (2025) $943/month (individual); most income applied to care costs.
Asset Limits $2,500 (individual), $3,000 (couple); spousal protections up to $155,356.
MD

Home equity limit $636,000; estate recovery applies post-55.

Benefits
24/7 nursing care Meals Therapy Medications (unlimited per medical need)

Senior Assisted Living Subsidy Program

Maryland Senior Assisted Living Group Home Subsidy

Age 62+
General Maryland resident, in or moving to approved assisted living, low/moderate income.
Income Limits (2025) ~$34,000/year individual, varies by county
Asset Limits Not strict; prioritizes low-income.
MD

Not available statewide; facility must be licensed by MDH.

Benefits
Personal care Meals 24-hour supervision (up to $1,500/month subsidy typical)

Veterans Aid and Attendance (A&A) Benefit

Maryland VA Aid and Attendance

Age
General Wartime veteran/spouse, age 65+ or disabled, needs ADL help, Maryland resident.
Income Limits (2025) Net income minus medical expenses < $1,984/month individual with A&A
Asset Limits $155,356 net worth limit
MD

High veteran population in suburban/rural areas.

Benefits
Cash benefit ($1,478-$2,471/month, varies by status) for care costs

Senior Prescription Drug Assistance Program (SPDAP)

Maryland Senior Prescription Drug Assistance Program

Age 65+
General Maryland resident (6+ months), Medicare Part D enrolled.
Income Limits (2025) $48,560/year individual, 300% FPL
Asset Limits None specified.
MD

Supplements Medicare Part D; annual enrollment required.

Benefits
Up to $40/month premium subsidy Reducing drug costs

Medicare Savings Programs (MSP)

Maryland Medicare Savings Programs

Age 65+
General Maryland resident, Medicare Part A/B enrollee.
Income Limits (2025) $2,014/month (QMB), $2,706/month (SLMB/QI, individual).
Asset Limits $9,090 (individual), $13,630 (couple).
MD

Includes QMB, SLMB, QI categories.

Benefits
Covers premiums (up to $174.70/month Part B) Co-pays Deductibles

Community Personal Assistance Services (CPAS)

Maryland Medicaid Community Personal Assistance Services

Age 65+
General Maryland resident, Medicaid-eligible, needs ADL assistance.
Income Limits (2025) $943/month (individual); spend-down available.
Asset Limits $2,500 (individual), $3,000 (couple).
MD

Consumer-directed option allows hiring family caregivers.

Benefits
Personal care (hours vary, typically 20-30/week) Chores Nurse supervision

Frequently Asked Questions about Ginger Cove

What neighborhood is Ginger Cove in?

Ginger Cove is in the River Crescent Drive neighborhood of Annapolis.

Is Ginger Cove in a walkable area?

Ginger Cove has a walk score of 51. Moderately walkable. Some errands can be accomplished on foot, with a mix of nearby amenities.

What is the occupancy rate at Ginger Cove?

Ginger Cove's occupancy is 66%.

Does Ginger Cove have different floorplan options?

Yes — see the floorplan options available at Ginger Cove on this page.

Does Ginger Cove operate as a for-profit or non-profit?

Ginger Cove is registered as a non-profit in MD.

How many beds does Ginger Cove have?

Ginger Cove has 96 beds.

Are there photos of Ginger Cove?

Yes — there are 19 photos of Ginger Cove in the photo gallery on this page.

Guides for Better Senior Living

Care Cost Calculator: See Prices in Your Area

Nursing Home Data Explorer

Don’t Wait Too Long: 7 Red Flag Signs Your Parent Needs Assisted Living Now

The True Cost of Assisted Living in 2025 – And How Families Are Paying For It

Understanding Senior Living Costs: Pricing Models, Discounts & Financial Assistance