Union Plaza Care Center
CMS overall rating Info CMS (the Centers for Medicare & Medicaid Services) is the federal agency that rates nursing home quality. Its Overall Rating runs from 1 to 5 stars, combining health inspections, staffing, and quality measures, with inspections weighted most heavily.

Union Plaza Care Center

CMS overall rating Info CMS (the Centers for Medicare & Medicaid Services) is the federal agency that rates nursing home quality. Its Overall Rating runs from 1 to 5 stars, combining health inspections, staffing, and quality measures, with inspections weighted most heavily.
Calculator: See prices in your area
Union Plaza Care Center accepts Medicare, Medicaid, and private pay.

Overview of Union Plaza Care Center

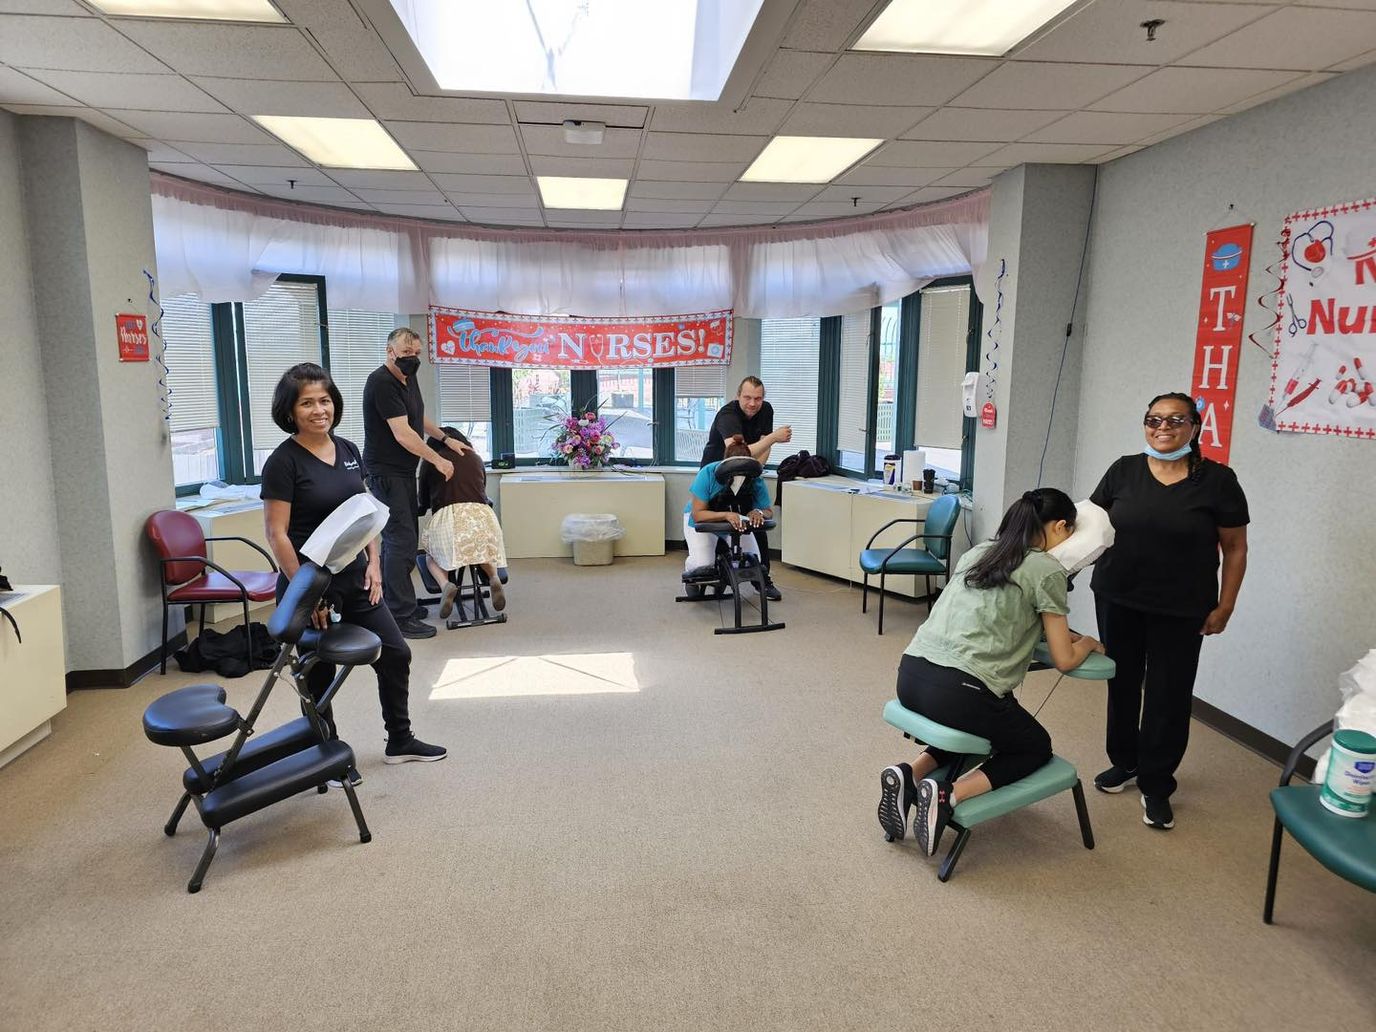
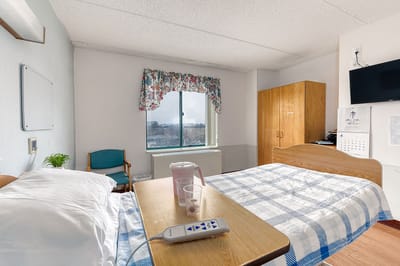
Nestled in Flushing, New York, Union Plaza Care Center provides warm, dedicated care in a modern, well-equipped facility that fosters a sense of community. Offering long-term care and skilled nursing, this care center upholds values of compassion, respect, and inclusivity, ensuring all residents receive personalized care regardless of race or background. Union Plaza boasts an impressive array of nursing care amenities and services to enhance residents’ comfort and well-being. Every aspect of care is tailored to individual needs, from skilled nursing staff and on-site physicians to rehabilitative therapy and pain management programs. The facility offers diverse recreational activities, banking services, and religious accommodations, ensuring residents’ physical, emotional, and spiritual needs are met. Union Plaza’s commitment to cultural diversity is evident in its multilingual staff and culturally appropriate offerings, ensuring all residents feel valued and understood.

Quality ratings

Measured by Centers for Medicare & Medicaid Services (CMS)

Overall rating Info The Overall CMS Rating combines results from health inspections, staffing levels and quality measures. Health inspections carry the most weight. Staffing and quality scores can increase or decrease the final rating based on performance compared to state and national standards.
▲ 30.2% Above NY avg. ▲ 30.2% Above NY avg.NY average: 3.1Click the badge to see the full State ranking.Click here to see the full State ranking.
Health Inspection Info Based on the results of the facility's three most recent standard inspections and any complaint investigations. CMS reviews the number, scope, and severity of deficiencies, with more recent findings weighted more heavily.
▲ 41.3% Above NY avg. ▲ 41.3% Above NY avg.NY average: 2.8Click the badge to see the full State ranking.Click here to see the full State ranking.
Staffing Info Measures average nursing staff hours per resident per day, including Registered Nurses (RNs) and total nursing staff. Ratings are adjusted based on the level of care residents require and are compared to state and national benchmarks.
▼ 26.4% Below NY avg. ▼ 26.4% Below NY avg.NY average: 2.7Click the badge to see the full State ranking.Click here to see the full State ranking.
Quality Measures Info Based on clinical and physical health indicators reported to CMS, such as hospital readmissions, falls, pressure ulcers, and improvements in mobility. These measures reflect how well residents' health needs are being managed.
▲ 4.8% Above NY avg. ▲ 4.8% Above NY avg.NY average: 3.8Click the badge to see the full State ranking.Click here to see the full State ranking.

Staffing hours breakdown

Info Daily nursing hours per resident by staff type, reported to CMS. Higher is generally better — compare this facility to state and national averages to see where staffing stands.

Hours per resident per day — compared to New York state averages

Total nursing care / resident Info This home is ranked 247th out of 407 homes in New York for nurse hours. Total adjusted nursing hours per resident per day, combining RN, LPN, and aide time. CMS adjusts this for case-mix so facilities can be fairly compared.
3h 3m per day
Rank #247 / 407Nurse hours — State benchmarkedThis home is ranked 247th out of 407 homes in New York. Shows adjusted nurse hours per resident per day benchmarked to the New York average, with a ranking across 407 New York facilities. More hours mean more direct care. The national average is about 3.5 hrs; below 3.0 is a red flag.Rankings are based only on facilities in New York that report data for that category. Facilities without available data are excluded from the ranking.Click the rank badge to see the full State ranking.Click here to see the full State ranking.
This facility New York avg (3h 35m per day)
vs New York avg
-15%

6 of 6 metrics below state avg

Staff typeHours / Day / Residentvs state avg
Registered Nurse (RN) Info RNs hold the highest nursing license and can assess residents, interpret test results, and direct care plans. More RN hours per day often signals stronger clinical oversight and faster response to health changes. 32m per day ▼ 23% State avg: 42m per day · National avg: 41m per day
LPN / LVN Info Licensed Practical Nurses (LPNs) or Licensed Vocational Nurses (LVNs) deliver routine hands-on care — medication administration, wound dressing, and monitoring vital signs. They work under RN supervision and make up a large share of daily bedside care. 33m per day ▼ 28% State avg: 46m per day · National avg: 52m per day
Nurse Aide Info Certified Nurse Aides (CNAs) provide the most direct day-to-day assistance: bathing, dressing, feeding, and mobility. Nurse aide hours are typically the largest staffing category and directly affect residents' quality of life. 2h 6m per day ▼ 4% State avg: 2h 11m per day · National avg: 2h 21m per day
Weekend Total Nursing Info Combined nursing hours (RN + LPN + Nurse Aide) per resident per day on weekends. Staffing often drops on weekends — this figure reveals whether the facility maintains adequate coverage outside of weekday hours. 2h 55m per day ▼ 8% State avg: 3h 10m per day · National avg: 3h 26m per day
Physical Therapist Info Hours per resident per day provided by licensed Physical Therapists (PTs) or PT Assistants. PT services help residents recover mobility after injury or illness and are especially important for post-acute (short-stay) rehabilitation. 4m per day ▼ 38% State avg: 7m per day · National avg: 4m per day
Weekend RN Info Registered nurse hours specifically on weekends. Facilities sometimes reduce RN presence on Saturdays and Sundays — a low weekend RN figure compared to weekday hours can indicate reduced clinical oversight when most administrative staff are absent. 18m per day ▼ 35% State avg: 28m per day · National avg: 29m per day

Capacity and availability

This home usually has limited availability

Higher occupancy than the New York average: 88.3%
Occupancy rate
94.1% Rank #157 / 436Occupancy rate — State benchmarkedThis home is ranked 157th out of 436 homes in New York. Shows this facility's occupancy rate versus the New York average, with its Statewide rank out of 436. Higher occupancy signals strong local demand and financial stability.Rankings are based only on facilities in New York that report data for that category. Facilities without available data are excluded from the ranking.Click the rank badge to see the full State ranking.Click here to see the full State ranking.
Avg. Length of Stay
162 days
Bed community size
280-bed community Rank #78 / 748Bed count — State benchmarkedThis home is ranked 78th out of 748 homes in New York. Shows this facility's certified or reported bed count compared to other New York facilities. Larger communities may offer more amenities, programs, and on-site services for residents and families.Rankings are based only on facilities in New York that report data for that category. Facilities without available data are excluded from the ranking.Click the rank badge to see the full State ranking.Click here to see the full State ranking.
A large-scale community that may provide a wide range of amenities, services, and structured programs.
Walk Score
Walk Score: 97 / 100 Rank #81 / 1173Walk Score — State benchmarkedThis home is ranked 81st out of 1173 homes in New York. Shows how walkable this facility's neighborhood is compared to the average Walk Score across New York facilities. Higher scores benefit residents, families, and staff.Rankings are based only on facilities in New York that report data for that category. Facilities without available data are excluded from the ranking.Click the rank badge to see the full State ranking.Click here to see the full State ranking.
Walker's paradise. Daily errands do not require a car, with many shops and services nearby.

Therapy & Rehabilitation

1 service
Rehabilitation Services

Amenities & Lifestyle

Specific ProgramsOn-Site Dialysis
Touring HoursSuggested Visiting Hours are: 10 a.m. to 8 p.m. daily.

Contact Union Plaza Care Center

Staffing Data

Reporting period: October 1 – December 31, 2025 (Q4 2025). Source: CMS Payroll-Based Journal report.

Total staff 264
Employees 191
Contractors 73
Staff to resident ratio 0.97 : 1
456% more staff per resident than New York average
New York average ratio: 0.18 : 1 New York average ratio: 0.18 : 1See full New York ranking
Avg staff/day 146
Average shift 7.1 hours
8% worse than New York average
New York average: 7.7 hours New York average shift: 7.7 hoursSee full New York ranking
Total staff hours (quarter) 95,727

Nursing staff breakdown

Q4 2025 · Oct 1 – Dec 31 More info This data comes from the CMS Payroll-Based Journal report covering October 1 – December 31, 2025.
Registered Nurse

Manages medical care and health needs.

RN Staff Info 39 total: 35 full-time employees and 4 contractors. 39
Average shift length Info Average shift length. Calculated as total hours divided by days worked and average staff per day. 7.6 hours
Licensed Practical Nurse

Assists with medical care and medications.

LPN Staff Info 30 total: 24 full-time employees and 6 contractors. 30
Average shift length Info Average shift length. Calculated as total hours divided by days worked and average staff per day. 7.1 hours
Certified Nursing Assistant

Helps with daily care and mobility.

CNA Staff Info 137 total: 86 full-time employees and 51 contractors. 137
Average shift length Info Average shift length. Calculated as total hours divided by days worked and average staff per day. 7 hours

Contractor staffing

Q4 2025 · Oct 1 – Dec 31 More info This data comes from the CMS Payroll-Based Journal report covering October 1 – December 31, 2025.

Total hours from contractors

21%

20,111 contractor hours this quarter

Certified Nursing Assistant: 51 Licensed Practical Nurse: 6 Occupational Therapy Assistant: 6 Registered Nurse: 4 Physical Therapy Aide: 3 Speech Language Pathologist: 2 Medical Director: 1

Staff by category

Q4 2025 · Oct 1 – Dec 31 More info This data comes from the CMS Payroll-Based Journal report covering October 1 – December 31, 2025.
Certified Nursing Assistant865113750,88892100%7
Licensed Practical Nurse2463013,44492100%7.1
Registered Nurse3543912,60292100%7.6
Other Dietary Services Staff130135,44692100%7.5
Speech Language Pathologist5272,3107582%6.9
Dental Services Staff6062,21392100%7.3
Physical Therapy Aide5382,1316874%6.3
Respiratory Therapy Technician4041,7547885%9.3
Physical Therapy Assistant3031,4757885%9.3
Qualified Social Worker3031,0566773%8.3
Occupational Therapy Aide4041,0446773%6.9
Nurse Practitioner1014205762%7.4
Mental Health Service Worker1013604852%7.5
Administrator1013014347%7
Occupational Therapy Assistant0662203437%4.5
Medical Director011652628%2.5
137 Certified Nursing Assistant
% of Days 100%
30 Licensed Practical Nurse
% of Days 100%
39 Registered Nurse
% of Days 100%
13 Other Dietary Services Staff
% of Days 100%
7 Speech Language Pathologist
% of Days 82%
6 Dental Services Staff
% of Days 100%
8 Physical Therapy Aide
% of Days 74%
4 Respiratory Therapy Technician
% of Days 85%
3 Physical Therapy Assistant
% of Days 85%
3 Qualified Social Worker
% of Days 73%
4 Occupational Therapy Aide
% of Days 73%
1 Nurse Practitioner
% of Days 62%
1 Mental Health Service Worker
% of Days 52%
1 Administrator
% of Days 47%
6 Occupational Therapy Assistant
% of Days 37%
1 Medical Director
% of Days 28%

Penalties and fines

Federal penalties imposed by CMS for regulatory violations, including civil money penalties (fines) and denials of payment for new Medicare/Medicaid admissions.

Source: CMS Penalties Database

No penalties in the past 3 years

No civil money penalties or payment denials were reported in the last 3 years.

Quality of care over time

These measures show how residents usually do over time at this home, based on health outcomes and preventive care.

High-risk clinical events score Info A composite score based on pressure ulcers, falls with injury, weight loss, walking ability decline, and activities of daily living decline. 9.3
5% better than New York average

New York average: 9.8

Functional decline score Info A composite score based on activities of daily living decline, walking ability decline, and incontinence. 20.7
14% worse than New York average

New York average: 18.1

Long-stay resident measures
Above average New York avg: 4.0 Info CMS star rating based on long-stay quality measure performance. 5 stars = significantly above average, 1 star = significantly below average.
Need for Help with Daily Activities Increased Info Percent of long-stay residents whose need for help with daily activities has increased 19.0%
16% worse than New York average

New York average: 16.4%

Walking Ability Worsened Info Percent of long-stay residents whose ability to move independently worsened 15.1%
9% better than New York average

New York average: 16.6%

Low Risk Residents with Bowel/Bladder Incontinence Info Percent of low risk long-stay residents who lose control of their bowels or bladder 28.1%
31% worse than New York average

New York average: 21.4%

Falls with Major Injury Info Percent of long-stay residents experiencing one or more falls with major injury 3.4%
15% worse than New York average

New York average: 3.0%

High Risk Residents with Pressure Ulcers Info Percent of long-stay high risk residents with pressure ulcers 4.4%
39% better than New York average

New York average: 7.2%

Urinary Tract Infection Info Percent of long-stay residents with a urinary tract infection 2.3%
64% worse than New York average

New York average: 1.4%

Lost Too Much Weight Info Percent of long-stay residents who lose too much weight 4.7%
24% better than New York average

New York average: 6.1%

Depressive Symptoms Info Percent of long-stay residents who have depressive symptoms 43.5%
140% worse than New York average

New York average: 18.1%

Antipsychotic Use Info Percent of long-stay residents who received an antipsychotic medication 5.5%
57% better than New York average

New York average: 12.6%

Pneumococcal Vaccine Info Percent of long-stay residents assessed and appropriately given the pneumococcal vaccine 98.0%
7% better than New York average

New York average: 91.4%

Influenza Vaccine Info Percent of long-stay residents assessed and appropriately given the seasonal influenza vaccine 99.2%
In line with New York average

New York average: 95.2%

Hospitalizations per 1,000 days Info Number of hospitalizations per 1,000 long-stay resident days. 2.02
18% worse than New York average

New York average: 1.71

ED visits per 1,000 days Info Number of outpatient emergency department visits per 1,000 long-stay resident days. 1.56
16% worse than New York average

New York average: 1.35

Short-stay resident measures
Above average New York avg: 3.5 Info CMS star rating based on short-stay quality measure performance. 5 stars = much above average, 1 star = much below average.
Pneumococcal Vaccine Info Percent of short-stay residents assessed and appropriately given the pneumococcal vaccine 78.3%
In line with New York average

New York average: 76.6%

Antipsychotic medication increase Info Percent of short-stay residents who newly received an antipsychotic medication 1.1%
14% better than New York average

New York average: 1.3%

Influenza Vaccine Info Percent of short-stay residents assessed and appropriately given the seasonal influenza vaccine 83.8%
6% better than New York average

New York average: 78.8%

Re-hospitalized after SNF stay Info Percentage of short-stay residents who were re-hospitalized after their nursing home admission. 17.7%
14% better than New York average

New York average: 20.6%

Emergency department visits Info Percentage of short-stay residents who had an outpatient emergency department visit. 6.6%
32% better than New York average

New York average: 9.7%

Falls with major injury Info Percentage of SNF residents who experience falls with major injury during their stay. 1.1%
47% worse than New York average

New York average: 0.8%

Ability to care for self at discharge Info Percentage of residents at or above expected ability to care for themselves at discharge. 48.1%
10% worse than New York average

New York average: 53.7%

Successful return to home or community Info Rate of successful return to home or community from a skilled nursing facility. 41.6%
18% worse than New York average

New York average: 50.6%

Breakdown by payment type

Medicare

45% of new residents, usually for short-term rehab.

Typical stay 2 - 3 months

Private pay

43% of new residents, often for short stays.

Typical stay 24 days

Medicaid

12% of new residents, often for long-term daily care.

Typical stay 3 years

Facility Characteristics

Source: CMS Long-Term Care Facility Characteristics (Data as of Jan 2026)

Total residents 271
Medicare
59
21.8% of residents
Medicaid
207
76.4% of residents
Private pay or other
5
1.8% of residents
Programs & Services
Residents Group

Residents meet regularly to discuss policies, care quality, and activities

Family Member Group

Family members meet regularly to discuss policies, care quality, and activities

Active Family Council

Organized group of family members that meets regularly to discuss facility policies, resident care, and activities.

Active Resident Council

Organized group of residents that meets regularly to discuss facility policies, quality of life, and activities.

Finances and operations

Based on CMS SNF Cost Report for fiscal year ending in 12/2023.

Voluntary non-profit community
Operated by a church.
Net patient revenue Info Net patient revenue — what the home actually collects for resident care, after contractual allowances, bad debt and discounts are subtracted from its gross charges (CMS cost report, Worksheet G-3). It covers resident care only; money the home earns from other sources is shown separately as "Other income."
$44.5M
Net patient income Info Net patient income: net patient revenue minus the home's total operating expenses. A positive figure means it earns more from resident care than it spends to deliver it; a negative figure means the opposite. It excludes non-operating "other income."
$1.3M
Voluntary non-profit community Operated by a church.
Net patient revenue Info Net patient revenue — what the home actually collects for resident care, after contractual allowances, bad debt and discounts are subtracted from its gross charges (CMS cost report, Worksheet G-3). It covers resident care only; money the home earns from other sources is shown separately as "Other income."
$44.5M Rank #99 / 403Revenue — State benchmarkedThis home is ranked 99th out of 403 homes in New York. Shows this facility's annual revenue compared to the New York average. Higher revenue generally means more resources for staffing and capital — read alongside Payroll %.Rankings are based only on facilities in New York that report data for that category. Facilities without available data are excluded from the ranking.Click the rank badge to see the full State ranking.Click here to see the full State ranking.
Net patient income Info Net patient income: net patient revenue minus the home's total operating expenses. A positive figure means it earns more from resident care than it spends to deliver it; a negative figure means the opposite. It excludes non-operating "other income."
$1.3M
Other income Info Money the home earns outside of resident care — such as investments, grants, rentals and other non-operating sources (CMS cost report, Worksheet G-3). It is tracked separately from net patient revenue: it is not part of that figure, and it is not included in net patient income.
$4.8K
Payroll costs Info Staff salaries plus wage-related costs — benefits such as payroll taxes, health insurance and retirement — from the home's own accounting records (CMS cost report, Worksheet A). Contract or agency labor is counted separately, under other operating costs. Rank #71 / 403Payroll — State benchmarkedThis home is ranked 71st out of 403 homes in New York. Shows total annual staff payroll benchmarked to the New York average. Higher payroll investment relative to peers often signals better staffing and less reliance on cheaper contract labor.Rankings are based only on facilities in New York that report data for that category. Facilities without available data are excluded from the ranking.Click the rank badge to see the full State ranking.Click here to see the full State ranking.
$23.5M 52.8% of net patient revenue Info Payroll as a share of revenue: staff salaries and wage-related benefits divided by net patient revenue. A higher figure means more of each revenue dollar goes to staff pay. Rank #91 / 403Payroll % — State benchmarkedThis home is ranked 91st out of 403 homes in New York. Shows payroll as a percentage of revenue versus the New York average. Well-run New York facilities typically land around 53–65% — the top third Statewide. Below 25% may signal understaffing or heavy agency use — read with Staffing ratings.Rankings are based only on facilities in New York that report data for that category. Facilities without available data are excluded from the ranking.Click the rank badge to see the full State ranking.Click here to see the full State ranking.
Other operating costs Info Everything it costs to run the home apart from payroll — food, utilities, supplies, maintenance, contract labor and administration. Calculated as total operating expense minus payroll (staff salaries and wage-related benefits).
$19.7M
Total costs Info The home's total operating expense for the year — all the costs of running it, salaries included (CMS cost report, Worksheet G-3).
$43.2M

Who this home usually serves

TYPE OF STAY

Mostly short-term rehab stays

Most residents typically stay for a few weeks or months before returning home or moving on.

New residents most often arrive under Medicare (45% of admissions), and a typical Medicare stay runs around 2 - 3 months.

Admissions
595 total

Coverage residents most often arrive under.

Medicare 45%
Private pay 43%
Medicaid 12%
Discharges
595 total

Coverage residents most often leave under.

Medicare 43%
Private pay 25%
Medicaid 32%

Managed by Debbie Luongo

Administrator

Places of interest near Union Plaza Care Center

Address 2.2 miles from city center Info Estimated distance in miles from Queens's city center to Union Plaza Care Center's address, calculated via Google Maps. — 0.98 miles to nearest hospital (Flushing Hospital Medical Center)

Calculate Travel Distance to Union Plaza Care Center

Add your location

Address

Compare Nursing Homes around Queens

The information below is reported by the New York State Department of Health.

5 facilities compared · CMS & NY Dept. of Health data

Cypress Garden Center for Nursing & Rehabilitation
NH
NC
Queens (Flushing)
268
Facility 268
NY AVG 160
Rank #96 / 748
97.0%
Facility 97.0%
NY AVG 88.3%
Rank #41 / 436
+10%
2.58
Facility 2.58
NY AVG 3.58
Rank #379 / 407
+16%-28%
$0
Facility $0
NY AVG $67.6k
Rank #1 / 415
94
Facility 94
NY AVG 83
Rank #82 / 593
12
Facility 12
NY AVG 18.5
Rank #111 / 414
4.0
Facility 4.0
NY AVG 5.1
Rank #128 / 414
-260A+
96
Facility 96
NY AVG 63
Rank #108 / 1173
Kprh IV Operations, LLC (For Profit)
$39.7M
Facility $39.7M
NY AVG $32.0M
Rank #93 / 403
$15.5M
Facility $15.5M
NY AVG $10.7M
Rank #96 / 403
39.1%
Facility 39.1%
NY AVG 37%
Rank #208 / 403
335446
Union Plaza Care Center
NH
Queens (Flushing)
280
Facility 280
NY AVG 160
Rank #78 / 748
94.1%
Facility 94.1%
NY AVG 88.3%
Rank #157 / 436
+7%
3.05
Facility 3.05
NY AVG 3.58
Rank #247 / 407
+17%-15%
$0
Facility $0
NY AVG $67.6k
Rank #1 / 415
-
9
Facility 9
NY AVG 18.5
Rank #57 / 414
3.0
Facility 3.0
NY AVG 5.1
Rank #61 / 414
-264-
97
Facility 97
NY AVG 63
Rank #81 / 1173
Esther Friedman
$44.5M
Facility $44.5M
NY AVG $32.0M
Rank #99 / 403
$23.5M
Facility $23.5M
NY AVG $10.7M
Rank #71 / 403
52.8%
Facility 52.8%
NY AVG 37%
Rank #91 / 403
335799
Fairview Rehab and Nursing Home
NH
NC
PC
Queens (Forest Hills)
200
Facility 200
NY AVG 160
Rank #169 / 748
100.0%
Facility 100.0%
NY AVG 88.3%
Rank #26 / 436
+13%
3.68
Facility 3.68
NY AVG 3.58
Rank #123 / 407
+157%+3%
$0
Facility $0
NY AVG $67.6k
Rank #1 / 415
69
Facility 69
NY AVG 83
Rank #512 / 593
20
Facility 20
NY AVG 18.5
Rank #257 / 414
6.7
Facility 6.7
NY AVG 5.1
Rank #327 / 414
-196A+
75
Facility 75
NY AVG 63
Rank #530 / 1173
Sara Klein
$50.8M
Facility $50.8M
NY AVG $32.0M
Rank #51 / 403
$15.6M
Facility $15.6M
NY AVG $10.7M
Rank #83 / 403
30.8%
Facility 30.8%
NY AVG 37%
Rank #341 / 403
335146
Rego Park Health Care
NH
RC
Corona
200
Facility 200
NY AVG 160
Rank #169 / 748
91.7%
Facility 91.7%
NY AVG 88.3%
Rank #219 / 436
+4%
2.55
Facility 2.55
NY AVG 3.58
Rank #392 / 407
+41%-29%
$0
Facility $0
NY AVG $67.6k
Rank #1 / 415
-
16
Facility 16
NY AVG 18.5
Rank #192 / 414
4.0
Facility 4.0
NY AVG 5.1
Rank #128 / 414
-190A+
63
Facility 63
NY AVG 63
Rank #672 / 1173
Herbert Tuchman Estate
$28.1M
Facility $28.1M
NY AVG $32.0M
Rank #156 / 403
$13.4M
Facility $13.4M
NY AVG $10.7M
Rank #152 / 403
47.8%
Facility 47.8%
NY AVG 37%
Rank #194 / 403
335379
Oceanview Nursing & Rehabilitation Center
NH
HC
RC
Far Rockaway
102
Facility 102
NY AVG 160
Rank #500 / 748
94.1%
Facility 94.1%
NY AVG 88.3%
Rank #64 / 436
+7%- -100%-
$0
Facility $0
NY AVG $67.6k
Rank #1 / 415
88
Facility 88
NY AVG 83
Rank #214 / 593
21
Facility 21
NY AVG 18.5
Rank #276 / 414
7.0
Facility 7.0
NY AVG 5.1
Rank #339 / 414
-98-
76
Facility 76
NY AVG 63
Rank #517 / 1173
Louis Wolcowitz Estate
$14.9M
Facility $14.9M
NY AVG $32.0M
Rank #323 / 403
$8.3M
Facility $8.3M
NY AVG $10.7M
Rank #291 / 403
55.3%
Facility 55.3%
NY AVG 37%
Rank #83 / 403
335168

Financial Assistance for
Nursing Home in New York

Union Plaza Care Center is located in Queens, New York.
Here are the financial assistance programs available to residents in New York.

Get Financial aid guidance

Community First Choice Option

NY Medicaid CFCO

Age 65+ or disabled
General New York resident, Medicaid- eligible, care need (not necessarily nursing home level).
Income Limits (2025) ~$2,829/month 300% FBR, individual
Asset Limits $30,182 individual, higher due to NY Medicaid expansion
NY

Higher asset limit; urban density increases demand.

Benefits
Personal care (5-7 hours/day) Respite care (240 hours/year) Home modifications ($1,500 avg.) Assistive technology ($500 avg.)

Expanded In-Home Services for the Elderly Program (EISEP)

NY EISEP

Age 60+
General New York resident, at risk of decline but not nursing home level.
Income Limits ~$2,500/month individual, varies
Asset Limits $15,000 individual
NY

Cost-sharing required above certain income; urban/rural balance.

Benefits
In-home care (3-5 hours/week) Respite (up to 10 days/year) Case management Transportation (~5 trips/month)

Senior Citizen Rent Increase Exemption (SCRIE)

NY SCRIE

Age 62+
General NYC resident, live in rent-controlled/stabilized apartment, spend >1/3 of income on rent.
Income Limits (2025) $50,000/year household
Asset Limits No strict asset cap, but income-focused eligibility.
NY

Limited to NYC’s rent-regulated units; high demand in urban areas.

Benefits
Rent freeze (e.g., covers increases of $50-$200+/month); tax credit for landlord

Senior Citizen Homeowners’ Exemption (SCHE)

NY SCHE

Age 65+
General NYC resident, own and live in a 1-3 family home, co-op, or condo.
Income Limits (2025) $58,399/year household
Asset Limits No strict asset cap, income-driven eligibility.
NY

Applies only in NYC; excludes large apartment buildings.

Benefits
Property tax reduction (5-50%, e.g., $500-$5,000/year based on income and property value)

New York Foundation for Senior Citizens (NYFSC) Home Sharing Program

NYFSC Home Sharing

Age One participant must be 60+ (host or guest)
General NYC resident, able to share living space.
Income Limits No strict limit, but targets those needing cost relief.
Asset Limits Not applicable; focus on housing need.
NY

Primarily NYC-focused; limited slots due to demand.

Benefits
Shared housing (reduces rent/living costs by 30-50%, e.g., $500-$1,000/month savings); optional light assistance between housemates

Frequently Asked Questions about Union Plaza Care Center

What neighborhood is Union Plaza Care Center in?

Union Plaza Care Center is in the Flushing neighborhood.

Is Union Plaza Care Center in a walkable area?

Union Plaza Care Center has a walk score of 97. Walker's paradise. Daily errands do not require a car, with many shops and services nearby.

What is the occupancy rate at Union Plaza Care Center?

Union Plaza Care Center's occupancy is 94.1%.

Are there photos of Union Plaza Care Center?

Yes — there are 3 photos of Union Plaza Care Center in the photo gallery on this page.

What is the address of Union Plaza Care Center?

Union Plaza Care Center is located at 33-23 Union St, Queens, NY 11354.

What is the phone number of Union Plaza Care Center?

(718) 478-8880 will put you in contact with the team at Union Plaza Care Center.

Is Union Plaza Care Center Medicare or Medicaid certified?

Yes — Union Plaza Care Center is a CMS-certified provider of Medicare and Medicaid.

Guides for Better Senior Living

Care Cost Calculator: See Prices in Your Area

Nursing Home Data Explorer

Don’t Wait Too Long: 7 Red Flag Signs Your Parent Needs Assisted Living Now

The True Cost of Assisted Living in 2025 – And How Families Are Paying For It

Understanding Senior Living Costs: Pricing Models, Discounts & Financial Assistance