

Total staff
320
Employees
107
Contractors
213

We arrange tours, appointments, and even moving support so you don’t have to
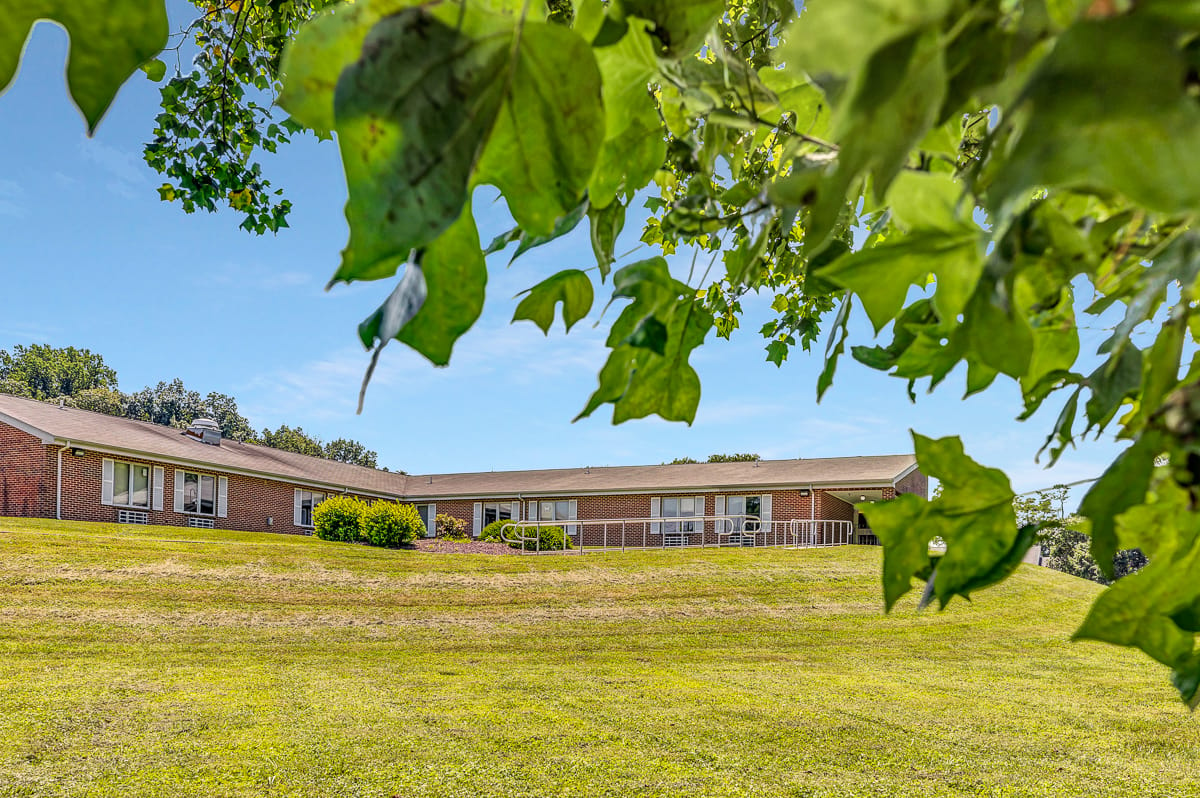
Autumn Lake Healthcare at Calvert Manor enhances the lives of its residents to be healthier and flourish more. The skilled nursing and rehabilitation center consists of professional staff committed to providing seniors with a safe and comfortable home. The results-driven house heeds a relaxing and rejuvenating atmosphere for seniors to thrive in an environment essential to a speedy recovery journey.
As an Autumn Lake home, expect the staff to deliver advanced healthcare programs essential for a successful recovery. Specializing in long-term care and short-term rehabilitation, seniors receive professional care in therapy (speech, occupational, physical), restorative care, wound care, colostomy care, palliative care, lymphedema management, orthopedic care, and stroke recovery– among many others.
Autumn Lake Healthcare at Calvert Manor is an independently owned and operated healthcare center that is licensed to use the Autumn Lake Healthcare name and receive non-healthcare related services. All healthcare-related services are provided solely by Autumn Lake Healthcare at Calvert Manor.
| Staff type | Hours / Day / Resident | vs state avg |
|---|---|---|
|
Registered Nurse (RN)
| 35m per day | ▼ 31% State avg: 50m per day · National avg: 41m per day |
|
LPN / LVN
| 52m per day | ▼ 3% State avg: 54m per day · National avg: 52m per day |
|
Nurse Aide
| 1h 49m per day | ▼ 16% State avg: 2h 10m per day · National avg: 2h 21m per day |
|
Weekend Total Nursing
| 3h 2m per day | ▼ 13% State avg: 3h 29m per day · National avg: 3h 26m per day |
|
Physical Therapist
| 4m per day | ▼ 20% State avg: 5m per day · National avg: 4m per day |
|
Weekend RN
| 23m per day | ▼ 37% State avg: 37m per day · National avg: 29m per day |
Reporting period: October 1 – December 31, 2025 (Q4 2025). Source: CMS Payroll-Based Journal report.
Manages medical care and health needs.
Assists with medical care and medications.
Helps with daily care and mobility.
Total hours from contractors
18,161 contractor hours this quarter
| Certified Nursing Assistant | 44 | 118 | 162 | 21,508 | 92 | 100% | 7.5 |
| Licensed Practical Nurse | 21 | 69 | 90 | 10,633 | 92 | 100% | 7.8 |
| Registered Nurse | 19 | 6 | 25 | 4,775 | 92 | 100% | 7.3 |
| Clinical Nurse Specialist | 5 | 0 | 5 | 1,919 | 65 | 71% | 8.2 |
| Speech Language Pathologist | 0 | 6 | 6 | 1,505 | 89 | 97% | 6.9 |
| Other Dietary Services Staff | 5 | 0 | 5 | 1,227 | 89 | 97% | 6.9 |
| Physical Therapy Aide | 0 | 7 | 7 | 1,192 | 74 | 80% | 6.3 |
| Medication Aide/Technician | 3 | 0 | 3 | 1,056 | 84 | 91% | 7.8 |
| Physical Therapy Assistant | 0 | 4 | 4 | 1,049 | 64 | 70% | 7.7 |
| Respiratory Therapy Technician | 0 | 2 | 2 | 836 | 86 | 93% | 7.6 |
| Dental Services Staff | 3 | 0 | 3 | 789 | 61 | 66% | 7.4 |
| Nurse Practitioner | 2 | 0 | 2 | 528 | 63 | 68% | 8 |
| Qualified Social Worker | 0 | 1 | 1 | 444 | 61 | 66% | 7.3 |
| Occupational Therapy Aide | 1 | 0 | 1 | 432 | 55 | 60% | 7.9 |
| Mental Health Service Worker | 2 | 0 | 2 | 416 | 52 | 57% | 8 |
| Administrator | 1 | 0 | 1 | 405 | 53 | 58% | 7.6 |
| RN Director of Nursing | 1 | 0 | 1 | 244 | 43 | 47% | 5.7 |
Federal penalties imposed by CMS for regulatory violations, including civil money penalties (fines) and denials of payment for new Medicare/Medicaid admissions.
Source: CMS Penalties Database
No penalties in the past 3 years
No civil money penalties or payment denials were reported in the last 3 years.
These measures show how residents usually do over time at this home, based on health outcomes and preventive care.
Maryland average: 12.9
Maryland average: 25.7
Maryland average: 23.7%
Maryland average: 27.7%
Maryland average: 25.9%
Maryland average: 2.3%
Maryland average: 6.5%
Maryland average: 1.6%
Maryland average: 5.8%
Maryland average: 20.2%
Maryland average: 12.9%
Maryland average: 92.0%
Maryland average: 96.6%
Maryland average: 1.32
Maryland average: 1.21
Maryland average: 78.4%
Maryland average: 1.4%
Maryland average: 80.6%
Maryland average: 21.2%
Maryland average: 9.9%
Maryland average: 0.8%
Maryland average: 53.7%
Maryland average: 50.6%
Quality measures are calculated from Minimum Data Set (MDS) assessments. For most measures, lower percentages indicate better care quality.
67% of new residents, usually for short-term rehab.
24% of new residents, often for short stays.
10% of new residents, often for long-term daily care.
Source: CMS Long-Term Care Facility Characteristics (Data as of Jan 2026)
Residents meet regularly to discuss policies, care quality, and activities
Organized group of residents that meets regularly to discuss facility policies, quality of life, and activities.
Data sourced from CMS Long-Term Care Facility Characteristics quarterly report. Payer mix reflects the current resident census by primary payment source.
Historical financial and operational data for Autumn Lake Healthcare at Calvert Manor based on CMS SNF Cost Reports.
Most residents typically stay for a few weeks or months before returning home or moving on.
![]() 4.3 miles from city center
4.3 miles from city center
![]() Estimated distance in miles from Rising Sun's city center to Autumn Lake Healthcare at Calvert Manor's address, calculated via Google Maps.
— 10.31 miles to nearest hospital (Fresenius Medical Care at Union Hospital Of Cecil County)
Estimated distance in miles from Rising Sun's city center to Autumn Lake Healthcare at Calvert Manor's address, calculated via Google Maps.
— 10.31 miles to nearest hospital (Fresenius Medical Care at Union Hospital Of Cecil County)
Add your location
Autumn Lake Healthcare at Calvert Manor is located in Rising Sun, Maryland.
Here are the financial assistance programs available to residents in Maryland.
The information below is reported by the Maryland Department of Health, Office of Health Care Quality.
| Maryland Baptist Aged Home |
NH Nursing Home Licensed facility providing 24/7 skilled nursing care for residents with complex, ongoing medical needs. Staffed by RNs, LPNs, and CNAs. Inspected and star-rated annually by CMS. Accepts Medicare (short-term rehab) and Medicaid (long-term care).
AL Assisted Living A licensed, long-term care setting for seniors or individuals with disabilities who need help with daily activities — like bathing, dressing, and medication management — but not 24-hour skilled nursing. Offers housing, meals, and around-the-clock support while aiming to maximize resident independence. | Baltimore (Mosher) | 29
Facility
29
MD AVG
43
Rank
#254 / 697 |
87.8%
Facility
87.8%
MD AVG
82.4%
Rank
#55 / 146 | +7% | 3.97
Facility
3.97
MD AVG
3.77
Rank
#35 / 144 | -21% | +5% | $0
Facility
$0
MD AVG
$65.0k
Rank
#1 / 146 | 44
Facility
44
MD AVG
49.9
Rank
#82 / 146 | 14.7
Facility
14.7
MD AVG
12.8
Rank
#104 / 146 | - | 26 | - |
84
Facility
84
MD AVG
43
Rank
#66 / 985 | Derrick Dewitt | $2.4M
Facility
$2.4M
MD AVG
$18.7M
Rank
#145 / 145 | $1.5M
Facility
$1.5M
MD AVG
$6.5M
Rank
#145 / 145 | 62.3%
Facility
62.3%
MD AVG
38.5%
Rank
#7 / 145 | 215360 | ||||
| Autumn Lake Healthcare at Calvert Manor |
NH Nursing Home Licensed facility providing 24/7 skilled nursing care for residents with complex, ongoing medical needs. Staffed by RNs, LPNs, and CNAs. Inspected and star-rated annually by CMS. Accepts Medicare (short-term rehab) and Medicaid (long-term care).
AL Assisted Living A licensed, long-term care setting for seniors or individuals with disabilities who need help with daily activities — like bathing, dressing, and medication management — but not 24-hour skilled nursing. Offers housing, meals, and around-the-clock support while aiming to maximize resident independence. | Rising Sun (Telegraph Road) | 144
Facility
144
MD AVG
43
Rank
#49 / 697 |
95.8%
Facility
95.8%
MD AVG
82.4%
Rank
#10 / 146 | +16% | 3.31
Facility
3.31
MD AVG
3.77
Rank
#89 / 144 | -43% | -12% | $0
Facility
$0
MD AVG
$65.0k
Rank
#1 / 146 | 30
Facility
30
MD AVG
49.9
Rank
#39 / 146 | 15.0
Facility
15.0
MD AVG
12.8
Rank
#105 / 146 | - | 136 | - |
10
Facility
10
MD AVG
43
Rank
#837 / 985 | 1881 Telegraph Road Holdco LLC | $24.5M
Facility
$24.5M
MD AVG
$18.7M
Rank
#44 / 145 | $11.0M
Facility
$11.0M
MD AVG
$6.5M
Rank
#37 / 145 | 44.7%
Facility
44.7%
MD AVG
38.5%
Rank
#71 / 145 | 215189 | ||||
| Ednor Apartments II |
NH Nursing Home Licensed facility providing 24/7 skilled nursing care for residents with complex, ongoing medical needs. Staffed by RNs, LPNs, and CNAs. Inspected and star-rated annually by CMS. Accepts Medicare (short-term rehab) and Medicaid (long-term care).
AL Assisted Living A licensed, long-term care setting for seniors or individuals with disabilities who need help with daily activities — like bathing, dressing, and medication management — but not 24-hour skilled nursing. Offers housing, meals, and around-the-clock support while aiming to maximize resident independence.
IL Independent Living Lifestyle-focused communities for older adults offering dining, activities, and transportation with minimal personal care. Best for active, independent seniors who want community without medical support.
IL Independent Living Lifestyle-focused communities for older adults offering dining, activities, and transportation with minimal personal care. Best for active, independent seniors who want community without medical support. | Baltimore (Ednor Gardens-Lakeside) | 49
Facility
49
MD AVG
43
Rank
#226 / 697 | - | - | 3.85
Facility
3.85
MD AVG
3.77
Rank
#46 / 144 | -71% | +2% | $0
Facility
$0
MD AVG
$65.0k
Rank
#134 / 146 | 63
Facility
63
MD AVG
49.9
Rank
#111 / 146 | 15.8
Facility
15.8
MD AVG
12.8
Rank
#110 / 146 | 1 | 45 | - |
69
Facility
69
MD AVG
43
Rank
#199 / 985 | Laurie Netzer | $11.5M
Facility
$11.5M
MD AVG
$18.7M
Rank
#124 / 145 | $3.7M
Facility
$3.7M
MD AVG
$6.5M
Rank
#136 / 145 | 31.8%
Facility
31.8%
MD AVG
38.5%
Rank
#136 / 145 | 215356 | ||||
| Resorts of Augsburg |
NH Nursing Home Licensed facility providing 24/7 skilled nursing care for residents with complex, ongoing medical needs. Staffed by RNs, LPNs, and CNAs. Inspected and star-rated annually by CMS. Accepts Medicare (short-term rehab) and Medicaid (long-term care).
AL Assisted Living A licensed, long-term care setting for seniors or individuals with disabilities who need help with daily activities — like bathing, dressing, and medication management — but not 24-hour skilled nursing. Offers housing, meals, and around-the-clock support while aiming to maximize resident independence.
IL Independent Living Lifestyle-focused communities for older adults offering dining, activities, and transportation with minimal personal care. Best for active, independent seniors who want community without medical support. | Baltimore (Gwynn Oak) | 131
Facility
131
MD AVG
43
Rank
#64 / 697 |
89.4%
Facility
89.4%
MD AVG
82.4%
Rank
#41 / 146 | +9% | 4.17
Facility
4.17
MD AVG
3.77
Rank
#28 / 144 | -11% | +11% | $23.9k
Facility
$23.9k
MD AVG
$65.0k
Rank
#114 / 146 | 37
Facility
37
MD AVG
49.9
Rank
#60 / 146 | 12.3
Facility
12.3
MD AVG
12.8
Rank
#80 / 146 | - | 120 | - |
18
Facility
18
MD AVG
43
Rank
#756 / 985 | - | $22.6M
Facility
$22.6M
MD AVG
$18.7M
Rank
#48 / 145 | $13.6M
Facility
$13.6M
MD AVG
$6.5M
Rank
#25 / 145 | 60.2%
Facility
60.2%
MD AVG
38.5%
Rank
#10 / 145 | 215193 | ||||
| Caritas House Assisted Living |
NH Nursing Home Licensed facility providing 24/7 skilled nursing care for residents with complex, ongoing medical needs. Staffed by RNs, LPNs, and CNAs. Inspected and star-rated annually by CMS. Accepts Medicare (short-term rehab) and Medicaid (long-term care).
AL Assisted Living A licensed, long-term care setting for seniors or individuals with disabilities who need help with daily activities — like bathing, dressing, and medication management — but not 24-hour skilled nursing. Offers housing, meals, and around-the-clock support while aiming to maximize resident independence. | Baltimore (Violetville) | 60
Facility
60
MD AVG
43
Rank
#209 / 697 | - | - | 3.14
Facility
3.14
MD AVG
3.77
Rank
#118 / 144 | +9% | -17% | $67.0k
Facility
$67.0k
MD AVG
$65.0k
Rank
#104 / 146 | 38
Facility
38
MD AVG
49.9
Rank
#64 / 146 | 9.5
Facility
9.5
MD AVG
12.8
Rank
#52 / 146 | 3 | 143 | A |
50
Facility
50
MD AVG
43
Rank
#419 / 985 | Associated Catholic Charities Inc | $24.8M
Facility
$24.8M
MD AVG
$18.7M
Rank
#42 / 145 | $16.1M
Facility
$16.1M
MD AVG
$6.5M
Rank
#15 / 145 | 64.8%
Facility
64.8%
MD AVG
38.5%
Rank
#5 / 145 | 215044 |
Autumn Lake Healthcare at Calvert Manor is in the Telegraph Road neighborhood of Rising Sun.
Autumn Lake Healthcare at Calvert Manor has a walk score of 10. Car-dependent. Most errands require a car, with limited nearby walkable options.
Autumn Lake Healthcare at Calvert Manor's occupancy is 95.8%.
Yes — there is 1 photo of Autumn Lake Healthcare at Calvert Manor in the photo gallery on this page.
Autumn Lake Healthcare at Calvert Manor is located at 1881 Telegraph Rd, Rising Sun, MD 21911.
(410) 658-6555 will put you in contact with the team at Autumn Lake Healthcare at Calvert Manor.
Yes — Autumn Lake Healthcare at Calvert Manor is a CMS-certified provider of Medicare and Medicaid.
Care Cost Calculator: See Prices in Your Area
Nursing Home Data Explorer
Don’t Wait Too Long: 7 Red Flag Signs Your Parent Needs Assisted Living Now
The True Cost of Assisted Living in 2025 – And How Families Are Paying For It
Understanding Senior Living Costs: Pricing Models, Discounts & Financial Assistance


Thank you for your interest!
Our team will be in touch shortly to help with next steps.
