

Total health inspections
3
Virginia average 4.2
Last Health inspection on Apr 2025

We arrange tours, appointments, and even moving support so you don’t have to

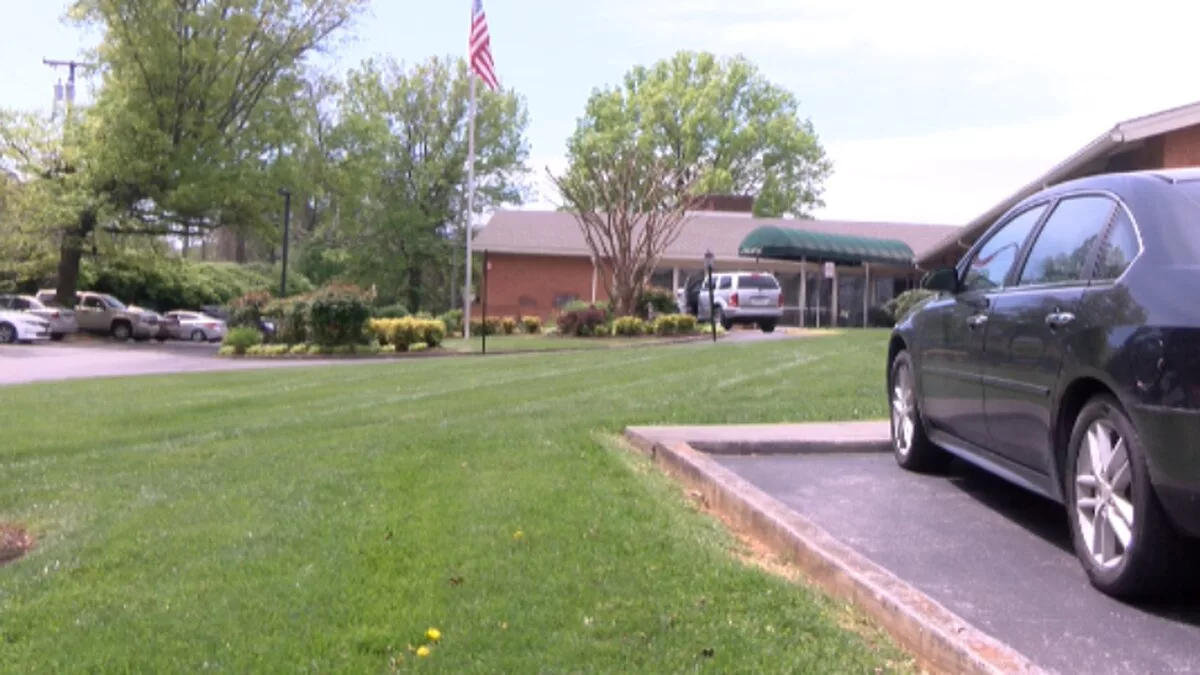
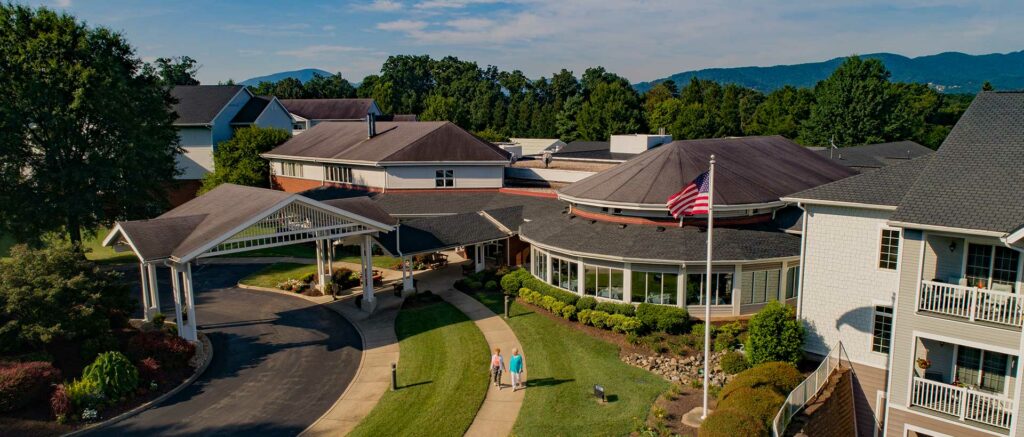
South Roanoke Nursing Home is a short and long-term care facility where residents thrive with the support of quality services for residents seeking to relax and recover. It offers a warm and welcoming atmosphere where residents and staff are encouraged to create friendships and build a mutual level of trust with each other. The nursing home aims to enhance the quality of life for its residents by cultivating their holistic wellness.
South Roanoke residents receive a list of comprehensive amenities and services that help make the lives of its residents hassle-free. These include 24-hour licensed supervision, medication services, balanced meals provided, engaging activities scheduled, and specialized programs available.
 Official CMS rating based on health inspections, staffing and quality measures.
Official CMS rating based on deficiencies found during state health inspections.
Official CMS rating based on nurse staffing hours per resident per day.
Official CMS rating based on clinical outcomes for residents.
Average daily nursing hours per resident (adjusted for acuity). Higher values indicate more nursing time per resident.
Hours of care per resident per day, broken down by staff type. Data from CMS Medicare.
Registered nurse hours per resident per day.
Licensed Practical Nurse / Licensed Vocational Nurse hours per resident per day.
Nurse aide hours per resident per day.
Total number of nurse staff hours per resident per day on weekends.
Physical therapist staff hours per resident per day.
Registered nurse hours per resident per day on weekends.
Official CMS rating based on health inspections, staffing and quality measures.
Official CMS rating based on deficiencies found during state health inspections.
Official CMS rating based on nurse staffing hours per resident per day.
Official CMS rating based on clinical outcomes for residents.
Average daily nursing hours per resident (adjusted for acuity). Higher values indicate more nursing time per resident.
Hours of care per resident per day, broken down by staff type. Data from CMS Medicare.
Registered nurse hours per resident per day.
Licensed Practical Nurse / Licensed Vocational Nurse hours per resident per day.
Nurse aide hours per resident per day.
Total number of nurse staff hours per resident per day on weekends.
Physical therapist staff hours per resident per day.
Registered nurse hours per resident per day on weekends.
May offer a more intimate, personalized care environment.
Occupancy is moderate, suggesting balanced demand.
Residents typically stay for brief periods, with frequent admissions and discharges throughout the year.
29% of new residents, usually for short-term rehab.
66% of new residents, often for short stays.
5% of new residents, often for long-term daily care.
The portion of the home's budget spent on staff, including nurses, caregivers, and other employees who support care and operations.
All remaining costs needed to run the home, such as food, utilities, building maintenance, supplies and administrative expenses.
Key information about the people who lead and staff this community.
Nursing Home 24/7 care needed
Assisted Living For seniors needing help with daily tasks but not full-time nursing.
Assisted Living For seniors needing help with daily tasks but not full-time nursing.
Independent Living For self-sufficient seniors seeking community and minimal assistance.
Memory Care Specialized care for those with Memory Loss, Alzheimer's, or dementia, ensuring safety and support.
Nursing Homes 24/7 care needed
Nursing Home 24/7 care needed
Assisted Living For seniors needing help with daily tasks but not full-time nursing.
 Brandon Oaks Nursing and Rehabilitation Center
 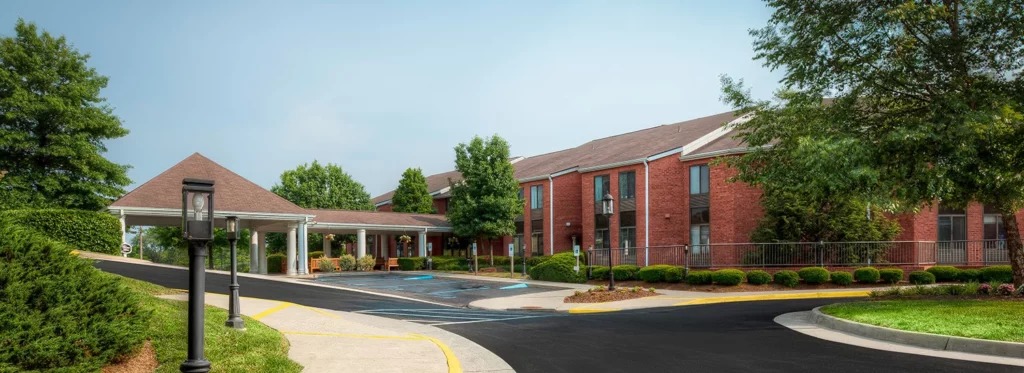 Our Lady of the Valley
 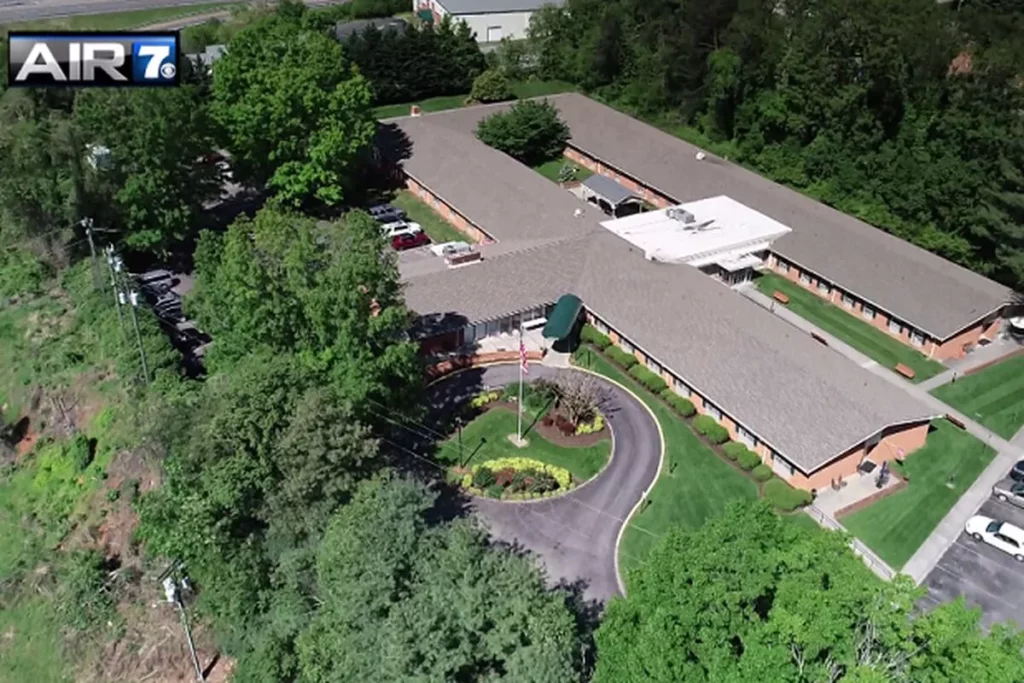 South Roanoke Nursing Home
  Pheasant Ridge Nursing and Rehab Center
  Old Southwest Rehabilitation and Nursing
![]() 3.0 miles from city center — 1.85 miles to nearest hospital (Carilion Clinic Aortic Center - Roanoke)
3.0 miles from city center — 1.85 miles to nearest hospital (Carilion Clinic Aortic Center - Roanoke)
![]() 3823 Franklin Rd SW, Roanoke, VA 24014
3823 Franklin Rd SW, Roanoke, VA 24014
Add your location
Source: CMS Payroll-Based Journal (Q2 2025)
| Role ⓘ | Count ⓘ | Avg Shift (hrs) ⓘ | Uses Contractors? ⓘ |
|---|---|---|---|
| Registered Nurse | 9 | 8.4 | No |
| Licensed Practical Nurse | 17 | 8.7 | No |
| Certified Nursing Assistant | 57 | 8.2 | No |
| Role ⓘ | Employees ⓘ | Contractors ⓘ | Total Staff ⓘ | Total Hours ⓘ | Days Worked ⓘ | % of Days ⓘ | Avg Shift (hrs) ⓘ |
|---|---|---|---|---|---|---|---|
| Certified Nursing Assistant | 57 | 0 | 57 | 14,700 | 91 | 100% | 8.2 |
| Licensed Practical Nurse | 17 | 0 | 17 | 5,645 | 91 | 100% | 8.7 |
| Registered Nurse | 9 | 0 | 9 | 2,544 | 91 | 100% | 8.4 |
| RN Director of Nursing | 2 | 0 | 2 | 998 | 74 | 81% | 7.7 |
| Physical Therapy Aide | 0 | 4 | 4 | 975 | 72 | 79% | 7.4 |
| Clinical Nurse Specialist | 4 | 0 | 4 | 640 | 64 | 70% | 7.8 |
| Speech Language Pathologist | 0 | 4 | 4 | 527 | 70 | 77% | 6.9 |
| Dietitian | 1 | 0 | 1 | 510 | 68 | 75% | 7.5 |
| Mental Health Service Worker | 1 | 0 | 1 | 510 | 65 | 71% | 7.8 |
| Other Dietary Services Staff | 1 | 0 | 1 | 503 | 68 | 75% | 7.4 |
| Nurse Practitioner | 1 | 0 | 1 | 478 | 61 | 67% | 7.8 |
| Administrator | 1 | 0 | 1 | 456 | 57 | 63% | 8 |
| Nurse Aide in Training | 2 | 0 | 2 | 303 | 37 | 41% | 7.4 |
| Qualified Social Worker | 0 | 4 | 4 | 280 | 41 | 45% | 6.8 |
| Respiratory Therapy Technician | 0 | 4 | 4 | 266 | 46 | 51% | 5.8 |
| Physical Therapy Assistant | 0 | 1 | 1 | 208 | 51 | 56% | 4.1 |
| Occupational Therapy Aide | 0 | 1 | 1 | 87 | 31 | 34% | 2.8 |
| Occupational Therapy Assistant | 0 | 1 | 1 | 51 | 17 | 19% | 3 |
Virginia average 4.2
Last Health inspection on Apr 2025
Health citations are formal notices following inspections when they fail to comply with safety and care standards.
All 39 citations resulted from standard inspections.
Virginia average: 0.4
Virginia average: 1
Data sourced from CMS Health Deficiencies reports. Citation severity codes range from A (least serious) to L (most serious). Immediate Jeopardy (J-L) citations indicate situations where the facility's noncompliance has placed residents at risk of death or serious harm.
Source: CMS Long-Term Care Facility Characteristics (Data as of Jan 2026)
Active councils help families stay involved in care decisions and facility operations.
These measures show how residents usually do over time at this home, based on health outcomes and preventive care.
Virginia average: 10.1
Virginia average: 19.7
Virginia average: 16.8%
Virginia average: 19.7%
Virginia average: 22.6%
Virginia average: 3.6%
Virginia average: 5.4%
Virginia average: 1.5%
Virginia average: 5.9%
Virginia average: 14.9%
Virginia average: 12.9%
Virginia average: 91.3%
Virginia average: 94.0%
Virginia average: 1.46
Virginia average: 1.41
Virginia average: 74.9%
Virginia average: 1.2%
Virginia average: 73.6%
Virginia average: 22.0%
Virginia average: 11.7%
Virginia average: 0.8%
Virginia average: 53.7%
Virginia average: 50.6%
Quality measures are calculated from Minimum Data Set (MDS) assessments. For most measures, lower percentages indicate better care quality.
Historical financial and operational data for South Roanoke Nursing Home based on CMS SNF Cost Reports.
Loading trend charts...
Care Cost Calculator: See Prices in Your Area
Nursing Home Data Explorer
Don’t Wait Too Long: 7 Red Flag Signs Your Parent Needs Assisted Living Now
The True Cost of Assisted Living in 2025 – And How Families Are Paying For It
Understanding Senior Living Costs: Pricing Models, Discounts & Financial Assistance

We help families find affordable senior communities and unlock same day discounts, Medicaid, and Medicare options tailored to your needs.
Contact us Today
Touring a community? Use this expert-backed checklist to stay organized, ask the right questions, and find the perfect fit.
We'll send you a PDF version of the touring checklist.


