


Total health inspections
7
Virginia average 4.2
Last Health inspection on Jul 2024
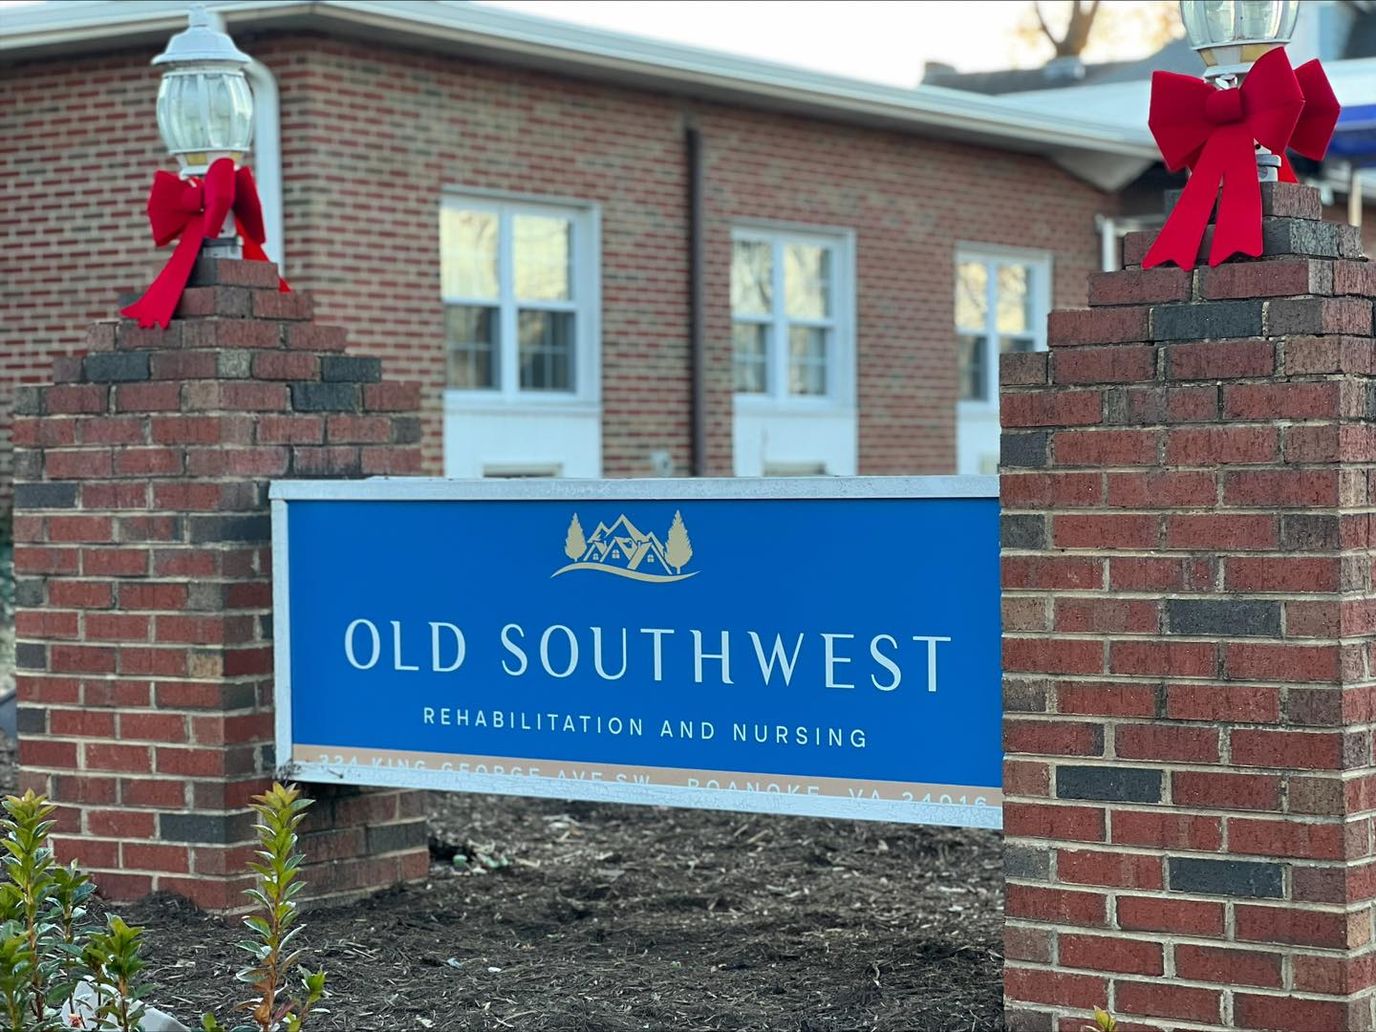
Old Southwest is the premier skilled nursing facility in Roanoke, offering its residents a sense of belonging. With an emphasis on skilled nursing, rehabilitation, and long-term care nursing service, the staff excels in practicing a personal approach to the meaningful service they are guaranteed to deliver to the seniors. The upscale skilled nursing home built its trusted reputation on excellent customer service and exceptional care that has earned the respect of being a reliable senior living community that one’s individual needs.
The short and long-term care nursing home strives to improve the lifestyle of its elderly through community, connection, and care. They offer a personalized care program to meet each individual’s unique needs. Amenities and services include an exceptional dining experience, innovative programs, and educational activities that all aim to ensure a wonderful experience during your golden years and provide additional support.
| Staff type | Hours / Day / Resident | vs state avg |
|---|---|---|
|
Registered Nurse (RN)
| 26m per day | ▼ 37% State avg: 41m per day · National avg: 41m per day |
|
LPN / LVN
| 1h 10m per day | ▲ 16% State avg: 1h 0m per day · National avg: 52m per day |
|
Nurse Aide
| 1h 46m per day | ▼ 17% State avg: 2h 8m per day · National avg: 2h 21m per day |
|
Weekend Total Nursing
| 2h 51m per day | ▼ 14% State avg: 3h 19m per day · National avg: 3h 26m per day |
|
Physical Therapist
| 3m per day | ▼ 32% State avg: 5m per day · National avg: 4m per day |
|
Weekend RN
| 16m per day | ▼ 45% State avg: 28m per day · National avg: 29m per day |
Key information about the people who lead and staff this community.
In Virginia, the Department of Social Services (for assisted living facilities) and the Department of Health (for nursing homes) perform the inspections required to maintain state and federal licensing.
Deficiencies
| This Facility | VA Average | vs. VA Avg |
|---|---|---|---|
|
Total deficiencies
| 108 | 32 | This facility has 238% more total deficiencies than a typical Virginia nursing home (108 vs. VA avg 32).↑ 238% worse |
|
Deficiencies per year
| 21.6 | 6.4 | This facility has 238% more deficiencies per year than a typical Virginia nursing home (21.6 vs. VA avg 6.4).↑ 238% worse |
|
Deficiencies per inspection
| 13.5 | 2.3 | This facility has 487% more deficiencies per inspection than a typical Virginia nursing home (13.5 vs. VA avg 2.3).↑ 487% worse |
Inspections
| This Facility | VA Average | vs. VA Avg |
|---|---|---|---|
|
Total inspections
| 8 | 14 | This facility has had 43% fewer total inspections than the Virginia average (8 vs. VA avg 14). More inspections can mean more regulatory scrutiny rather than worse care.↓ 43% fewer |
Virginia average 4.2
Last Health inspection on Jul 2024
Virginia average 38.4
Virginia average 8.93
Health citations are formal notices following inspections when they fail to comply with safety and care standards.
79 of 131 citations resulted from standard inspections; 47 of 131 resulted from complaint investigations; and 5 of 131 came from combined inspections (standard and complaint).
Virginia average: 0.4
Virginia average: 1
Reporting period: October 1 – December 31, 2025 (Q4 2025). Source: CMS Payroll-Based Journal report.
Manages medical care and health needs.
Assists with medical care and medications.
Helps with daily care and mobility.
Total hours from contractors
1,302 contractor hours this quarter
| Certified Nursing Assistant | 39 | 3 | 42 | 13,583 | 92 | 100% | 9.2 |
| Licensed Practical Nurse | 22 | 29 | 51 | 6,070 | 92 | 100% | 9.6 |
| RN Director of Nursing | 10 | 0 | 10 | 2,819 | 90 | 98% | 7.7 |
| Registered Nurse | 9 | 0 | 9 | 2,137 | 91 | 99% | 8.1 |
| Clinical Nurse Specialist | 2 | 0 | 2 | 588 | 70 | 76% | 7.2 |
| Administrator | 1 | 0 | 1 | 559 | 66 | 72% | 8.5 |
| Nurse Practitioner | 1 | 0 | 1 | 559 | 66 | 72% | 8.5 |
| Qualified Social Worker | 2 | 0 | 2 | 485 | 66 | 72% | 7.3 |
| Dietitian | 1 | 0 | 1 | 438 | 60 | 65% | 7.3 |
| Other Dietary Services Staff | 1 | 0 | 1 | 433 | 57 | 62% | 7.6 |
| Respiratory Therapy Technician | 3 | 0 | 3 | 433 | 58 | 63% | 5.1 |
| Physical Therapy Aide | 1 | 0 | 1 | 384 | 58 | 63% | 6.6 |
| Speech Language Pathologist | 1 | 0 | 1 | 372 | 64 | 70% | 5.8 |
| Mental Health Service Worker | 1 | 0 | 1 | 238 | 34 | 37% | 7 |
| Physical Therapy Assistant | 2 | 0 | 2 | 15 | 9 | 10% | 1.6 |
Includes penalties issued in 2023-2024
Federal penalties imposed by CMS for regulatory violations, including civil money penalties (fines) and denials of payment for new Medicare/Medicaid admissions.
Source: CMS Penalties Database (Data as of Jan 2026)
Virginia average: $52K
Virginia average: 1.8
Virginia average: 0.1
Penalties are imposed by CMS for violations of federal nursing home regulations.
3 penalties in the past 3 years
Multiple penalties were reported in the last 3 years.
Last updated: Jan 2026
These measures show how residents usually do over time at this home, based on health outcomes and preventive care.
Virginia average: 10.1
Virginia average: 19.7
Virginia average: 16.8%
Virginia average: 19.7%
Virginia average: 22.6%
Virginia average: 3.6%
Virginia average: 5.4%
Virginia average: 1.5%
Virginia average: 5.9%
Virginia average: 14.9%
Virginia average: 12.9%
Virginia average: 91.3%
Virginia average: 94.0%
Virginia average: 74.9%
Virginia average: 1.2%
Virginia average: 73.6%
Virginia average: 22.0%
Virginia average: 11.7%
Virginia average: 0.8%
Virginia average: 50.6%
Quality measures are calculated from Minimum Data Set (MDS) assessments. For most measures, lower percentages indicate better care quality.
14% of new residents, usually for short-term rehab.
22% of new residents, often for short stays.
64% of new residents, often for long-term daily care.
Source: CMS Long-Term Care Facility Characteristics (Data as of Jan 2026)
Residents meet regularly to discuss policies, care quality, and activities
Organized group of residents that meets regularly to discuss facility policies, quality of life, and activities.
Data sourced from CMS Long-Term Care Facility Characteristics quarterly report. Payer mix reflects the current resident census by primary payment source.
Historical financial and operational data for Old Southwest Rehabilitation and Nursing from 2012–2023, based on CMS SNF Cost Reports.
Key figures below are for fiscal year ending in 12/2023.
Based on CMS SNF Cost Report for fiscal year ending in 12/2023.
Most residents stay for extended periods and receive ongoing daily care.
Most new residents arrive under Medicaid (64% of admissions), and a typical Medicaid stay runs around 3 - 4 months.
Coverage residents most often arrive under.
Coverage residents most often leave under.
What do you like most about living here?
Nothing
Are there enough caregivers to handle the residents' needs, especially during emergencies?
No
Are the common areas pleasant and comfortable for socializing or relaxing?
No
How do you feel about the level of social interaction available with other residents?
It’s horrible
How was the units offered in this community?
There wasn’t any
Do you feel safe living in this community?
No
How well do you think the community handles emergencies or unexpected events?
Not well
How would you rate the quality and variety of the meals? (1-5)
1
Are special diets handled well?
No
Is the dining schedule flexible enough to meet your preferences?
No
Are there any hidden fees or unexpected charges?
No
Would you recommend this community to others looking for senior living options?
No
Is there anything you wish you knew before moving in?
No
What do you like most about living here?
His roommate was always helpful.
Are there enough caregivers to handle the residents' needs, especially during emergencies?
Yes
Are the common areas pleasant and comfortable for socializing or relaxing?
No
How do you feel about the level of social interaction available with other residents?
None except roommate which was good.
How was the units offered in this community?
N/A
Do you feel safe living in this community?
No
How well do you think the community handles emergencies or unexpected events?
Not well at all. As stated above, during the night on numerous occasions there were not any employees to be found in the entire home.
How would you rate the quality and variety of the meals? (1-5)
1
Are special diets handled well?
No
Is the dining schedule flexible enough to meet your preferences?
No
Are there any hidden fees or unexpected charges?
N/A
Would you recommend this community to others looking for senior living options?
Absolutely Not
Is there anything you wish you knew before moving in?
Yes, I wish I would have been told how terrible they would treat my family member beforehand.
--
![]() 0.8 miles from city center
0.8 miles from city center
![]() Estimated distance in miles from Roanoke's city center to Old Southwest Rehabilitation and Nursing's address, calculated via Google Maps.
Estimated distance in miles from Roanoke's city center to Old Southwest Rehabilitation and Nursing's address, calculated via Google Maps.
Add your location
The information below is reported by the Virginia Department of Social Services and Department of Health.
| Our Lady of the Valley | NH AL MC RC SNF | Roanoke (Gainsboro) | 127
Facility
127
VA AVG
96
Rank
#76 / 365 |
87.4%
Facility
87.4%
VA AVG
70.5
Rank
#63 / 297 | +24% | 3.79
Facility
3.79
VA AVG
3.74
Rank
#42 / 78 | -42% | +1% | $0
Facility
$0
VA AVG
$54.3k
Rank
#1 / 82 | 14
Facility
14
VA AVG
38.4
Rank
#14 / 77 | 4.7
Facility
4.7
VA AVG
8.9
Rank
#18 / 77 | - | 111 | A+ |
68
Facility
68
VA AVG
44
Rank
#73 / 446 | David Rawlings | $14.8MFiscal year ending 06/2024
Facility
$14.8MFiscal year ending 06/2024
VA AVG
$18.3M
Rank
#51 / 78 | $8.2MFiscal year ending 06/2024
Facility
$8.2MFiscal year ending 06/2024
VA AVG
$6.9M
Rank
#48 / 78 | 55.5%Fiscal year ending 06/2024
Facility
55.5%Fiscal year ending 06/2024
VA AVG
39.7%
Rank
#31 / 78 | 495357 | ||||
| Brandon Oaks Nursing and Rehabilitation Center | NH AL HC IL MC SNF | Roanoke (Westland) | 43
Facility
43
VA AVG
96
Rank
#313 / 365 |
53.5%
Facility
53.5%
VA AVG
70.5
Rank
#240 / 297 | -24% | 5.33
Facility
5.33
VA AVG
3.74
Rank
#14 / 78 | +28% | +42% | $0
Facility
$0
VA AVG
$54.3k
Rank
#1 / 82 | 12
Facility
12
VA AVG
38.4
Rank
#8 / 77 | 4.0
Facility
4.0
VA AVG
8.9
Rank
#10 / 77 | - | 23 | - |
33
Facility
33
VA AVG
44
Rank
#281 / 446 | Heather Neff | $7.2MFiscal year ending 12/2023
Facility
$7.2MFiscal year ending 12/2023
VA AVG
$18.3M
Rank
#29 / 78 | $7.0MFiscal year ending 12/2023
Facility
$7.0MFiscal year ending 12/2023
VA AVG
$6.9M
Rank
#53 / 78 | 96.3%Fiscal year ending 12/2023
Facility
96.3%Fiscal year ending 12/2023
VA AVG
39.7%
Rank
#75 / 78 | 495373 | ||||
| Friendship Retirement Community | NH AL IL MC RC SNF | Roanoke (Hollins) | 253
Facility
253
VA AVG
96
Rank
#5 / 365 |
91.2%
Facility
91.2%
VA AVG
70.5
Rank
#42 / 297 | +29% | 4.46
Facility
4.46
VA AVG
3.74
Rank
#31 / 78 | +4% | +19% | $0
Facility
$0
VA AVG
$54.3k
Rank
#1 / 82 | 18
Facility
18
VA AVG
38.4
Rank
#27 / 77 | 4.5
Facility
4.5
VA AVG
8.9
Rank
#17 / 77 | - | 231 | A+ |
48
Facility
48
VA AVG
44
Rank
#185 / 446 | Friendship Foundation Inc | $29.8MFiscal year ending 06/2024
Facility
$29.8MFiscal year ending 06/2024
VA AVG
$18.3M
Rank
#19 / 78 | $15.3MFiscal year ending 06/2024
Facility
$15.3MFiscal year ending 06/2024
VA AVG
$6.9M
Rank
#19 / 78 | 51.5%Fiscal year ending 06/2024
Facility
51.5%Fiscal year ending 06/2024
VA AVG
39.7%
Rank
#47 / 78 | 495092 | ||||
| South Roanoke Nursing Home | NH HOS MC RC SNF | Roanoke (Edgehill) | 98
Facility
98
VA AVG
96
Rank
#156 / 365 |
89.9%
Facility
89.9%
VA AVG
70.5
Rank
#44 / 297 | +28% | 3.36
Facility
3.36
VA AVG
3.74
Rank
#50 / 78 | +6% | -10% | $0
Facility
$0
VA AVG
$54.3k
Rank
#1 / 82 | 39
Facility
39
VA AVG
38.4
Rank
#50 / 77 | 13.0
Facility
13.0
VA AVG
8.9
Rank
#60 / 77 | - | 88 | A+ |
45
Facility
45
VA AVG
44
Rank
#207 / 446 | American Healthcare LLC | $9.5MFiscal year ending 12/2023
Facility
$9.5MFiscal year ending 12/2023
VA AVG
$18.3M
Rank
#72 / 78 | $5.1MFiscal year ending 12/2023
Facility
$5.1MFiscal year ending 12/2023
VA AVG
$6.9M
Rank
#69 / 78 | 53.6%Fiscal year ending 12/2023
Facility
53.6%Fiscal year ending 12/2023
VA AVG
39.7%
Rank
#15 / 78 | 495002 | ||||
| Old Southwest Rehabilitation and Nursing | NH HOS MC PC RC SNF | Roanoke (Old Southwest) | 130
Facility
130
VA AVG
96
Rank
#68 / 365 |
25.4%
Facility
25.4%
VA AVG
70.5
Rank
#290 / 297 | -64% | 3.82
Facility
3.82
VA AVG
3.74
Rank
#42 / 78 | -27% | +2% | $143.8k
Facility
$143.8k
VA AVG
$54.3k
Rank
#82 / 82 | 131
Facility
131
VA AVG
38.4
Rank
#76 / 77 | 18.7
Facility
18.7
VA AVG
8.9
Rank
#75 / 77 | 4 | 33 | A+ |
57
Facility
57
VA AVG
44
Rank
#132 / 446 | Andrew Shuler | $8.8MFiscal year ending 12/2023
Facility
$8.8MFiscal year ending 12/2023
VA AVG
$18.3M
Rank
#74 / 78 | $4.2MFiscal year ending 12/2023
Facility
$4.2MFiscal year ending 12/2023
VA AVG
$6.9M
Rank
#71 / 78 | 47.8%Fiscal year ending 12/2023
Facility
47.8%Fiscal year ending 12/2023
VA AVG
39.7%
Rank
#19 / 78 | 495156 |
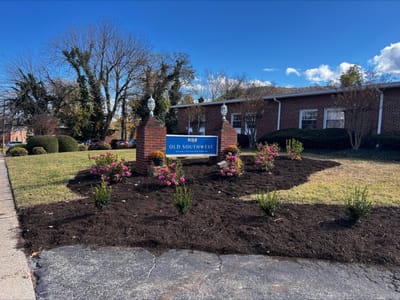
Old Southwest Rehabilitation and Nursing is located in Roanoke, Virginia.
Here are the financial assistance programs available to residents in Virginia.
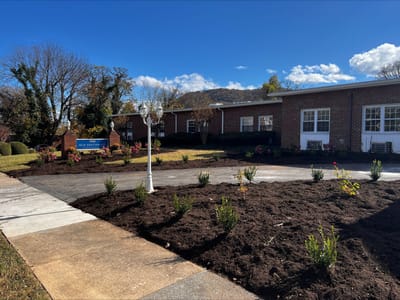
Old Southwest Rehabilitation and Nursing is in the Old Southwest neighborhood of Roanoke.
Old Southwest Rehabilitation and Nursing has a walk score of 57. Moderately walkable. Some errands can be accomplished on foot, with a mix of nearby amenities.
Old Southwest Rehabilitation and Nursing's occupancy is 51.3%.
No, Old Southwest Rehabilitation and Nursing has a no-pet policy.
Old Southwest Rehabilitation and Nursing is registered as a for-profit in VA.
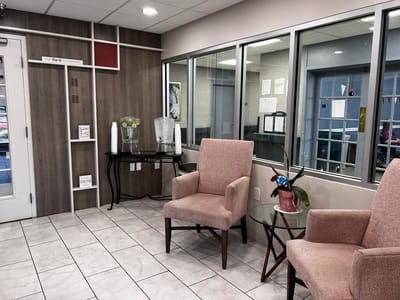
Yes — there are 4 photos of Old Southwest Rehabilitation and Nursing in the photo gallery on this page.
Old Southwest Rehabilitation and Nursing is located at 324 King George Ave Sw, Roanoke, VA 24016.
Care Cost Calculator: See Prices in Your Area
Nursing Home Data Explorer
Don’t Wait Too Long: 7 Red Flag Signs Your Parent Needs Assisted Living Now
The True Cost of Assisted Living in 2025 – And How Families Are Paying For It
Understanding Senior Living Costs: Pricing Models, Discounts & Financial Assistance


