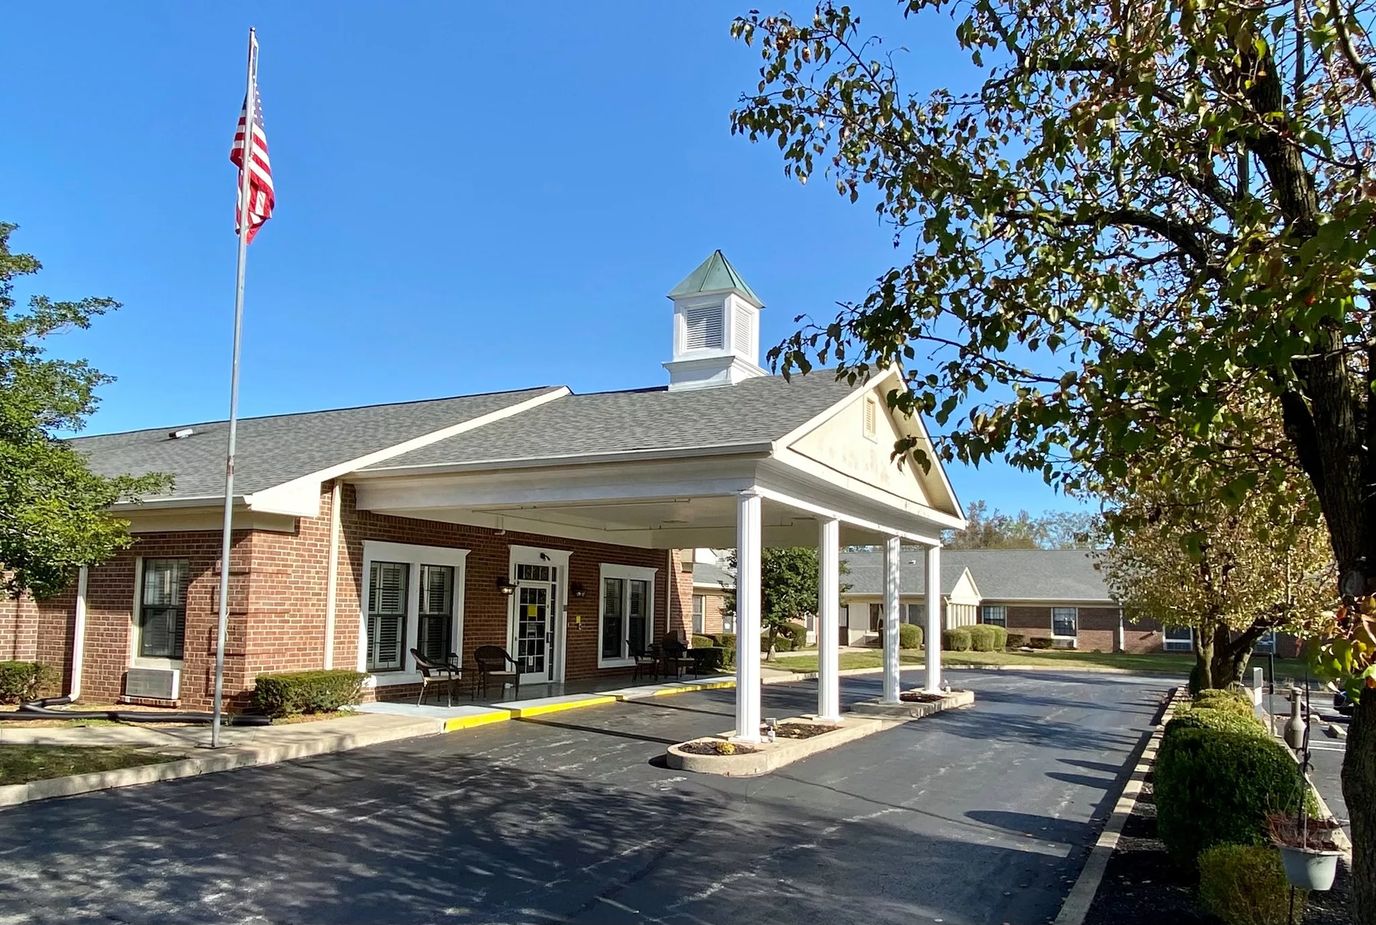
Spring Meadows Health Care Center
Nursing Home & Skilled Nursing · Clarksville, TN
CMS overall rating Info The Overall CMS Rating is scored from 1 to 5 stars and combines results from health inspections, staffing levels, and quality measures. Health inspections carry the most weight. Staffing and quality scores can increase or decrease the final rating based on performance compared to state and national standards.

Spring Meadows Health Care Center

Nursing Home & Skilled Nursing · Clarksville, TN
CMS overall rating Info The Overall CMS Rating is scored from 1 to 5 stars and combines results from health inspections, staffing levels, and quality measures. Health inspections carry the most weight. Staffing and quality scores can increase or decrease the final rating based on performance compared to state and national standards.
Calculator: See prices in your area
Spring Meadows Health Care Center accepts Medicare, Medicaid, and private pay.

Overview of Spring Meadows Health Care Center

Spring Meadows Health Care Center is a community that proudly elevates the recovery experience of its residents. A premier nursing home has been awarded a list of accolades, some of which are from the U.S. News and World Report ranking them as one of the Best Nursing Homes in the country. As a short-term rehabilitation and long-term nursing home with memory care services, the professional care staff is committed to having residents get back on their feet as soon as possible.

(931) 552-0181

Quality ratings

Measured by Centers for Medicare & Medicaid Services (CMS)

Overall rating Info The Overall CMS Rating combines results from health inspections, staffing levels and quality measures. Health inspections carry the most weight. Staffing and quality scores can increase or decrease the final rating based on performance compared to state and national standards.
▼ 67.3% Below TN avg. ▼ 67.3% Below TN avg.Click the badge to see the full State ranking.Click here to see the full State ranking.
Health Inspection Info Based on the results of the facility's three most recent standard inspections and any complaint investigations. CMS reviews the number, scope, and severity of deficiencies, with more recent findings weighted more heavily.
▼ 65.8% Below TN avg. ▼ 65.8% Below TN avg.Click the badge to see the full State ranking.Click here to see the full State ranking.
Staffing Info Measures average nursing staff hours per resident per day, including Registered Nurses (RNs) and total nursing staff. Ratings are adjusted based on the level of care residents require and are compared to state and national benchmarks.
▼ 18.4% Below TN avg. ▼ 18.4% Below TN avg.Click the badge to see the full State ranking.Click here to see the full State ranking.
Quality Measures Info Based on clinical and physical health indicators reported to CMS, such as hospital readmissions, falls, pressure ulcers, and improvements in mobility. These measures reflect how well residents' health needs are being managed.
▲ 7.2% Above TN avg. ▲ 7.2% Above TN avg.Click the badge to see the full State ranking.Click here to see the full State ranking.

Staffing hours breakdown

Info Daily nursing hours per resident by staff type, reported to CMS. Higher is generally better — compare this facility to state and national averages to see where staffing stands.

Hours per resident per day — compared to Tennessee state averages

Total nursing care / resident Info This home is ranked 115th out of 172 homes in Tennessee. Total adjusted nursing hours per resident per day, combining RN, LPN, and aide time. CMS adjusts this for case-mix so facilities can be fairly compared.
3h 13m per day
Rank #115 / 172Nurse hours — State benchmarkedThis home is ranked 115th out of 172 homes in Tennessee. Shows adjusted nurse hours per resident per day benchmarked to the Tennessee average, with a ranking across 172 Tennessee SNFs. More hours mean more direct care. The national average is about 3.5 hrs; below 3.0 is a red flag.Click the rank badge to see the full State ranking.Click here to see the full State ranking.
This facility Tennessee avg (3h 40m per day)
vs Tennessee avg
-12%

6 of 6 metrics below state avg

Staff typeHours / Day / Residentvs state avg
Registered Nurse (RN) Info RNs hold the highest nursing license and can assess residents, interpret test results, and direct care plans. More RN hours per day often signals stronger clinical oversight and faster response to health changes. 25m per day ▼ 32% State avg: 37m per day · National avg: 41m per day
LPN / LVN Info Licensed Practical Nurses (LPNs) or Licensed Vocational Nurses (LVNs) deliver routine hands-on care — medication administration, wound dressing, and monitoring vital signs. They work under RN supervision and make up a large share of daily bedside care. 57m per day ▼ 14% State avg: 1h 6m per day · National avg: 52m per day
Nurse Aide Info Certified Nurse Aides (CNAs) provide the most direct day-to-day assistance: bathing, dressing, feeding, and mobility. Nurse aide hours are typically the largest staffing category and directly affect residents' quality of life. 2h 1m per day ▼ 6% State avg: 2h 9m per day · National avg: 2h 21m per day
Weekend Total Nursing Info Combined nursing hours (RN + LPN + Nurse Aide) per resident per day on weekends. Staffing often drops on weekends — this figure reveals whether the facility maintains adequate coverage outside of weekday hours. 3h 1m per day ▼ 10% State avg: 3h 21m per day · National avg: 3h 26m per day
Physical Therapist Info Hours per resident per day provided by licensed Physical Therapists (PTs) or PT Assistants. PT services help residents recover mobility after injury or illness and are especially important for post-acute (short-stay) rehabilitation. 3m per day ▼ 40% State avg: 5m per day · National avg: 4m per day
Weekend RN Info Registered nurse hours specifically on weekends. Facilities sometimes reduce RN presence on Saturdays and Sundays — a low weekend RN figure compared to weekday hours can indicate reduced clinical oversight when most administrative staff are absent. 23m per day ▼ 8% State avg: 25m per day · National avg: 29m per day

Types of Care at Spring Meadows Health Care Center

Skilled Nursing

Capacity and availability

Avg. Length of Stay
136 days
Bed community size
32-bed community Rank #409 / 429Bed count — State benchmarkedThis home is ranked 409th out of 429 homes in Tennessee. Shows this facility's certified or reported bed count compared to other Tennessee SNFs. Larger communities may offer more amenities, programs, and on-site services for residents and families.Click the rank badge to see the full State ranking.Click here to see the full State ranking.
A moderately sized community that may balance personal attention with shared amenities and social activities.
Years in operation
39 years in operation Rank #46 / 383Years in operation — State benchmarkedThis home is ranked 46th out of 383 homes in Tennessee. Shows how long this facility has been in operation compared to other Tennessee SNFs. Longer operating histories may benefit residents, families, and staff.Click the rank badge to see the full State ranking.Click here to see the full State ranking.
A longer operating history, which may indicate experience navigating regulations and delivering ongoing care.
Walk Score
Walk Score: 22 / 100 Rank #370 / 555Walk Score — State benchmarkedThis home is ranked 370th out of 555 homes in Tennessee. Shows how walkable this facility's neighborhood is compared to the average Walk Score across Tennessee SNFs. Higher scores benefit residents, families, and staff.Click the rank badge to see the full State ranking.Click here to see the full State ranking.
Car-dependent. Most errands require a car, with limited nearby walkable options.
BBB Rating
BBB Rating: A+ (Not Accredited)
An independent rating from the Better Business Bureau based on factors such as complaint history, transparency, and business practices.
How BBB ratings work

About this community

Occupancy

Occupancy rate
100%
Rank #1 / 302Occupancy rate — State benchmarkedThis home is ranked 1st out of 302 homes in Tennessee. Shows this facility's occupancy rate versus the Tennessee average, with its Statewide rank out of 302. Higher occupancy signals strong local demand and financial stability.Click the rank badge to see the full State ranking.Click here to see the full State ranking.
Higher than the Tennessee average: 71.6%
Occupied beds
32 / 32
Average residents per home in Tennessee 82 per day

License Details

Facility TypeAssisted Care Living Facility
StatusFacility Closed
ExpirationJune 30, 2000
License Number00000132
CMS Certification Number445402

Ownership & Operating Entity

Spring Meadows Health Care Center is legally operated by Spring Meadows Retirement Village, and administrated by Shannon R. Jones.

Contact Spring Meadows Health Care Center

Inspection History

In Tennessee, the Department of Health, Division of Health Care Facilities performs unannounced inspections and investigations to ensure facilities provide high-quality resident care.

Since 2020 · 6 years of data 24 citations

Inspection Scorecard Info This scorecard compares key inspection, citation, and complaint metrics at this facility against the Tennessee state average. Metrics rated ≥15% worse than average are highlighted in red; those ≥15% better are highlighted in green.

Since 2020 vs. Tennessee state average
Overall vs. TN average 2 Worse Metrics worse than Tennessee average:
• Total citations (500% above)
• Citations per year (471% above)
0 Better No metrics in this bucket.
Latest Inspection July 11, 2024 Annual Inspection

Citations Info Citations are formal regulatory issues recorded during state inspections.

This FacilityTN Averagevs. TN Avg
Total citations Info Formal regulatory issues recorded by inspectors across all inspection types. 244 This facility has 500% more total citations than a typical Tennessee nursing home (24 vs. TN avg 4).↑ 500% worse
Citations per year Info Average citations per year since 2020. 40.7 This facility has 471% more citations per year than a typical Tennessee nursing home (4 vs. TN avg 0.7).↑ 471% worse

Inspection Reports Summary Info An editor-reviewed summary of the themes and findings across this facility's recent inspection reports.

The most recent inspection on July 11, 2024, found deficiencies related to untimely completion of resident assessments. Earlier inspections showed multiple issues including care plan deficiencies, infection control problems, inadequate supervision leading to an immediate jeopardy elopement event, and environmental maintenance concerns. Complaint investigations included a substantiated case of inadequate supervision resulting in immediate jeopardy, which was corrected and resolved. Prior reports also noted problems with staff training, feeding tube care, and quality assurance processes. The facility’s inspection history shows ongoing challenges with timely assessments and care planning, with some improvement in addressing immediate jeopardy concerns.

Read the full inspection reports for this facility, including detailed findings and corrective actions.

Show Inspection Reports

Health Inspection History

Inspections since 2020
Total health inspections 5

Tennessee average 3.5


Last Health inspection on Jul 2024

Total health citations
23 Rank #139 / 176Health citations — State benchmarkedThis home is ranked 139th out of 176 homes in Tennessee. Shows this facility's total health deficiency citations benchmarked to the Tennessee State average, with a ranking across all 176 TN SNFs. Lower citation counts earn a better rank.Click the rank badge to see the full State ranking.Click here to see the full State ranking.

Tennessee average 15.4

Citations per inspection
4.6 Rank #96 / 176Citations per inspection — State benchmarkedThis home is ranked 96th out of 176 homes in Tennessee. Shows average deficiency citations per CMS inspection for this facility versus the Tennessee mean across 176 SNFs with citation data. Lower is better.Click the rank badge to see the full State ranking.Click here to see the full State ranking.

Tennessee average 4.39


Health citations are formal notices following inspections when they fail to comply with safety and care standards.

20 of 23 citations resulted from standard inspections; 2 of 23 resulted from complaint investigations; and 1 of 23 came from combined inspections (standard and complaint).

Breakdown of citation severity (last 6 years)
Critical Health citations
6
445% worse than Tennessee average

Tennessee average: 1.1


Serious Health citations
0
100% better than Tennessee average

Tennessee average: 0.6

6 critical citations Tennessee average: 1.1

0 serious citations Tennessee average: 0.6

17 moderate citations Tennessee average: 13.7

0 minor citations Tennessee average: 0.1
Citations history (last 6 years)
Infection Control moderate citation Jul 11, 2024
Corrected

Nursing Services moderate citation Jul 11, 2024
Corrected

Quality of Care moderate citation Jul 11, 2024
Corrected

Care Planning moderate citation Jul 11, 2024
Corrected

Staffing Data

Reporting period: October 1 – December 31, 2025 (Q4 2025). Source: CMS Payroll-Based Journal report.

Total staff 211
Employees 160
Contractors 51
Staff to resident ratio 2.05:1
17% better than Tennessee average
Tennessee average ratio: 1.75:1 Tennessee average ratio: 1.75:1See full Tennessee ranking
Avg staff/day 58
Average shift 7.8 hours
6% worse than Tennessee average
Tennessee average: 8.3 hours Tennessee average shift: 8.3 hoursSee full Tennessee ranking
Total staff hours (quarter) 41,474

Nursing staff breakdown

Q4 2025 · Oct 1 – Dec 31 More info This data comes from the CMS Payroll-Based Journal report covering October 1 – December 31, 2025.
Registered Nurse

Manages medical care and health needs.

RN Staff 25
Average shift length Info Average shift length. Calculated as total hours divided by days worked and average staff per day. 8.7 hours

This role is partially covered by contractors.

Licensed Practical Nurse

Assists with medical care and medications.

LPN Staff 36
Average shift length Info Average shift length. Calculated as total hours divided by days worked and average staff per day. 8.1 hours

This role is partially covered by contractors.

Certified Nursing Assistant

Helps with daily care and mobility.

CNA Staff 88
Average shift length Info Average shift length. Calculated as total hours divided by days worked and average staff per day. 8 hours

This role is partially covered by contractors.

Contractor staffing

Q4 2025 · Oct 1 – Dec 31 More info This data comes from the CMS Payroll-Based Journal report covering October 1 – December 31, 2025.

Total hours from contractors

2.6%

1,095 contractor hours this quarter

Certified Nursing Assistant: 25 Registered Nurse: 14 Licensed Practical Nurse: 12

Staff by category

Q4 2025 · Oct 1 – Dec 31 More info This data comes from the CMS Payroll-Based Journal report covering October 1 – December 31, 2025.
Certified Nursing Assistant63258820,40492100%8
Licensed Practical Nurse2412367,53892100%8.1
Registered Nurse1114252,57392100%8.7
Physical Therapist130132,47492100%7.2
RN Director of Nursing6061,7878087%8.5
Clinical Nurse Specialist110111,37292100%7.2
Other Dietary Services Staff9091,28292100%7.2
Physical Therapy Aide4047288896%5.7
Dietitian1014876470%7.6
Qualified Social Worker3034796874%7
Speech Language Pathologist5054686975%5.4
Respiratory Therapy Technician4044666672%6.9
Mental Health Service Worker1014265762%7.5
Administrator1014125257%7.9
Nurse Practitioner1013254246%7.7
Physical Therapy Assistant3032526470%3.9
88 Certified Nursing Assistant
% of Days 100%
36 Licensed Practical Nurse
% of Days 100%
25 Registered Nurse
% of Days 100%
13 Physical Therapist
% of Days 100%
6 RN Director of Nursing
% of Days 87%
11 Clinical Nurse Specialist
% of Days 100%
9 Other Dietary Services Staff
% of Days 100%
4 Physical Therapy Aide
% of Days 96%
1 Dietitian
% of Days 70%
3 Qualified Social Worker
% of Days 74%
5 Speech Language Pathologist
% of Days 75%
4 Respiratory Therapy Technician
% of Days 72%
1 Mental Health Service Worker
% of Days 62%
1 Administrator
% of Days 57%
1 Nurse Practitioner
% of Days 46%
3 Physical Therapy Assistant
% of Days 70%

Penalties and fines

Federal penalties imposed by CMS for regulatory violations, including civil money penalties (fines) and denials of payment for new Medicare/Medicaid admissions.

Source: CMS Penalties Database (Data as of Jan 2026)

Total fines amount $18K Rank #139 / 177Federal fines — State benchmarkedThis home is ranked 139th out of 177 homes in Tennessee. Shows this facility's cumulative CMS federal fine dollars versus the Tennessee average among facilities with fines, and where it ranks among 177 skilled nursing facilities in the pool. Lower total dollars mean a better rank.Click the rank badge to see the full State ranking.Click here to see the full State ranking.
79% lower than Tennessee average

Tennessee average: $86K

Number of fines 1
43% fewer fines than Tennessee average

Tennessee average: 1.7

Payment Denials Info Serious action where Medicare and/or Medicaid temporarily stops payments for new residents until issues are fixed. 0
100% fewer payment denials than Tennessee average

Tennessee average: 0.5

Fines amount comparison
This facility $18K
Tennessee average $86K

No penalties in the past 3 years

No civil money penalties or payment denials were reported in the last 3 years.

Quality of care over time

These measures show how residents usually do over time at this home, based on health outcomes and preventive care.

High-risk clinical events score Info A composite score based on pressure ulcers, falls with injury, weight loss, walking ability decline, and activities of daily living decline. 11.9
13% worse than Tennessee average

Tennessee average: 10.5

Functional decline score Info A composite score based on activities of daily living decline, walking ability decline, and incontinence. 26.7
37% worse than Tennessee average

Tennessee average: 19.5

Long-stay resident measures
Significantly above average Tennessee avg: 3.7 Info CMS star rating based on long-stay quality measure performance. 5 stars = significantly above average, 1 star = significantly below average.
Need for Help with Daily Activities Increased Info Percent of long-stay residents whose need for help with daily activities has increased 17.1%
7% worse than Tennessee average

Tennessee average: 16.0%

Walking Ability Worsened Info Percent of long-stay residents whose ability to move independently worsened 30.8%
42% worse than Tennessee average

Tennessee average: 21.7%

Low Risk Residents with Bowel/Bladder Incontinence Info Percent of low risk long-stay residents who lose control of their bowels or bladder 32.1%
55% worse than Tennessee average

Tennessee average: 20.7%

Falls with Major Injury Info Percent of long-stay residents experiencing one or more falls with major injury 2.9%
20% better than Tennessee average

Tennessee average: 3.7%

High Risk Residents with Pressure Ulcers Info Percent of long-stay high risk residents with pressure ulcers 1.2%
78% better than Tennessee average

Tennessee average: 5.4%

Urinary Tract Infection Info Percent of long-stay residents with a urinary tract infection 0.3%
87% better than Tennessee average

Tennessee average: 2.1%

Lost Too Much Weight Info Percent of long-stay residents who lose too much weight 7.4%
17% worse than Tennessee average

Tennessee average: 6.3%

Depressive Symptoms Info Percent of long-stay residents who have depressive symptoms 3.6%
67% better than Tennessee average

Tennessee average: 11.0%

Antipsychotic Use Info Percent of long-stay residents who received an antipsychotic medication 17.5%
6% worse than Tennessee average

Tennessee average: 16.5%

Pneumococcal Vaccine Info Percent of long-stay residents assessed and appropriately given the pneumococcal vaccine 99.7%
11% better than Tennessee average

Tennessee average: 89.9%

Influenza Vaccine Info Percent of long-stay residents assessed and appropriately given the seasonal influenza vaccine 100.0%
6% better than Tennessee average

Tennessee average: 94.5%

Hospitalizations per 1,000 days Info Number of hospitalizations per 1,000 long-stay resident days. 0.76
52% better than Tennessee average

Tennessee average: 1.58

ED visits per 1,000 days Info Number of outpatient emergency department visits per 1,000 long-stay resident days. 1.07
32% better than Tennessee average

Tennessee average: 1.57

Short-stay resident measures
Above average Tennessee avg: 3.4 Info CMS star rating based on short-stay quality measure performance. 5 stars = much above average, 1 star = much below average.
Pneumococcal Vaccine Info Percent of short-stay residents assessed and appropriately given the pneumococcal vaccine 87.3%
10% better than Tennessee average

Tennessee average: 79.7%

Antipsychotic medication increase Info Percent of short-stay residents who newly received an antipsychotic medication 0.4%
75% better than Tennessee average

Tennessee average: 1.7%

Influenza Vaccine Info Percent of short-stay residents assessed and appropriately given the seasonal influenza vaccine 83.1%
In line with Tennessee average

Tennessee average: 79.8%

Re-hospitalized after SNF stay Info Percentage of short-stay residents who were re-hospitalized after their nursing home admission. 21.6%
In line with Tennessee average

Tennessee average: 22.2%

Emergency department visits Info Percentage of short-stay residents who had an outpatient emergency department visit. 11.8%
5% worse than Tennessee average

Tennessee average: 11.2%

Falls with major injury Info Percentage of SNF residents who experience falls with major injury during their stay. 0.0%
100% better than Tennessee average

Tennessee average: 0.8%

Ability to care for self at discharge Info Percentage of residents at or above expected ability to care for themselves at discharge. 56.1%
5% better than Tennessee average

Tennessee average: 53.7%

Successful return to home or community Info Rate of successful return to home or community from a skilled nursing facility. 46.7%
8% worse than Tennessee average

Tennessee average: 50.6%

Breakdown by payment type

Medicare

41% of new residents, usually for short-term rehab.

Typical stay 29 days

Private pay

36% of new residents, often for short stays.

Typical stay 1 - 2 months

Medicaid

23% of new residents, often for long-term daily care.

Typical stay 1 years

Facility Characteristics

Source: CMS Long-Term Care Facility Characteristics (Data as of Jan 2026)

Total residents 103
Medicare
5
4.9% of residents
Medicaid
90
87.4% of residents
Private pay or other
8
7.8% of residents
Programs & Services
Residents Group

Residents meet regularly to discuss policies, care quality, and activities

Active Resident Council

Organized group of residents that meets regularly to discuss facility policies, quality of life, and activities.

Finances and operations

Privately-owned community
Operated by a business corporation.
Home revenue
$13.5M
Profit
$1.1M
Privately-owned community Operated by a business corporation.
Home revenue
$13.5M Rank #77 / 176Revenue — State benchmarkedThis home is ranked 77th out of 176 homes in Tennessee. Shows this facility's annual revenue compared to the Tennessee SNF average. Higher revenue generally means more resources for staffing and capital — read alongside Payroll %.Click the rank badge to see the full State ranking.Click here to see the full State ranking.
Profit
$1.1M
Payroll costs Info The portion of the home's budget spent on staff, including nurses, caregivers, and other employees who support care and operations. Rank #63 / 176Payroll — State benchmarkedThis home is ranked 63rd out of 176 homes in Tennessee. Shows total annual staff payroll benchmarked to the Tennessee average. Higher payroll investment relative to peers often signals better staffing and less reliance on cheaper contract labor.Click the rank badge to see the full State ranking.Click here to see the full State ranking.
$6.8M
50.4% of revenue Rank #57 / 176Payroll % — State benchmarkedThis home is ranked 57th out of 176 homes in Tennessee. Shows payroll as a percentage of revenue versus the Tennessee average. Well-run Tennessee SNFs typically land around 50–60% — the top third Statewide. Below 25% may signal understaffing or heavy agency use — read with Staffing ratings.Click the rank badge to see the full State ranking.Click here to see the full State ranking.
Other operating costs Info All remaining costs needed to run the home, such as food, utilities, building maintenance, supplies and administrative expenses.
$5.6M
Total costs $12.4M

Who this home usually serves

TYPE OF STAY

Mostly short-term rehab stays

Most residents typically stay for a few weeks or months before returning home or moving on.

Places of interest near Spring Meadows Health Care Center

Address 6.0 miles from city center Info Estimated distance in miles from Clarksville's city center to Spring Meadows Health Care Center's address, calculated via Google Maps. — 1.95 miles to nearest hospital (DaVita Clarksville Dialysis)

Calculate Travel Distance to Spring Meadows Health Care Center

Add your location

Address

Financial Assistance for
Nursing Home in Tennessee

Spring Meadows Health Care Center is located in Clarksville, Tennessee.
Here are the financial assistance programs available to residents in Tennessee.

Get Financial aid guidance

CHOICES Program

TN Medicaid CHOICES

Age 65+ or disabled
General Tennessee resident, Medicaid-eligible, nursing home-level care need.
Income Limits (2025) ~$2,829/month 300% FBR, individual
Asset Limits $2,000 (individual), $3,000 (couple).
TN

Managed care model; high rural demand.

Benefits
Personal care (5-7 hours/day) Respite (240 hours/year) Adult day care ($65/day) Home modifications ($1,500 avg.)

Tennessee Options for Community Living

TN Options

Age 60+
General Tennessee resident, at risk of nursing home.
Income Limits ~$2,000/month individual, varies
Asset Limits $5,000 individual
TN

Limited funding; rural/urban balance.

Benefits
In-home care (3-5 hours/week) Respite (up to 10 days/year) Transportation (~5 trips/month)

Medicare Savings Program (MSP)

Tennessee Medicare Savings Program

Age 65+ or disabled
General TN resident, Medicare Part A/B.
Income Limits (2025) ~$2,510/month (QMB), ~$3,380/month (SLMB), ~$3,598/month (QI)—individual.
Asset Limits $9,430 (individual), $14,130 (couple).
TN

Three tiers; includes Extra Help for Part D; no waitlist.

Benefits
Covers Part B premiums ($174.70/month) Deductibles ($240/year) Copays (~20%)

Family Caregiver Support Program (FCSP)

Tennessee Family Caregiver Support Program

Age
General Caregivers of 60+ needing care or 55+ caregivers of others; TN resident; functional needs (2+ ADLs).
Income Limits (2025) No strict cap; prioritizes low-income ~$24,980/year
Asset Limits Not assessed; need-based.
TN

Includes grandparent caregivers; high rural demand.

Benefits
Respite (4-6 hours/week or 5 days/year) Adult day care ($60/day) Training Supplies (~$500/year)

VA Aid and Attendance (A&A) and Housebound Benefits

Tennessee VA Aid and Attendance/Housebound

Age 65+ or disabled veteran/spouse
General TN resident, wartime service, need for ADL help (A&A) or homebound.
Income Limits (2025) Net income < ~$1,984/month (veteran with dependent, A&A); pension offsets income.
Asset Limits ~$155,356 net worth limit
TN

High veteran population; supports rural/urban care needs.

Benefits
Cash (~$1,433-$2,642/month veteran, ~$951-$1,318 spouse) for care costs (e.g., in-home, assisted living)

Elderly Nutrition Program

Tennessee Elderly Nutrition Program

Age 60+
General TN resident; no income limit but prioritizes low-income.
Income Limits (2025) None; donations encouraged.
Asset Limits Not assessed.
TN

Serves ~50,000 annually; 200+ congregate sites plus Meals on Wheels.

Benefits
Congregate meals ($5-$7/meal value) at senior centers Home-delivered meals ($5-$7/meal)

Property Tax Relief Program

Tennessee Property Tax Relief Program

Age 65+
General TN resident, homeowner/renter (or widow/er 50+, disabled 18+).
Income Limits (2025) ~$45,000/year household, excludes half of Social Security
Asset Limits Not assessed; income-focused.
TN

Rebates up to $1,000; serves ~100,000 annually.

Benefits
Tax rebates (~$250-$1,000 based on income; e.g., $1,000 if income < $8,000)

Compare Nursing Home around Clarksville

The information below is reported by the Tennessee Department of Health, Division of Health Care Facilities.

4 facilities compared · CMS & TN Dept. of Health data

Filter by care type
Tennessee State Veterans‘ Home – Clarksville
NH

Nursing Home Licensed facility providing 24/7 skilled nursing care for residents with complex, ongoing medical needs. Staffed by RNs, LPNs, and CNAs. Inspected and star-rated annually by CMS. Accepts Medicare (short-term rehab) and Medicaid (long-term care).

Clarksville (Arrowood Drive)108 96.7% +32%- -26%-$072.32102- 0 Tennessee State Veterans' Homes Board$15.9M$10.4M65.2%445524
Signature HealthCARE of Clarksville
NH

Nursing Home Licensed facility providing 24/7 skilled nursing care for residents with complex, ongoing medical needs. Staffed by RNs, LPNs, and CNAs. Inspected and star-rated annually by CMS. Accepts Medicare (short-term rehab) and Medicaid (long-term care).

Clarksville46 43.5% -40%3.44 +44%-5%$97.1k124.0188- 17 LP Re I Holdings LLC$15.9M$5.7M35.8%445448
AHC Clarksville
NH

Nursing Home Licensed facility providing 24/7 skilled nursing care for residents with complex, ongoing medical needs. Staffed by RNs, LPNs, and CNAs. Inspected and star-rated annually by CMS. Accepts Medicare (short-term rehab) and Medicaid (long-term care).

Clarksville113 91.7% +26%3.06 -15%-16%$0217.0-99- 21 Juanita Dufour$17.2M$5.5M31.9%445455
Spring Meadows Health Care Center
NH

Nursing Home Licensed facility providing 24/7 skilled nursing care for residents with complex, ongoing medical needs. Staffed by RNs, LPNs, and CNAs. Inspected and star-rated annually by CMS. Accepts Medicare (short-term rehab) and Medicaid (long-term care).

Clarksville32 92.6% +27%3.22 +34%-11%$18.3k234.66111A+ 22 Spring Meadows Retirement Village$13.5M$6.8M50.4%445402

Frequently Asked Questions about Spring Meadows Health Care Center

Who is the owner of Spring Meadows Health Care Center?

The legal owner and operator of Spring Meadows Health Care Center is Spring Meadows Retirement Village.

Is Spring Meadows Health Care Center in a walkable area?

Spring Meadows Health Care Center has a walk score of 22. Car-dependent. Most errands require a car, with limited nearby walkable options.

What is the license number of Spring Meadows Health Care Center?

According to TN state health department records, Spring Meadows Health Care Center's license number is 00000132.

When does Spring Meadows Health Care Center's license expire?

According to TN state health department records, Spring Meadows Health Care Center's license expires on June 30, 2000.

What is the occupancy rate at Spring Meadows Health Care Center?

Spring Meadows Health Care Center's occupancy is 100%.

Who is the administrator of Spring Meadows Health Care Center?

Shannon R. Jones is the administrator of Spring Meadows Health Care Center.

How many beds does Spring Meadows Health Care Center have?

Spring Meadows Health Care Center has 32 beds.

Guides for Better Senior Living

Care Cost Calculator: See Prices in Your Area

Nursing Home Data Explorer

Don’t Wait Too Long: 7 Red Flag Signs Your Parent Needs Assisted Living Now

The True Cost of Assisted Living in 2025 – And How Families Are Paying For It

Understanding Senior Living Costs: Pricing Models, Discounts & Financial Assistance

Explore Open Rooms
1 Contact details
2 What type of senior care service are you looking for?
3 What budget do you have in mind for senior care?
4 How soon do you need to find care?
5 Additional details

Thank you for your interest!

Our team will be in touch shortly to help with next steps.