Stoddard Baptist Nursing Home
Nursing Home, Hospice Care, Memory Care, Nursing Care & Respite Care · Washington, DC
CMS overall rating Info CMS (the Centers for Medicare & Medicaid Services) is the federal agency that rates nursing home quality. Its Overall Rating runs from 1 to 5 stars, combining health inspections, staffing, and quality measures, with inspections weighted most heavily.

Stoddard Baptist Nursing Home

Nursing Home, Hospice Care, Memory Care, Nursing Care & Respite Care · Washington, DC
CMS overall rating Info CMS (the Centers for Medicare & Medicaid Services) is the federal agency that rates nursing home quality. Its Overall Rating runs from 1 to 5 stars, combining health inspections, staffing, and quality measures, with inspections weighted most heavily.
Calculator: See prices in your area
Stoddard Baptist Nursing Home accepts Medicare, Medicaid, and private pay.

Overview of Stoddard Baptist Nursing Home

Stoddard Baptist Nursing Home, situated in Washington, D.C., is a long-term care facility providing skilled nursing services, rehabilitation, respite care, and hospice care. This nursing home facility offers a holistic approach in caring for their long-term residents by providing a comprehensive list of services and amenities. Such services include 24hr nursing care and monitoring, meal preparations, medication management, and memory care services for residents with Alzheimer’s, and dementia.

They also offer personalized assistance with daily activities, medical care, as well as engaging social activities to improve the quality of life for their elderly residents. Dedicated to fostering a sense of community and enhancing the well-being of its residents, Stoddard Baptist Nursing Home makes sure that each resident receives quality care of their residents’ mind, body, and spirit.

Quality ratings

Measured by Centers for Medicare & Medicaid Services (CMS)

Overall rating Info The Overall CMS Rating combines results from health inspections, staffing levels and quality measures. Health inspections carry the most weight. Staffing and quality scores can increase or decrease the final rating based on performance compared to state and national standards.
▼ 7.3% Below DC avg. ▼ 7.3% Below DC avg.DC average: 3.2Click the badge to see the full State ranking.Click here to see the full State ranking.
Health Inspection Info Based on the results of the facility's three most recent standard inspections and any complaint investigations. CMS reviews the number, scope, and severity of deficiencies, with more recent findings weighted more heavily.
▲ 8.5% Above DC avg. ▲ 8.5% Above DC avg.DC average: 2.8Click the badge to see the full State ranking.Click here to see the full State ranking.
Staffing Info Measures average nursing staff hours per resident per day, including Registered Nurses (RNs) and total nursing staff. Ratings are adjusted based on the level of care residents require and are compared to state and national benchmarks.
▼ 47.7% Below DC avg. ▼ 47.7% Below DC avg.DC average: 3.8Click the badge to see the full State ranking.Click here to see the full State ranking.
Quality Measures Info Based on clinical and physical health indicators reported to CMS, such as hospital readmissions, falls, pressure ulcers, and improvements in mobility. These measures reflect how well residents' health needs are being managed.
▼ 9.3% Below DC avg. ▼ 9.3% Below DC avg.DC average: 4.4Click the badge to see the full State ranking.Click here to see the full State ranking.

Staffing hours breakdown

Info Daily nursing hours per resident by staff type, reported to CMS. Higher is generally better — compare this facility to state and national averages to see where staffing stands.

Hours per resident per day — compared to District of Columbia state averages

Total nursing care / resident Info This home is ranked 9th out of 9 homes in District of Columbia for nurse hours. Total adjusted nursing hours per resident per day, combining RN, LPN, and aide time. CMS adjusts this for case-mix so facilities can be fairly compared.
2h 48m per day
Rank #9 / 9Nurse hours — State benchmarkedThis home is ranked 9th out of 9 homes in District of Columbia. Shows adjusted nurse hours per resident per day benchmarked to the District of Columbia average, with a ranking across 9 District of Columbia facilities. More hours mean more direct care. The national average is about 3.5 hrs; below 3.0 is a red flag.Rankings are based only on facilities in District of Columbia that report data for that category. Facilities without available data are excluded from the ranking.Click the rank badge to see the full State ranking.Click here to see the full State ranking.
This facility District of Columbia avg (4h 36m per day)
vs District of Columbia avg
-39%

6 of 6 metrics below state avg

Staff typeHours / Day / Residentvs state avg
Registered Nurse (RN) Info RNs hold the highest nursing license and can assess residents, interpret test results, and direct care plans. More RN hours per day often signals stronger clinical oversight and faster response to health changes. 1h 4m per day ▼ 39% State avg: 1h 45m per day · National avg: 41m per day
LPN / LVN Info Licensed Practical Nurses (LPNs) or Licensed Vocational Nurses (LVNs) deliver routine hands-on care — medication administration, wound dressing, and monitoring vital signs. They work under RN supervision and make up a large share of daily bedside care. 0m per day ▼ 100% State avg: 34m per day · National avg: 52m per day
Nurse Aide Info Certified Nurse Aides (CNAs) provide the most direct day-to-day assistance: bathing, dressing, feeding, and mobility. Nurse aide hours are typically the largest staffing category and directly affect residents' quality of life. 1h 44m per day ▼ 32% State avg: 2h 33m per day · National avg: 2h 21m per day
Weekend Total Nursing Info Combined nursing hours (RN + LPN + Nurse Aide) per resident per day on weekends. Staffing often drops on weekends — this figure reveals whether the facility maintains adequate coverage outside of weekday hours. 2h 17m per day ▼ 48% State avg: 4h 21m per day · National avg: 3h 26m per day
Physical Therapist Info Hours per resident per day provided by licensed Physical Therapists (PTs) or PT Assistants. PT services help residents recover mobility after injury or illness and are especially important for post-acute (short-stay) rehabilitation. 5m per day ▼ 13% State avg: 6m per day · National avg: 4m per day
Weekend RN Info Registered nurse hours specifically on weekends. Facilities sometimes reduce RN presence on Saturdays and Sundays — a low weekend RN figure compared to weekday hours can indicate reduced clinical oversight when most administrative staff are absent. 53m per day ▼ 36% State avg: 1h 23m per day · National avg: 29m per day

Capacity and availability

This home usually has availability

Lower occupancy than the District of Columbia average: 76.9%
Occupancy rate
56.8% Rank #8 / 9Occupancy rate — State benchmarkedThis home is ranked 8th out of 9 homes in District of Columbia. Shows this facility's occupancy rate versus the District of Columbia average, with its Statewide rank out of 9. Higher occupancy signals strong local demand and financial stability.Rankings are based only on facilities in District of Columbia that report data for that category. Facilities without available data are excluded from the ranking.Click the rank badge to see the full State ranking.Click here to see the full State ranking.
Avg. Length of Stay
211 days
Bed community size
164-bed community
A large-scale community that may provide a wide range of amenities, services, and structured programs.
Walk Score
Walk Score: 53 / 100
Moderately walkable. Some errands can be accomplished on foot, with a mix of nearby amenities.

Contact Stoddard Baptist Nursing Home

Staffing Data

Reporting period: October 1 – December 31, 2025 (Q4 2025). Source: CMS Payroll-Based Journal report.

Total staff 119
Employees 114
Contractors 5
Staff to resident ratio 1.32 : 1
9% fewer staff per resident than District of Columbia average
District of Columbia average ratio: 1.46 : 1 District of Columbia average ratio: 1.46 : 1See full District Of Columbia ranking
Avg staff/day 59
Average shift 7.6 hours
8% worse than District of Columbia average
District of Columbia average: 8.3 hours District of Columbia average shift: 8.3 hoursSee full District Of Columbia ranking
Total staff hours (quarter) 41,126

Nursing staff breakdown

Q4 2025 · Oct 1 – Dec 31 More info This data comes from the CMS Payroll-Based Journal report covering October 1 – December 31, 2025.
Registered Nurse

Manages medical care and health needs.

RN Staff Info All 7 RN Staff are full-time employees. No contractors work on this role. 7
Average shift length Info Average shift length. Calculated as total hours divided by days worked and average staff per day. 8.7 hours
Licensed Practical Nurse

Assists with medical care and medications.

LPN Staff Info No LPN Staff reported this quarter. 0
Average shift length Info Average shift length. Calculated as total hours divided by days worked and average staff per day.
Certified Nursing Assistant

Helps with daily care and mobility.

CNA Staff Info All 36 CNA Staff are full-time employees. No contractors work on this role. 36
Average shift length Info Average shift length. Calculated as total hours divided by days worked and average staff per day. 8.8 hours

Contractor staffing

Q4 2025 · Oct 1 – Dec 31 More info This data comes from the CMS Payroll-Based Journal report covering October 1 – December 31, 2025.

Total hours from contractors

3.3%

1,370 contractor hours this quarter

Respiratory Therapy Technician: 2 Physical Therapy Assistant: 2 Qualified Social Worker: 1

Staff by category

Q4 2025 · Oct 1 – Dec 31 More info This data comes from the CMS Payroll-Based Journal report covering October 1 – December 31, 2025.
Certified Nursing Assistant3603616,67092100%8.8
Occupational Therapy Aide220228,45992100%7.8
Clinical Nurse Specialist280287,12292100%9.1
Registered Nurse7072,94692100%8.7
Feeding Assistant5052,85492100%8.9
Dietitian4041,4887986%7.5
Respiratory Therapy Technician0228378390%7.4
Qualified Social Worker0114276166%7
Nurse Practitioner1012172729%8
Physical Therapy Assistant0221063235%3.3
Administrator1101107784%
36 Certified Nursing Assistant
% of Days 100%
22 Occupational Therapy Aide
% of Days 100%
28 Clinical Nurse Specialist
% of Days 100%
7 Registered Nurse
% of Days 100%
5 Feeding Assistant
% of Days 100%
4 Dietitian
% of Days 86%
2 Respiratory Therapy Technician
% of Days 90%
1 Qualified Social Worker
% of Days 66%
1 Nurse Practitioner
% of Days 29%
2 Physical Therapy Assistant
% of Days 35%
11 Administrator
% of Days 84%

Penalties and fines

Includes penalties issued in 2024-2025

Federal penalties imposed by CMS for regulatory violations, including civil money penalties (fines) and denials of payment for new Medicare/Medicaid admissions.

Source: CMS Penalties Database (Data as of Jan 2026)

Total fines amount $97K Rank #9 / 10Federal fines — State benchmarkedThis home is ranked 9th out of 10 homes in District of Columbia. Shows this facility's cumulative CMS federal fine dollars versus the District of Columbia average among facilities with fines, and where it ranks among 10 facilities in the pool. Lower total dollars mean a better rank.Rankings are based only on facilities in District of Columbia that report data for that category. Facilities without available data are excluded from the ranking.Click the rank badge to see the full State ranking.Click here to see the full State ranking.
In line with District of Columbia average

District of Columbia average: $100K

Number of fines 2
17% more fines than District of Columbia average

District of Columbia average: 1.7

Payment Denials Info Serious action where Medicare and/or Medicaid temporarily stops payments for new residents until issues are fixed. 0
100% fewer payment denials than District of Columbia average

District of Columbia average: 0.5

Fines amount comparison
This facility $97K
District of Columbia average $100K
Penalty History

Penalties are imposed by CMS for violations of federal nursing home regulations.

2 penalties in the past 3 years

Multiple penalties were reported in the last 3 years.

Civil Money Penalty Info Fines imposed for noncompliance, which can be assessed per day or per instance of violation. Apr 21, 2025
$12K
Civil Money Penalty Info Fines imposed for noncompliance, which can be assessed per day or per instance of violation. Mar 20, 2024
$85K

Last updated: Jan 2026

Quality of care over time

These measures show how residents usually do over time at this home, based on health outcomes and preventive care.

High-risk clinical events score Info A composite score based on pressure ulcers, falls with injury, weight loss, walking ability decline, and activities of daily living decline. 15.0
39% worse than District of Columbia average

District of Columbia average: 10.8

Functional decline score Info A composite score based on activities of daily living decline, walking ability decline, and incontinence. 31.1
36% worse than District of Columbia average

District of Columbia average: 22.9

Long-stay resident measures
Significantly above average Info CMS star rating based on long-stay quality measure performance. 5 stars = significantly above average, 1 star = significantly below average.
Need for Help with Daily Activities Increased Info Percent of long-stay residents whose need for help with daily activities has increased 34.4%
50% worse than District of Columbia average

District of Columbia average: 23.0%

Walking Ability Worsened Info Percent of long-stay residents whose ability to move independently worsened 32.3%
42% worse than District of Columbia average

District of Columbia average: 22.8%

Low Risk Residents with Bowel/Bladder Incontinence Info Percent of low risk long-stay residents who lose control of their bowels or bladder 26.5%
13% worse than District of Columbia average

District of Columbia average: 23.5%

Falls with Major Injury Info Percent of long-stay residents experiencing one or more falls with major injury 0.3%
76% better than District of Columbia average

District of Columbia average: 1.2%

High Risk Residents with Pressure Ulcers Info Percent of long-stay high risk residents with pressure ulcers 2.8%
66% better than District of Columbia average

District of Columbia average: 8.1%

Urinary Tract Infection Info Percent of long-stay residents with a urinary tract infection 0.9%
49% better than District of Columbia average

District of Columbia average: 1.8%

Lost Too Much Weight Info Percent of long-stay residents who lose too much weight 5.2%
13% worse than District of Columbia average

District of Columbia average: 4.6%

Depressive Symptoms Info Percent of long-stay residents who have depressive symptoms 7.6%
42% worse than District of Columbia average

District of Columbia average: 5.3%

Antipsychotic Use Info Percent of long-stay residents who received an antipsychotic medication 2.4%
67% better than District of Columbia average

District of Columbia average: 7.2%

Pneumococcal Vaccine Info Percent of long-stay residents assessed and appropriately given the pneumococcal vaccine 94.0%
In line with District of Columbia average

District of Columbia average: 90.4%

Influenza Vaccine Info Percent of long-stay residents assessed and appropriately given the seasonal influenza vaccine 100.0%
In line with District of Columbia average

District of Columbia average: 97.0%

Hospitalizations per 1,000 days Info Number of hospitalizations per 1,000 long-stay resident days. 1.63
52% worse than District of Columbia average

District of Columbia average: 1.07

ED visits per 1,000 days Info Number of outpatient emergency department visits per 1,000 long-stay resident days. 0.99
50% worse than District of Columbia average

District of Columbia average: 0.66

Short-stay resident measures
Average Info CMS star rating based on short-stay quality measure performance. 5 stars = much above average, 1 star = much below average.
Pneumococcal Vaccine Info Percent of short-stay residents assessed and appropriately given the pneumococcal vaccine 35.4%
47% worse than District of Columbia average

District of Columbia average: 66.9%

Antipsychotic medication increase Info Percent of short-stay residents who newly received an antipsychotic medication 0.0%
100% better than District of Columbia average

District of Columbia average: 0.7%

Influenza Vaccine Info Percent of short-stay residents assessed and appropriately given the seasonal influenza vaccine 52.5%
28% worse than District of Columbia average

District of Columbia average: 73.2%

Re-hospitalized after SNF stay Info Percentage of short-stay residents who were re-hospitalized after their nursing home admission. 22.8%
26% worse than District of Columbia average

District of Columbia average: 18.1%

Emergency department visits Info Percentage of short-stay residents who had an outpatient emergency department visit. 12.3%
71% worse than District of Columbia average

District of Columbia average: 7.2%

Falls with major injury Info Percentage of SNF residents who experience falls with major injury during their stay. 0.0%
100% better than District of Columbia average

District of Columbia average: 0.8%

Ability to care for self at discharge Info Percentage of residents at or above expected ability to care for themselves at discharge. 31.3%
42% worse than District of Columbia average

District of Columbia average: 53.7%

Successful return to home or community Info Rate of successful return to home or community from a skilled nursing facility. 75.2%
49% better than District of Columbia average

District of Columbia average: 50.6%

Breakdown by payment type

Medicare

49% of new residents, usually for short-term rehab.

Typical stay 1 - 2 months

Private pay

13% of new residents, often for short stays.

Typical stay 2 - 3 months

Medicaid

37% of new residents, often for long-term daily care.

Typical stay 1 - 2 years

Facility Characteristics

Source: CMS Long-Term Care Facility Characteristics (Data as of Jan 2026)

Total residents 90
Medicare
7
7.8% of residents
Medicaid
83
92.2% of residents
Programs & Services
Residents Group

Residents meet regularly to discuss policies, care quality, and activities

Active Resident Council

Organized group of residents that meets regularly to discuss facility policies, quality of life, and activities.

Finances and operations

Based on CMS SNF Cost Report for fiscal year ending in 12/2023.

Nonprofit
Nonprofit Corporation
Net patient revenue Info Net patient revenue — what the home actually collects for resident care, after contractual allowances, bad debt and discounts are subtracted from its gross charges (CMS cost report, Worksheet G-3). It covers resident care only; money the home earns from other sources is shown separately as "Other income."
$12.5M
Net patient income Info Net patient income: net patient revenue minus the home's total operating expenses. A positive figure means it earns more from resident care than it spends to deliver it; a negative figure means the opposite. It excludes non-operating "other income."
-$3.7M
Nonprofit Nonprofit Corporation
Net patient revenue Info Net patient revenue — what the home actually collects for resident care, after contractual allowances, bad debt and discounts are subtracted from its gross charges (CMS cost report, Worksheet G-3). It covers resident care only; money the home earns from other sources is shown separately as "Other income."
$12.5M Rank #8 / 9Revenue — State benchmarkedThis home is ranked 8th out of 9 homes in District of Columbia. Shows this facility's annual revenue compared to the District of Columbia average. Higher revenue generally means more resources for staffing and capital — read alongside Payroll %.Rankings are based only on facilities in District of Columbia that report data for that category. Facilities without available data are excluded from the ranking.Click the rank badge to see the full State ranking.Click here to see the full State ranking.
Net patient income Info Net patient income: net patient revenue minus the home's total operating expenses. A positive figure means it earns more from resident care than it spends to deliver it; a negative figure means the opposite. It excludes non-operating "other income."
-$3.7M
Other income Info Money the home earns outside of resident care — such as investments, grants, rentals and other non-operating sources (CMS cost report, Worksheet G-3). It is tracked separately from net patient revenue: it is not part of that figure, and it is not included in net patient income.
$3.7M
Payroll costs Info Staff salaries plus wage-related costs — benefits such as payroll taxes, health insurance and retirement — from the home's own accounting records (CMS cost report, Worksheet A). Contract or agency labor is counted separately, under other operating costs. Rank #9 / 9Payroll — State benchmarkedThis home is ranked 9th out of 9 homes in District of Columbia. Shows total annual staff payroll benchmarked to the District of Columbia average. Higher payroll investment relative to peers often signals better staffing and less reliance on cheaper contract labor.Rankings are based only on facilities in District of Columbia that report data for that category. Facilities without available data are excluded from the ranking.Click the rank badge to see the full State ranking.Click here to see the full State ranking.
$7.6M 61% of net patient revenue Info Payroll as a share of revenue: staff salaries and wage-related benefits divided by net patient revenue. A higher figure means more of each revenue dollar goes to staff pay. Rank #4 / 9Payroll % — State benchmarkedThis home is ranked 4th out of 9 homes in District of Columbia. Shows payroll as a percentage of revenue versus the District of Columbia average. Below 25% may signal understaffing or heavy agency use — read with Staffing ratings.Rankings are based only on facilities in District of Columbia that report data for that category. Facilities without available data are excluded from the ranking.Click the rank badge to see the full State ranking.Click here to see the full State ranking.
Other operating costs Info Everything it costs to run the home apart from payroll — food, utilities, supplies, maintenance, contract labor and administration. Calculated as total operating expense minus payroll (staff salaries and wage-related benefits).
$8.6M
Total costs Info The home's total operating expense for the year — all the costs of running it, salaries included (CMS cost report, Worksheet G-3).
$16.3M

Who this home usually serves

TYPE OF STAY

Mostly short-term rehab stays

Most residents typically stay for a few weeks or months before returning home or moving on.

New residents most often arrive under Medicare (49% of admissions), and a typical Medicare stay runs around 1 - 2 months.

Admissions
150 total

Coverage residents most often arrive under.

Medicare 49%
Private pay 13%
Medicaid 37%
Discharges
161 total

Coverage residents most often leave under.

Medicare 43%
Private pay 15%
Medicaid 42%

Places of interest near Stoddard Baptist Nursing Home

Address 2.5 miles from city center Info Estimated distance in miles from Washington's city center to Stoddard Baptist Nursing Home's address, calculated via Google Maps. — 2.51 miles to nearest hospital (George Washington University Hospital)

Calculate Travel Distance to Stoddard Baptist Nursing Home

Add your location

Address

Compare Nursing Homes around Washington

Stoddard Baptist Nursing Home
NH
HC
MC
NC
RC
Memory Care In Washington (Crestwood) -164 - 53 -
Ingleside at Rock Creek, a CCRC
NH
AL
HC
IL
MC
NC
Assisted Living In Washington (Northwest Washington) -34 - 42 1 Bed / 2 Bed
Knollwood Life Plan Community
NH
AL
IL
MC
NC
Assisted Living In Washington (Northwest Washington) -69 - 15 Studio / 1 Bed / 2 Bed
Carroll Manor Nursing & Rehab Center
NH
IL
MC
Independent Living In Washington (Northeast Washington) -252 - 34 -
Sibley Memorial Hosp Renaissance
NH
Nursing Homes In Washington (Northwest Washington) -45 - 26 -

Frequently Asked Questions about Stoddard Baptist Nursing Home

What neighborhood is Stoddard Baptist Nursing Home in?

Stoddard Baptist Nursing Home is in the Crestwood neighborhood.

Is Stoddard Baptist Nursing Home in a walkable area?

Stoddard Baptist Nursing Home has a walk score of 53. Moderately walkable. Some errands can be accomplished on foot, with a mix of nearby amenities.

What is the occupancy rate at Stoddard Baptist Nursing Home?

Stoddard Baptist Nursing Home's occupancy is 56.8%.

Does Stoddard Baptist Nursing Home operate as a for-profit or non-profit?

Stoddard Baptist Nursing Home is registered as a non-profit.

Are there photos of Stoddard Baptist Nursing Home?

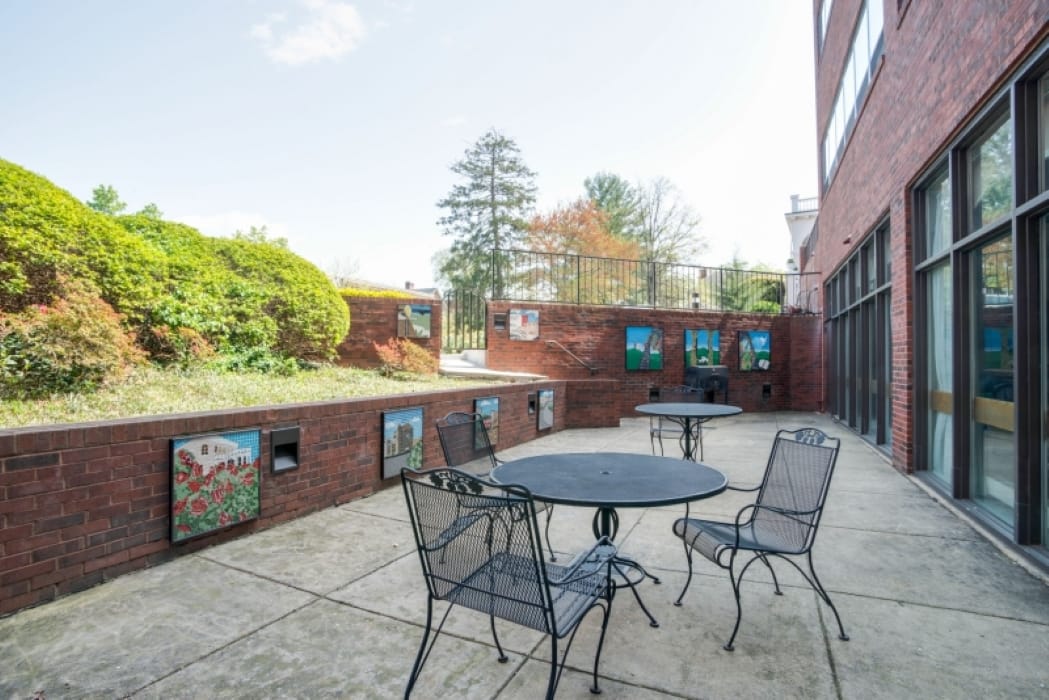
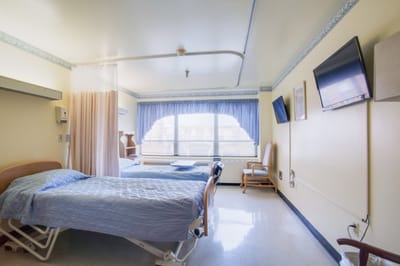
Yes — there are 4 photos of Stoddard Baptist Nursing Home in the photo gallery on this page.

What is the address of Stoddard Baptist Nursing Home?

Stoddard Baptist Nursing Home is located at 1818 Newton St Nw, Washington, DC 20010.

What is the phone number of Stoddard Baptist Nursing Home?

(202) 328-7400 will put you in contact with the team at Stoddard Baptist Nursing Home.

Guides for Better Senior Living

Care Cost Calculator: See Prices in Your Area

Nursing Home Data Explorer

Don’t Wait Too Long: 7 Red Flag Signs Your Parent Needs Assisted Living Now

The True Cost of Assisted Living in 2025 – And How Families Are Paying For It

Understanding Senior Living Costs: Pricing Models, Discounts & Financial Assistance