


Total staff
96
Employees
0
Contractors
96
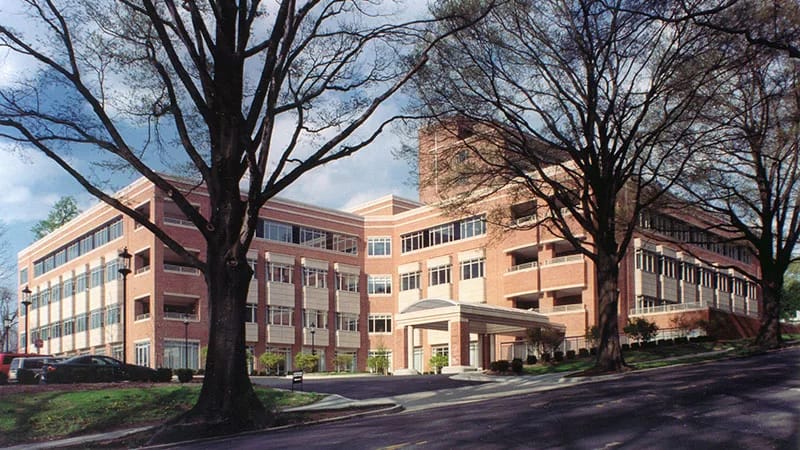
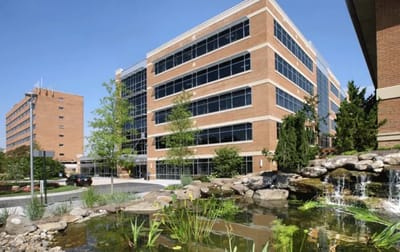
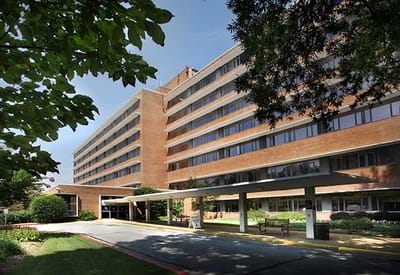
Operated as a nursing home and skilled nursing facility, Sibley Memorial Hosp Renaissance is in the Northwest D.C. neighborhood of Washington, just steps from Sibley Memorial Hospital. The facility focuses on short-term rehabilitation. It supports patients as they recover from surgery, illness, or injury before returning home or moving to a lower level of care.
The facility has 45 beds and currently serves 12 residents. It’s a smaller, more personal setting than many nursing homes in the area. This size can provide more individualized attention during a rehabilitation stay. Clinical services include physical therapy and occupational therapy, along with 24-hour supervision, medication management, and assistance with daily activities such as grooming and dressing. Meals are planned to meet each resident’s dietary needs as part of the overall care plan.
Nursing coverage is one of the facility’s notable features. Residents receive an average of about 5 hours and 46 minutes of total nursing care each day. Registered nurses provide about 3 hours and 48 minutes of that time. This level of registered nurse involvement can support closer clinical oversight during a short-term rehabilitation stay.
Sibley Memorial Hosp Renaissance accepts Medicare, Medicaid, and private pay, giving families several options for covering the cost of care. Residents can also participate in an active resident council, giving them a regular voice in facility policies and daily life.
The facility is located a few blocks from Sibley Memorial Hospital, which can be a practical advantage for residents transitioning from a hospital stay and for family members coordinating between the two locations. The neighborhood has a Walk Score of 26, which is car-dependent. Most visits and nearby errands require driving.
| Staff type | Hours / Day / Resident | vs state avg |
|---|---|---|
|
Registered Nurse (RN)
| 3h 48m per day | ▲ 117% State avg: 1h 45m per day · National avg: 41m per day |
|
LPN / LVN
| 0m per day | ▼ 100% State avg: 34m per day · National avg: 52m per day |
|
Nurse Aide
| 1h 37m per day | ▼ 37% State avg: 2h 33m per day · National avg: 2h 21m per day |
|
Weekend Total Nursing
| 4h 41m per day | ▲ 8% State avg: 4h 21m per day · National avg: 3h 26m per day |
|
Physical Therapist
| 53m per day | ▲ 788% State avg: 6m per day · National avg: 4m per day |
|
Weekend RN
| 3h 1m per day | ▲ 118% State avg: 1h 23m per day · National avg: 29m per day |
Reporting period: October 1 – December 31, 2025 (Q4 2025). Source: CMS Payroll-Based Journal report.
Manages medical care and health needs.
Assists with medical care and medications.
Helps with daily care and mobility.
Total hours from contractors
27,036 contractor hours this quarter
| Registered Nurse | 0 | 33 | 33 | 10,590 | 92 | 100% | 12.5 |
| Certified Nursing Assistant | 0 | 17 | 17 | 5,270 | 92 | 100% | 12.2 |
| Respiratory Therapy Technician | 0 | 7 | 7 | 2,906 | 65 | 71% | 7.9 |
| Physical Therapy Assistant | 0 | 9 | 9 | 2,766 | 64 | 70% | 7.6 |
| Therapeutic Recreation Specialist | 0 | 4 | 4 | 1,727 | 78 | 85% | 7.8 |
| Clinical Nurse Specialist | 0 | 3 | 3 | 1,325 | 67 | 73% | 8 |
| Qualified Social Worker | 0 | 2 | 2 | 683 | 63 | 68% | 8.1 |
| Nurse Practitioner | 0 | 2 | 2 | 520 | 58 | 63% | 9 |
| Speech Language Pathologist | 0 | 1 | 1 | 459 | 58 | 63% | 7.9 |
| Administrator | 0 | 1 | 1 | 456 | 57 | 62% | 8 |
| Physical Therapy Aide | 0 | 1 | 1 | 207 | 50 | 54% | 4.1 |
| Other Physician | 0 | 16 | 16 | 127 | 63 | 68% | 1.2 |
Includes penalties issued in 2024
Federal penalties imposed by CMS for regulatory violations, including civil money penalties (fines) and denials of payment for new Medicare/Medicaid admissions.
Source: CMS Penalties Database (Data as of Jan 2026)
District of Columbia average: $100K
District of Columbia average: 1.7
District of Columbia average: 0.5
Penalties are imposed by CMS for violations of federal nursing home regulations.
1 penalty in the past 3 years
Feb 6, 2024 · $9K
Last updated: Jan 2026
These measures show how residents usually do over time at this home, based on health outcomes and preventive care.
District of Columbia average: 66.9%
District of Columbia average: 0.7%
District of Columbia average: 73.2%
District of Columbia average: 18.1%
District of Columbia average: 7.2%
District of Columbia average: 0.8%
District of Columbia average: 53.7%
District of Columbia average: 50.6%
Quality measures are calculated from Minimum Data Set (MDS) assessments. For most measures, lower percentages indicate better care quality.
Source: CMS Long-Term Care Facility Characteristics (Data as of Jan 2026)
Residents meet regularly to discuss policies, care quality, and activities
Organized group of residents that meets regularly to discuss facility policies, quality of life, and activities.
Data sourced from CMS Long-Term Care Facility Characteristics quarterly report. Payer mix reflects the current resident census by primary payment source.
![]() 5.2 miles from city center
5.2 miles from city center
![]() Estimated distance in miles from Washington's city center to Sibley Memorial Hosp Renaissance's address, calculated via Google Maps.
— 0.03 miles to nearest hospital (Sibley Memorial Hospital)
Estimated distance in miles from Washington's city center to Sibley Memorial Hosp Renaissance's address, calculated via Google Maps.
— 0.03 miles to nearest hospital (Sibley Memorial Hospital)
Add your location
Info below is compiled from CMS reports & the DC Dept. of Health, senior community websites & trusted data sources such as Walk Score & BBB.
Communities are listed from highest to lowest based on our ranking methodology.
| Lisner-Louise-Dickson-Hurt-Home | NH AL RESC SNF | Washington (Northwest D.C) | 60 |
90.5%
Facility
90.5%
DC AVG
80.6
Rank
#4 / 10 | +12% | 5.04
Facility
5.04
DC AVG
4.60
Rank
#4 / 9 | -6% | +10% | $0
Facility
$0
DC AVG
$118.4k
Rank
#1 / 10 | 25
Facility
25
DC AVG
63.1
Rank
#1 / 10 | 5.0
Facility
5.0
DC AVG
11.1
Rank
#1 / 10 | - | 54 | - | 91 | Jonathan Plater | $8.0MFiscal year ending 06/2024
Facility
$8.0MFiscal year ending 06/2024
DC AVG
$34.0M
Rank
#7 / 9 | $8.9MFiscal year ending 06/2024
Facility
$8.9MFiscal year ending 06/2024
DC AVG
$11.6M
Rank
#7 / 9 | 111.1%Fiscal year ending 06/2024
Facility
111.1%Fiscal year ending 06/2024
DC AVG
39.8%
Rank
#5 / 9 | 95025 | ||||
| Ingleside at Rock Creek, a CCRC | NH AL HC IL MC SNF | Washington (Northwest D.C) | 34 |
87.1%
Facility
87.1%
DC AVG
80.6
Rank
#5 / 10 | +8% | 5.52
Facility
5.52
DC AVG
4.60
Rank
#2 / 9 | +22% | +20% | $39.4k
Facility
$39.4k
DC AVG
$118.4k
Rank
#7 / 10 | 42
Facility
42
DC AVG
63.1
Rank
#5 / 10 | 14.0
Facility
14.0
DC AVG
11.1
Rank
#8 / 10 | 1 | 30 | - | 42 | Bruce Bartels | $34.3MFiscal year ending 12/2023
Facility
$34.3MFiscal year ending 12/2023
DC AVG
$34.0M
Rank
#3 / 9 | $13.1MFiscal year ending 12/2023
Facility
$13.1MFiscal year ending 12/2023
DC AVG
$11.6M
Rank
#4 / 9 | 38.2%Fiscal year ending 12/2023
Facility
38.2%Fiscal year ending 12/2023
DC AVG
39.8%
Rank
#9 / 9 | 95028 | ||||
| Sibley Memorial Hosp Renaissance | NH SNF | Washington (Northwest D.C) | 45 |
79.1%
Facility
79.1%
DC AVG
80.6
Rank
#6 / 10 | -2% | 5.77
Facility
5.77
DC AVG
4.60
Rank
#1 / 9 | +70% | +25% | $8.8k
Facility
$8.8k
DC AVG
$118.4k
Rank
#3 / 10 | 34
Facility
34
DC AVG
63.1
Rank
#2 / 10 | 6.8
Facility
6.8
DC AVG
11.1
Rank
#2 / 10 | 2 | 36 | - | 26 | - | - | - | - | 95030 | ||||
| Forest Hills of DC | NH AL MC RC SNF | Washington (Northwest D.C) | 55 |
93.3%
Facility
93.3%
DC AVG
80.6
Rank
#3 / 10 | +16% | 4.69
Facility
4.69
DC AVG
4.60
Rank
#5 / 9 | +10% | +2% | $9.3k
Facility
$9.3k
DC AVG
$118.4k
Rank
#4 / 10 | 40
Facility
40
DC AVG
63.1
Rank
#4 / 10 | 10.0
Facility
10.0
DC AVG
11.1
Rank
#4 / 10 | 1 | 51 | - | 79 | Scott Taylor | $14.5MFiscal year ending 12/2023
Facility
$14.5MFiscal year ending 12/2023
DC AVG
$34.0M
Rank
#9 / 9 | $7.7MFiscal year ending 12/2023
Facility
$7.7MFiscal year ending 12/2023
DC AVG
$11.6M
Rank
#8 / 9 | 53.4%Fiscal year ending 12/2023
Facility
53.4%Fiscal year ending 12/2023
DC AVG
39.8%
Rank
#2 / 9 | 95038 | ||||
| Knollwood Life Plan Community | NH AL IL MC SNF | Washington (Northwest D.C) | 69 |
54.8%
Facility
54.8%
DC AVG
80.6
Rank
#10 / 10 | -32% | - | -4% | - | $0
Facility
$0
DC AVG
$118.4k
Rank
#1 / 10 | 39
Facility
39
DC AVG
63.1
Rank
#3 / 10 | 7.8
Facility
7.8
DC AVG
11.1
Rank
#3 / 10 | 3 | 38 | - | 15 | Sonja Brooks | $20.5MFiscal year ending 12/2023
Facility
$20.5MFiscal year ending 12/2023
DC AVG
$34.0M
Rank
#6 / 9 | $11.9MFiscal year ending 12/2023
Facility
$11.9MFiscal year ending 12/2023
DC AVG
$11.6M
Rank
#6 / 9 | 57.9%Fiscal year ending 12/2023
Facility
57.9%Fiscal year ending 12/2023
DC AVG
39.8%
Rank
#3 / 9 | 95026 |
Sibley Memorial Hosp Renaissance is in the Northwest D.C. neighborhood.
Sibley Memorial Hosp Renaissance has a walk score of 26. Somewhat walkable. A few nearby services may be reachable on foot, but most trips require transportation.
No, Sibley Memorial Hosp Renaissance has a no-pet policy.
Sibley Memorial Hosp Renaissance is registered as a non-profit.
Yes — there are 3 photos of Sibley Memorial Hosp Renaissance in the photo gallery on this page.
Sibley Memorial Hosp Renaissance is located at 5255 Loughboro Rd Nw, Washington, DC 20016.
(202) 537-4000 will put you in contact with the team at Sibley Memorial Hosp Renaissance.
Care Cost Calculator: See Prices in Your Area
Nursing Home Data Explorer
Don’t Wait Too Long: 7 Red Flag Signs Your Parent Needs Assisted Living Now
The True Cost of Assisted Living in 2025 – And How Families Are Paying For It
Understanding Senior Living Costs: Pricing Models, Discounts & Financial Assistance


