Knollwood Life Plan Community
Nursing Home, Assisted Living, Independent Living, Memory Care & Nursing Care · Washington, DC
CMS overall rating Info CMS (the Centers for Medicare & Medicaid Services) is the federal agency that rates nursing home quality. Its Overall Rating runs from 1 to 5 stars, combining health inspections, staffing, and quality measures, with inspections weighted most heavily.

Knollwood Life Plan Community

Nursing Home, Assisted Living, Independent Living, Memory Care & Nursing Care · Washington, DC
CMS overall rating Info CMS (the Centers for Medicare & Medicaid Services) is the federal agency that rates nursing home quality. Its Overall Rating runs from 1 to 5 stars, combining health inspections, staffing, and quality measures, with inspections weighted most heavily.
Calculator: See prices in your area
Knollwood Life Plan Community accepts Medicare, Medicaid, and private pay.

Overview of Knollwood Life Plan Community

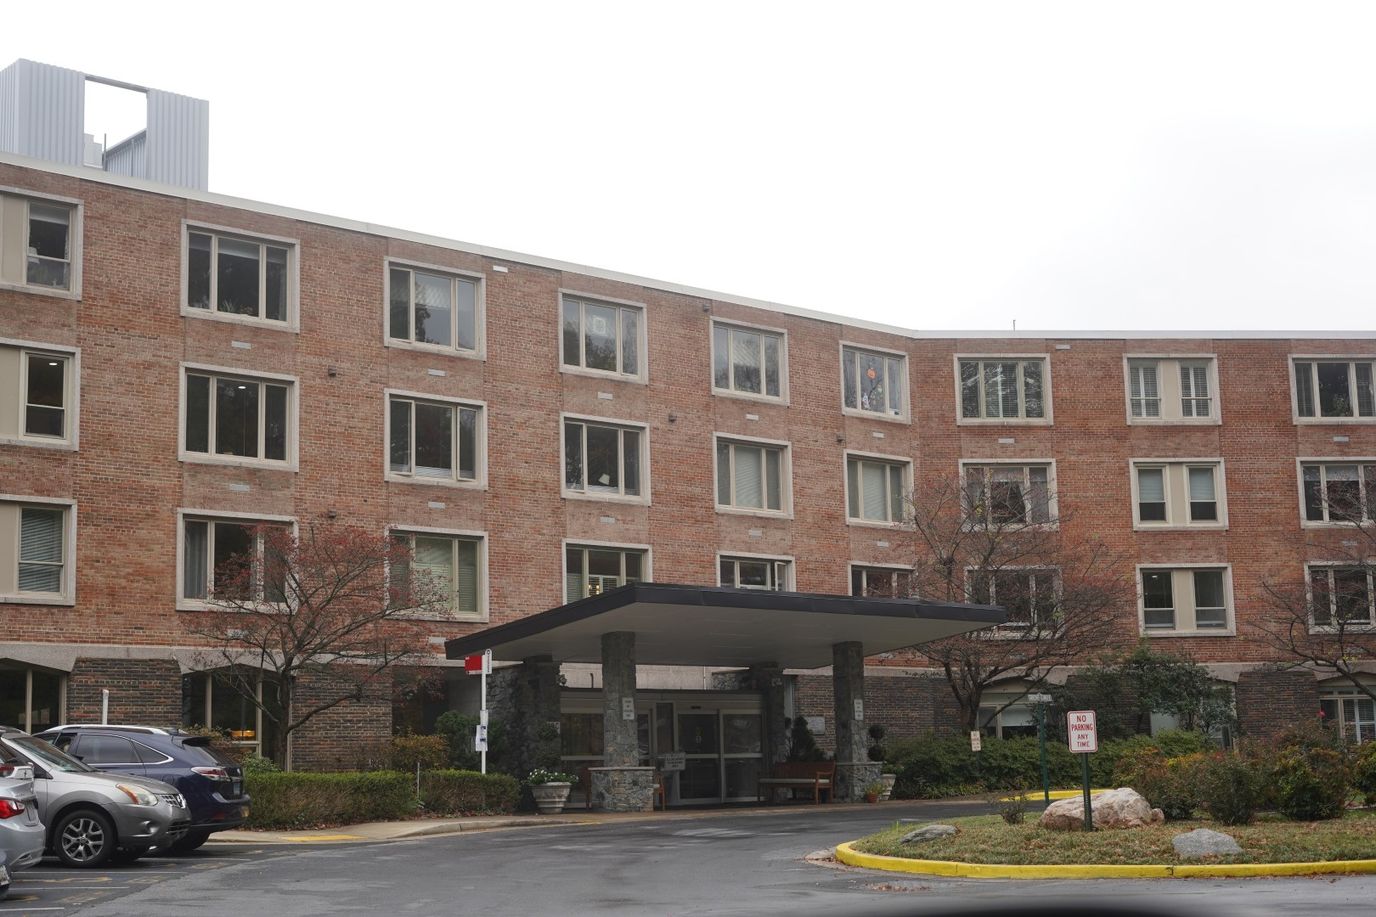
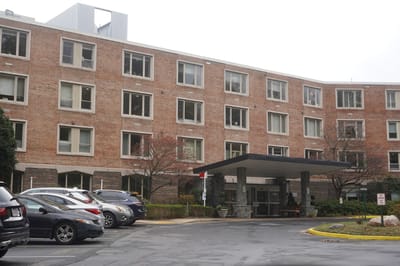
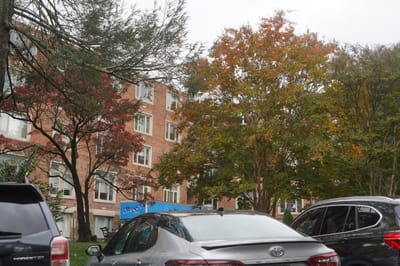
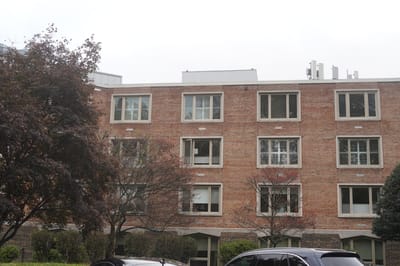
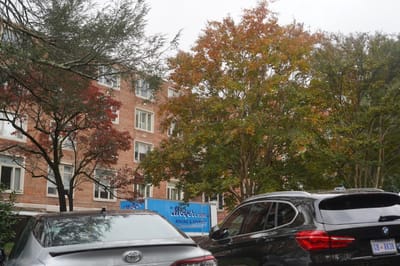
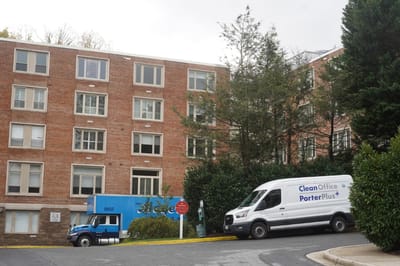
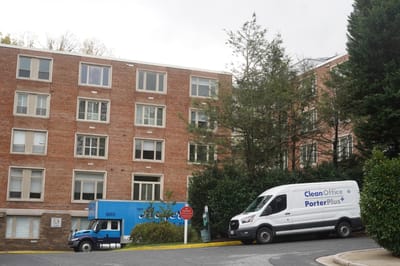
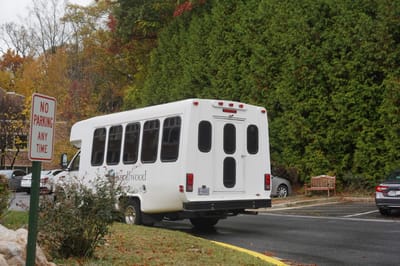
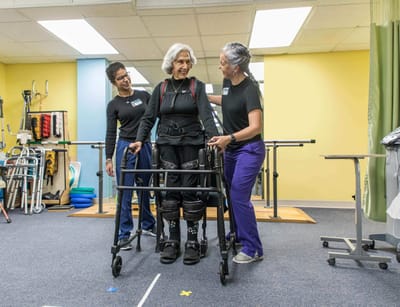
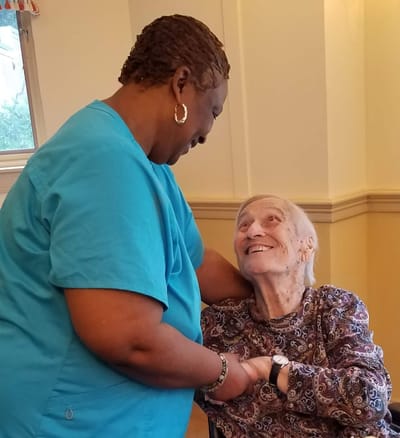
Knollwood Life Plan Community is an exceptional life plan community in Washington, D.C., that offers comprehensive care options, including independent living, assisted living, memory support, and rehabilitation. With its tight-knit environment, the community strives to provide older adults with comfortable and secure residences. 24-hour care, social programs, and therapeutic services are also offered for reisdents’ holistic wellness. Utilizing innovative solutions, the community goes above and beyond to enrich residents’ living experiences.

Stimulating activities are conducted to improve the cognition of those with memory loss, as well as recreational opportunities to help them connect with peers. A spa whirlpool baths, scenic pathways, and a community vegetable garden are just some of the community’s unique features, dedicated for residents’ leisure and wellness. Surrounded by lush trees and serene green spaces, residents here are guaranteed a relaxing retirement. This senior living community is one of Washington’s finest retirement communities, as reflected on its high-quality services and wide range of amenities.

Quality ratings

Measured by Centers for Medicare & Medicaid Services (CMS)

Overall rating Info The Overall CMS Rating combines results from health inspections, staffing levels and quality measures. Health inspections carry the most weight. Staffing and quality scores can increase or decrease the final rating based on performance compared to state and national standards.
▲ 23.6% Above DC avg. ▲ 23.6% Above DC avg.DC average: 3.2Click the badge to see the full State ranking.Click here to see the full State ranking.
Health Inspection Info Based on the results of the facility's three most recent standard inspections and any complaint investigations. CMS reviews the number, scope, and severity of deficiencies, with more recent findings weighted more heavily.
▲ 8.5% Above DC avg. ▲ 8.5% Above DC avg.DC average: 2.8Click the badge to see the full State ranking.Click here to see the full State ranking.
Staffing Info Measures average nursing staff hours per resident per day, including Registered Nurses (RNs) and total nursing staff. Ratings are adjusted based on the level of care residents require and are compared to state and national benchmarks.
▲ 4.6% Above DC avg. ▲ 4.6% Above DC avg.DC average: 3.8Click the badge to see the full State ranking.Click here to see the full State ranking.
Quality Measures Info Based on clinical and physical health indicators reported to CMS, such as hospital readmissions, falls, pressure ulcers, and improvements in mobility. These measures reflect how well residents' health needs are being managed.
▲ 13.3% Above DC avg. ▲ 13.3% Above DC avg.DC average: 4.4Click the badge to see the full State ranking.Click here to see the full State ranking.

Staffing hours breakdown

Info Daily nursing hours per resident by staff type, reported to CMS. Higher is generally better — compare this facility to state and national averages to see where staffing stands.

Hours per resident per day — compared to District of Columbia state averages

Staff typeHours / Day / Residentvs state avg
Registered Nurse (RN) Info RNs hold the highest nursing license and can assess residents, interpret test results, and direct care plans. More RN hours per day often signals stronger clinical oversight and faster response to health changes. 1h 47m per day ▼ 6% State avg: 1h 54m per day · National avg: 41m per day
LPN / LVN Info Licensed Practical Nurses (LPNs) or Licensed Vocational Nurses (LVNs) deliver routine hands-on care — medication administration, wound dressing, and monitoring vital signs. They work under RN supervision and make up a large share of daily bedside care. 1h 9m per day ▲ 58% State avg: 44m per day · National avg: 52m per day
Nurse Aide Info Certified Nurse Aides (CNAs) provide the most direct day-to-day assistance: bathing, dressing, feeding, and mobility. Nurse aide hours are typically the largest staffing category and directly affect residents' quality of life. 3h 31m per day ▲ 33% State avg: 2h 38m per day · National avg: 2h 20m per day
Weekend Total Nursing Info Combined nursing hours (RN + LPN + Nurse Aide) per resident per day on weekends. Staffing often drops on weekends — this figure reveals whether the facility maintains adequate coverage outside of weekday hours. 5h 26m per day ▲ 16% State avg: 4h 41m per day · National avg: 3h 27m per day
Physical Therapist Info Hours per resident per day provided by licensed Physical Therapists (PTs) or PT Assistants. PT services help residents recover mobility after injury or illness and are especially important for post-acute (short-stay) rehabilitation. 14m per day ▲ 76% State avg: 8m per day · National avg: 4m per day
Weekend RN Info Registered nurse hours specifically on weekends. Facilities sometimes reduce RN presence on Saturdays and Sundays — a low weekend RN figure compared to weekday hours can indicate reduced clinical oversight when most administrative staff are absent. 1h 0m per day ▼ 36% State avg: 1h 34m per day · National avg: 29m per day

Capacity and availability

This home usually has availability

Higher occupancy than the District of Columbia average: 76.9%
Occupancy rate
77.9% Rank #5 / 9Occupancy rate — State benchmarkedThis home is ranked 5th out of 9 homes in District of Columbia. Shows this facility's occupancy rate versus the District of Columbia average, with its Statewide rank out of 9. Higher occupancy signals strong local demand and financial stability.Rankings are based only on facilities in District of Columbia that report data for that category. Facilities without available data are excluded from the ranking.Click the rank badge to see the full State ranking.Click here to see the full State ranking.
Avg. Length of Stay
348 days
Bed community size
69-bed community
A moderately sized community that may balance personal attention with shared amenities and social activities.
Walk Score
Walk Score: 15 / 100
Car-dependent. Most errands require a car, with limited nearby walkable options.

Therapy & Rehabilitation

3 services
Rehabilitation Services
Respite Care
Short-Term Rehab

Additional Services

1 service
Memory Support

Amenities & Lifestyle

Specific ProgramsWellness & Fitness, Events & Social Life, Milestones

Contact Knollwood Life Plan Community

Staffing Data

Reporting period: October 1 – December 31, 2025 (Q4 2025). Source: CMS Payroll-Based Journal report.

Total staff 82
Employees 72
Contractors 10
Staff to resident ratio 1.86 : 1
28% more staff per resident than District of Columbia average
District of Columbia average ratio: 1.46 : 1 District of Columbia average ratio: 1.46 : 1See full District Of Columbia ranking
Avg staff/day 37
Average shift 7.7 hours
7% worse than District of Columbia average
District of Columbia average: 8.3 hours District of Columbia average shift: 8.3 hoursSee full District Of Columbia ranking
Total staff hours (quarter) 26,068

Nursing staff breakdown

Q4 2025 · Oct 1 – Dec 31 More info This data comes from the CMS Payroll-Based Journal report covering October 1 – December 31, 2025.
Registered Nurse

Manages medical care and health needs.

RN Staff Info All 16 RN Staff are full-time employees. No contractors work on this role. 16
Average shift length Info Average shift length. Calculated as total hours divided by days worked and average staff per day. 7.6 hours
Licensed Practical Nurse

Assists with medical care and medications.

LPN Staff Info All 11 LPN Staff are full-time employees. No contractors work on this role. 11
Average shift length Info Average shift length. Calculated as total hours divided by days worked and average staff per day. 8.4 hours
Certified Nursing Assistant

Helps with daily care and mobility.

CNA Staff Info All 30 CNA Staff are full-time employees. No contractors work on this role. 30
Average shift length Info Average shift length. Calculated as total hours divided by days worked and average staff per day. 7.9 hours

Contractor staffing

Q4 2025 · Oct 1 – Dec 31 More info This data comes from the CMS Payroll-Based Journal report covering October 1 – December 31, 2025.

Total hours from contractors

8.6%

2,248 contractor hours this quarter

Physical Therapy Assistant: 4 Respiratory Therapy Technician: 2 Occupational Therapy Aide: 1 Qualified Social Worker: 1 Occupational Therapy Assistant: 1 Medical Director: 1

Staff by category

Q4 2025 · Oct 1 – Dec 31 More info This data comes from the CMS Payroll-Based Journal report covering October 1 – December 31, 2025.
Certified Nursing Assistant300309,82992100%7.9
Registered Nurse160165,66992100%7.6
Licensed Practical Nurse110113,99992100%8.4
Nurse Aide in Training110112,3819098%7.3
Respiratory Therapy Technician0227857885%6.8
Physical Therapy Assistant0447457278%6
Administrator1014966267%8
Nurse Practitioner1014966267%8
Mental Health Service Worker1014886166%8
Other Dietary Services Staff1014636368%7.3
Occupational Therapy Aide0113236267%5.2
Qualified Social Worker0112906166%4.8
Medical Director011921516%6.1
Occupational Therapy Assistant0111333%4.3
30 Certified Nursing Assistant
% of Days 100%
16 Registered Nurse
% of Days 100%
11 Licensed Practical Nurse
% of Days 100%
11 Nurse Aide in Training
% of Days 98%
2 Respiratory Therapy Technician
% of Days 85%
4 Physical Therapy Assistant
% of Days 78%
1 Administrator
% of Days 67%
1 Nurse Practitioner
% of Days 67%
1 Mental Health Service Worker
% of Days 66%
1 Other Dietary Services Staff
% of Days 68%
1 Occupational Therapy Aide
% of Days 67%
1 Qualified Social Worker
% of Days 66%
1 Medical Director
% of Days 16%
1 Occupational Therapy Assistant
% of Days 3%

Penalties and fines

Federal penalties imposed by CMS for regulatory violations, including civil money penalties (fines) and denials of payment for new Medicare/Medicaid admissions.

Source: CMS Penalties Database (Data as of Jan 2026)

Total fines amount $0 Rank #1 / 10Federal fines — State benchmarkedThis home is ranked 1st out of 10 homes in District of Columbia. Shows this facility's cumulative CMS federal fine dollars versus the District of Columbia average among facilities with fines, and where it ranks among 10 facilities in the pool. Lower total dollars mean a better rank.Rankings are based only on facilities in District of Columbia that report data for that category. Facilities without available data are excluded from the ranking.Click the rank badge to see the full State ranking.Click here to see the full State ranking.
100% lower than District of Columbia average

District of Columbia average: $100K

Number of fines 0
100% fewer fines than District of Columbia average

District of Columbia average: 1.7

Payment Denials Info Serious action where Medicare and/or Medicaid temporarily stops payments for new residents until issues are fixed. 1
100% more payment denials than District of Columbia average

District of Columbia average: 0.5

Fines amount comparison
This facility $0
District of Columbia average $100K

No penalties in the past 3 years

No civil money penalties or payment denials were reported in the last 3 years.

Quality of care over time

These measures show how residents usually do over time at this home, based on health outcomes and preventive care.

High-risk clinical events score Info A composite score based on pressure ulcers, falls with injury, weight loss, walking ability decline, and activities of daily living decline. 17.9
66% worse than District of Columbia average

District of Columbia average: 10.8

Functional decline score Info A composite score based on activities of daily living decline, walking ability decline, and incontinence. 31.9
39% worse than District of Columbia average

District of Columbia average: 22.9

Long-stay resident measures
Need for Help with Daily Activities Increased Info Percent of long-stay residents whose need for help with daily activities has increased 39.1%
70% worse than District of Columbia average

District of Columbia average: 23.0%

Walking Ability Worsened Info Percent of long-stay residents whose ability to move independently worsened 39.3%
72% worse than District of Columbia average

District of Columbia average: 22.8%

Low Risk Residents with Bowel/Bladder Incontinence Info Percent of low risk long-stay residents who lose control of their bowels or bladder 17.1%
27% better than District of Columbia average

District of Columbia average: 23.5%

Falls with Major Injury Info Percent of long-stay residents experiencing one or more falls with major injury 2.3%
91% worse than District of Columbia average

District of Columbia average: 1.2%

High Risk Residents with Pressure Ulcers Info Percent of long-stay high risk residents with pressure ulcers 5.3%
35% better than District of Columbia average

District of Columbia average: 8.1%

Urinary Tract Infection Info Percent of long-stay residents with a urinary tract infection 3.1%
74% worse than District of Columbia average

District of Columbia average: 1.8%

Lost Too Much Weight Info Percent of long-stay residents who lose too much weight 3.7%
21% better than District of Columbia average

District of Columbia average: 4.6%

Depressive Symptoms Info Percent of long-stay residents who have depressive symptoms 1.6%
70% better than District of Columbia average

District of Columbia average: 5.3%

Antipsychotic Use Info Percent of long-stay residents who received an antipsychotic medication 9.4%
30% worse than District of Columbia average

District of Columbia average: 7.2%

Pneumococcal Vaccine Info Percent of long-stay residents assessed and appropriately given the pneumococcal vaccine 94.7%
5% better than District of Columbia average

District of Columbia average: 90.4%

Influenza Vaccine Info Percent of long-stay residents assessed and appropriately given the seasonal influenza vaccine 100.0%
In line with District of Columbia average

District of Columbia average: 97.0%

Short-stay resident measures
Pneumococcal Vaccine Info Percent of short-stay residents assessed and appropriately given the pneumococcal vaccine 76.6%
15% better than District of Columbia average

District of Columbia average: 66.9%

Antipsychotic medication increase Info Percent of short-stay residents who newly received an antipsychotic medication 0.0%
100% better than District of Columbia average

District of Columbia average: 0.7%

Influenza Vaccine Info Percent of short-stay residents assessed and appropriately given the seasonal influenza vaccine 82.1%
12% better than District of Columbia average

District of Columbia average: 73.2%

Breakdown by payment type

Medicare

75% of new residents, usually for short-term rehab.

Typical stay 29 days

Private pay

19% of new residents, often for short stays.

Typical stay 9 years

Medicaid

6% of new residents, often for long-term daily care.

Typical stay 8 years

Facility Characteristics

Source: CMS Long-Term Care Facility Characteristics (Data as of Jan 2026)

Total residents 44
Medicare
3
6.8% of residents
Medicaid
21
47.7% of residents
Private pay or other
20
45.5% of residents
Programs & Services
Residents Group

Residents meet regularly to discuss policies, care quality, and activities

Family Member Group

Family members meet regularly to discuss policies, care quality, and activities

CCRC

Part of a Continuing Care Retirement Community offering multiple care levels

Active Family Council

Organized group of family members that meets regularly to discuss facility policies, resident care, and activities.

Active Resident Council

Organized group of residents that meets regularly to discuss facility policies, quality of life, and activities.

Finances and operations

Based on CMS SNF Cost Report for fiscal year ending in 12/2023.

Nonprofit
Nonprofit Corporation
Net patient revenue Info Net patient revenue — what the home actually collects for resident care, after contractual allowances, bad debt and discounts are subtracted from its gross charges (CMS cost report, Worksheet G-3). It covers resident care only; money the home earns from other sources is shown separately as "Other income."
$20.5M
Net patient income Info Net patient income: net patient revenue minus the home's total operating expenses. A positive figure means it earns more from resident care than it spends to deliver it; a negative figure means the opposite. It excludes non-operating "other income."
-$5.7M
Nonprofit Nonprofit Corporation
Net patient revenue Info Net patient revenue — what the home actually collects for resident care, after contractual allowances, bad debt and discounts are subtracted from its gross charges (CMS cost report, Worksheet G-3). It covers resident care only; money the home earns from other sources is shown separately as "Other income."
$20.5M Rank #6 / 9Revenue — State benchmarkedThis home is ranked 6th out of 9 homes in District of Columbia. Shows this facility's annual revenue compared to the District of Columbia average. Higher revenue generally means more resources for staffing and capital — read alongside Payroll %.Rankings are based only on facilities in District of Columbia that report data for that category. Facilities without available data are excluded from the ranking.Click the rank badge to see the full State ranking.Click here to see the full State ranking.
Net patient income Info Net patient income: net patient revenue minus the home's total operating expenses. A positive figure means it earns more from resident care than it spends to deliver it; a negative figure means the opposite. It excludes non-operating "other income."
-$5.7M
Other income Info Money the home earns outside of resident care — such as investments, grants, rentals and other non-operating sources (CMS cost report, Worksheet G-3). It is tracked separately from net patient revenue: it is not part of that figure, and it is not included in net patient income.
$4.3M
Payroll costs Info Staff salaries plus wage-related costs — benefits such as payroll taxes, health insurance and retirement — from the home's own accounting records (CMS cost report, Worksheet A). Contract or agency labor is counted separately, under other operating costs. Rank #6 / 9Payroll — State benchmarkedThis home is ranked 6th out of 9 homes in District of Columbia. Shows total annual staff payroll benchmarked to the District of Columbia average. Higher payroll investment relative to peers often signals better staffing and less reliance on cheaper contract labor.Rankings are based only on facilities in District of Columbia that report data for that category. Facilities without available data are excluded from the ranking.Click the rank badge to see the full State ranking.Click here to see the full State ranking.
$11.9M 57.9% of net patient revenue Info Payroll as a share of revenue: staff salaries and wage-related benefits divided by net patient revenue. A higher figure means more of each revenue dollar goes to staff pay. Rank #3 / 9Payroll % — State benchmarkedThis home is ranked 3rd out of 9 homes in District of Columbia. Shows payroll as a percentage of revenue versus the District of Columbia average. Below 25% may signal understaffing or heavy agency use — read with Staffing ratings.Rankings are based only on facilities in District of Columbia that report data for that category. Facilities without available data are excluded from the ranking.Click the rank badge to see the full State ranking.Click here to see the full State ranking.
Other operating costs Info Everything it costs to run the home apart from payroll — food, utilities, supplies, maintenance, contract labor and administration. Calculated as total operating expense minus payroll (staff salaries and wage-related benefits).
$14.3M
Total costs Info The home's total operating expense for the year — all the costs of running it, salaries included (CMS cost report, Worksheet G-3).
$26.2M

What does this home offer?

Minimum age icon
Minimum age icon

Minimum Age: 62 Years Old

Housing options icon

Housing Options: Studio / 1 Bed / 2 Bed

Building type icon
Building type icon

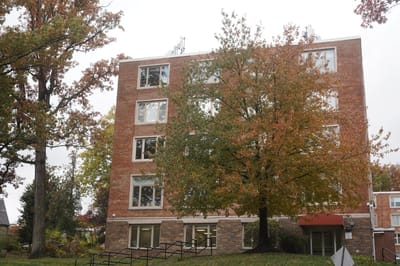
Building Type: Mid-rise

Beauty services icon

Beauty Services

Housekeeping icon
Housekeeping icon

Housekeeping Services

Social and recreational activities icon

Social and Recreational Activities

On-site medical care and health services icon

On-site Medical Care and Health Services

Swimming pool icon
Swimming pool icon

Swimming Pool

Exercise program icon

Exercise Programs

Who this home usually serves

TYPE OF STAY

Mostly short-term rehab stays

Most residents typically stay for a few weeks or months before returning home or moving on.

Most new residents arrive under Medicare (75% of admissions), and a typical Medicare stay runs around 29 days.

Admissions
32 total

Coverage residents most often arrive under.

Medicare 75%
Private pay 19%
Medicaid 6%
Discharges
91 total

Coverage residents most often leave under.

Medicare 52%
Private pay 26%
Medicaid 22%

Places of interest near Knollwood Life Plan Community

Address 4.5 miles from city center Info Estimated distance in miles from Washington's city center to Knollwood Life Plan Community's address, calculated via Google Maps.

Calculate Travel Distance to Knollwood Life Plan Community

Add your location

Address

Compare Nursing Homes around Washington

Knollwood Life Plan Community
NH
AL
IL
MC
NC
Assisted Living In Washington (Northwest Washington) -69 - 15 Studio / 1 Bed / 2 Bed
Ingleside at Rock Creek, a CCRC
NH
AL
HC
IL
MC
NC
Assisted Living In Washington (Northwest Washington) -34 - 42 1 Bed / 2 Bed
Carroll Manor Nursing & Rehab Center
NH
IL
MC
Independent Living In Washington (Northeast Washington) -252 - 34 -
Sibley Memorial Hosp Renaissance
NH
Nursing Homes In Washington (Northwest Washington) -45 - 26 -
Lisner-Louise-Dickson-Hurt-Home
NH
AL
NC
RC
Assisted Living In Washington (Northwest Washington) -60 - 91 -

Frequently Asked Questions about Knollwood Life Plan Community

What neighborhood is Knollwood Life Plan Community in?

Knollwood Life Plan Community is in the Northwest Washington neighborhood.

Is Knollwood Life Plan Community in a walkable area?

Knollwood Life Plan Community has a walk score of 15. Car-dependent. Most errands require a car, with limited nearby walkable options.

What is the occupancy rate at Knollwood Life Plan Community?

Knollwood Life Plan Community's occupancy is 77.9%.

Does Knollwood Life Plan Community operate as a for-profit or non-profit?

Knollwood Life Plan Community is registered as a non-profit.

Are there photos of Knollwood Life Plan Community?

Yes — there are 26 photos of Knollwood Life Plan Community in the photo gallery on this page.

What is the address of Knollwood Life Plan Community?

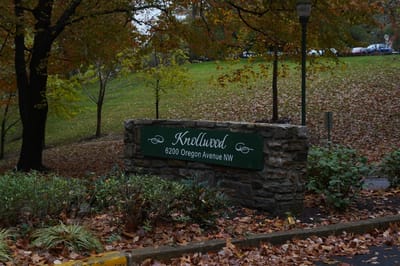
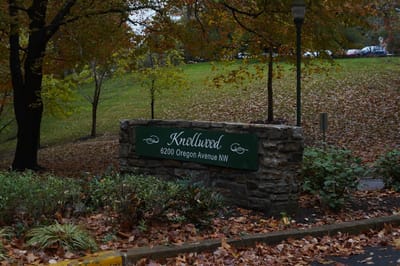
Knollwood Life Plan Community is located at 6200 Oregon Ave Nw, Washington, DC 20015.

What is the phone number of Knollwood Life Plan Community?

(202) 541-0149 will put you in contact with the team at Knollwood Life Plan Community.

Guides for Better Senior Living

Care Cost Calculator: See Prices in Your Area

Nursing Home Data Explorer

Don’t Wait Too Long: 7 Red Flag Signs Your Parent Needs Assisted Living Now

The True Cost of Assisted Living in 2025 – And How Families Are Paying For It

Understanding Senior Living Costs: Pricing Models, Discounts & Financial Assistance