Ingleside at Rock Creek, a CCRC
Nursing Home, Assisted Living, Home Care, Independent Living, Memory Care & Nursing Care · Washington, DC
CMS overall rating Info CMS (the Centers for Medicare & Medicaid Services) is the federal agency that rates nursing home quality. Its Overall Rating runs from 1 to 5 stars, combining health inspections, staffing, and quality measures, with inspections weighted most heavily.

Ingleside at Rock Creek, a CCRC

Nursing Home, Assisted Living, Home Care, Independent Living, Memory Care & Nursing Care · Washington, DC
CMS overall rating Info CMS (the Centers for Medicare & Medicaid Services) is the federal agency that rates nursing home quality. Its Overall Rating runs from 1 to 5 stars, combining health inspections, staffing, and quality measures, with inspections weighted most heavily.
Calculator: See prices in your area
Ingleside at Rock Creek, a CCRC accepts Medicare, Medicaid, and private pay.

Overview of Ingleside at Rock Creek, a Ccrc

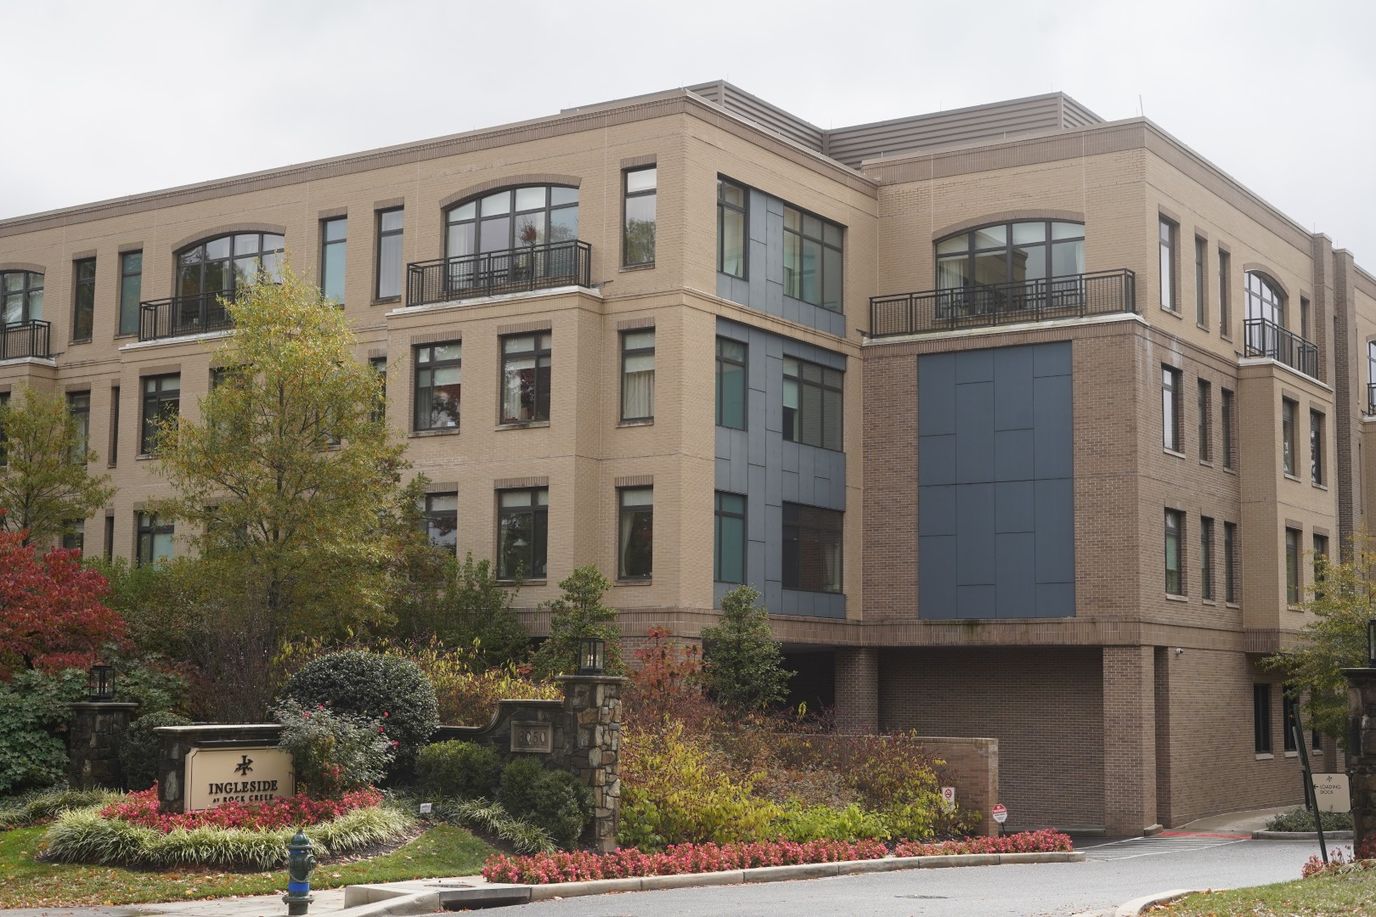
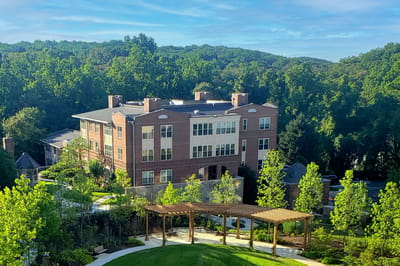
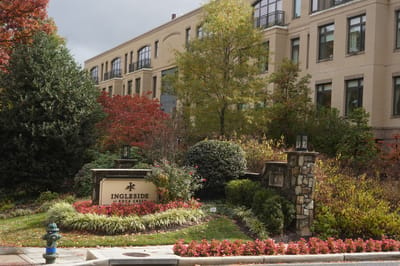
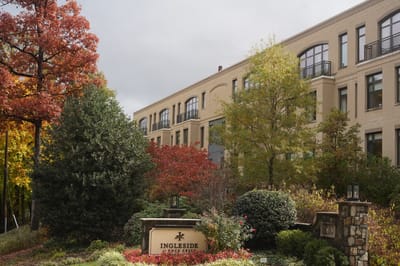
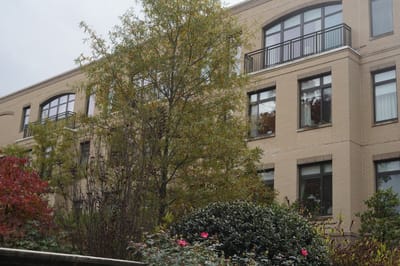
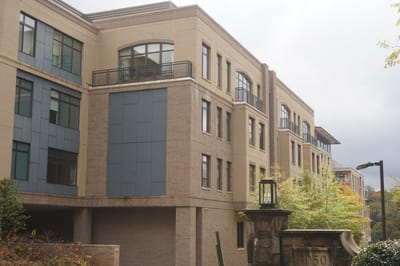
Over 14 acres adjacent to Rock Creek Park, Ingleside at Rock Creek operates as a Continuing Care Retirement Community offering nursing care, assisted living, memory care, and home-based services in Northwest Washington. The nonprofit institution, owned by Bruce Bartels and led by Executive Director Jason Basile (15+ years in senior living administration), has expanded its footprint significantly over the past decade. The skilled nursing component currently houses 27 residents at 95.1% occupancy, the second-highest census in DC, with a primarily Medicare short-stay population (87% of admissions, 24-day average) supplemented by private-pay long-term residents (17-year average) and minimal Medicaid presence (1%).

Staffing investment is genuine. The nursing care commitment reaches 5 hours 31 minutes per resident per day, nearly 31% above the DC state average, with a staff-to-resident ratio of 3.44:1; 85% better than state norms. Yet the facility relies heavily on contractor labor (24.3% of staffing) and maintains the lowest payroll-to-revenue ratio in DC at 33.4%.

The quality paradox emerges in resident outcomes: despite abundant staffing, the facility reports functional decline rates 65% worse than state, incontinence 60% worse than average, and falls with major injury at 188% of the state rate; troubling findings that suggest care quality gaps exist beneath the staffing numbers. Two penalties totaling $39,000 in the past three years (60% lower than state average) indicate moderate compliance, and the facility achieved 100% influenza vaccination but fell short on pneumococcal coverage at 81.8% (state average 90.4%).

Financially, the facility operates under ongoing stress: a $1.9 million operating loss in 2023 following a $12.1 million loss in 2022. Occupancy recovery to 95.1% from pandemic lows (73.6% in 2019) reflects strong demand for the campus and its accredited programs (CARF, SAGECare Platinum, Fortune’s Best Workplaces in Aging Services), yet profitability remains elusive.

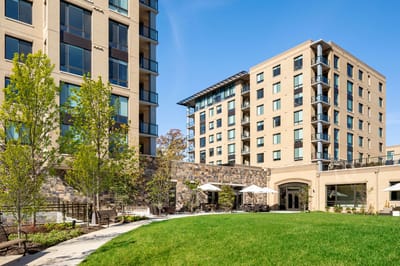
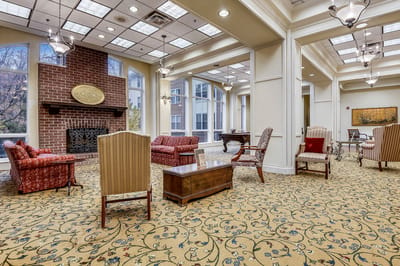
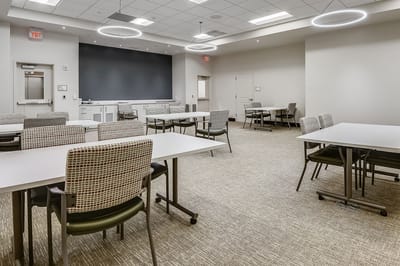
The 14-acre campus provides both active and restorative amenities: walking access directly into Rock Creek Park, an indoor pool for therapy and recreation, a theater for resident programming, and an on-site wellness and medical clinic. Memory care assisted living, skilled nursing rehabilitation, and an adult day program address varying care needs. The lifestyle orientation reflected in the art studio, fitness center, and salon, signals the community’s focus on residents able to engage in independent or supported-independent activities. Accreditations in LGBTQ+ equality and Great Places to Work reflect mission-driven operations.

The community attracts affluent and mission-aligned residents seeking an integrated retirement campus with extensive wellness amenities; the concerning outcome metrics warrant direct clinical inquiry.

Quality ratings

Measured by Centers for Medicare & Medicaid Services (CMS)

Overall rating Info The Overall CMS Rating combines results from health inspections, staffing levels and quality measures. Health inspections carry the most weight. Staffing and quality scores can increase or decrease the final rating based on performance compared to state and national standards.
▲ 54.5% Above DC avg. ▲ 54.5% Above DC avg.DC average: 3.2Click the badge to see the full State ranking.Click here to see the full State ranking.
Health Inspection Info Based on the results of the facility's three most recent standard inspections and any complaint investigations. CMS reviews the number, scope, and severity of deficiencies, with more recent findings weighted more heavily.
▲ 8.5% Above DC avg. ▲ 8.5% Above DC avg.DC average: 2.8Click the badge to see the full State ranking.Click here to see the full State ranking.
Staffing Info Measures average nursing staff hours per resident per day, including Registered Nurses (RNs) and total nursing staff. Ratings are adjusted based on the level of care residents require and are compared to state and national benchmarks.
▲ 30.8% Above DC avg. ▲ 30.8% Above DC avg.DC average: 3.8Click the badge to see the full State ranking.Click here to see the full State ranking.
Quality Measures Info Based on clinical and physical health indicators reported to CMS, such as hospital readmissions, falls, pressure ulcers, and improvements in mobility. These measures reflect how well residents' health needs are being managed.
▲ 13.3% Above DC avg. ▲ 13.3% Above DC avg.DC average: 4.4Click the badge to see the full State ranking.Click here to see the full State ranking.

Staffing hours breakdown

Info Daily nursing hours per resident by staff type, reported to CMS. Higher is generally better — compare this facility to state and national averages to see where staffing stands.

Hours per resident per day — compared to District of Columbia state averages

Total nursing care / resident Info This home is ranked 2nd out of 9 homes in District of Columbia for nurse hours. Total adjusted nursing hours per resident per day, combining RN, LPN, and aide time. CMS adjusts this for case-mix so facilities can be fairly compared.
5h 31m per day
Rank #2 / 9Nurse hours — State benchmarkedThis home is ranked 2nd out of 9 homes in District of Columbia. Shows adjusted nurse hours per resident per day benchmarked to the District of Columbia average, with a ranking across 9 District of Columbia facilities. More hours mean more direct care. The national average is about 3.5 hrs; below 3.0 is a red flag.Rankings are based only on facilities in District of Columbia that report data for that category. Facilities without available data are excluded from the ranking.Click the rank badge to see the full State ranking.Click here to see the full State ranking.
This facility District of Columbia avg (4h 36m per day)
vs District of Columbia avg
+20%

1 of 6 metrics below state avg

Standout metric Physical Therapist is +38% above state avg
Staff typeHours / Day / Residentvs state avg
Registered Nurse (RN) Info RNs hold the highest nursing license and can assess residents, interpret test results, and direct care plans. More RN hours per day often signals stronger clinical oversight and faster response to health changes. 2h 24m per day ▲ 27% State avg: 1h 54m per day · National avg: 41m per day
LPN / LVN Info Licensed Practical Nurses (LPNs) or Licensed Vocational Nurses (LVNs) deliver routine hands-on care — medication administration, wound dressing, and monitoring vital signs. They work under RN supervision and make up a large share of daily bedside care. 21m per day ▼ 51% State avg: 44m per day · National avg: 52m per day
Nurse Aide Info Certified Nurse Aides (CNAs) provide the most direct day-to-day assistance: bathing, dressing, feeding, and mobility. Nurse aide hours are typically the largest staffing category and directly affect residents' quality of life. 2h 47m per day ▲ 6% State avg: 2h 38m per day · National avg: 2h 20m per day
Weekend Total Nursing Info Combined nursing hours (RN + LPN + Nurse Aide) per resident per day on weekends. Staffing often drops on weekends — this figure reveals whether the facility maintains adequate coverage outside of weekday hours. 4h 59m per day ▲ 6% State avg: 4h 41m per day · National avg: 3h 27m per day
Physical Therapist Info Hours per resident per day provided by licensed Physical Therapists (PTs) or PT Assistants. PT services help residents recover mobility after injury or illness and are especially important for post-acute (short-stay) rehabilitation. 11m per day ▲ 38% State avg: 8m per day · National avg: 4m per day
Weekend RN Info Registered nurse hours specifically on weekends. Facilities sometimes reduce RN presence on Saturdays and Sundays — a low weekend RN figure compared to weekday hours can indicate reduced clinical oversight when most administrative staff are absent. 2h 3m per day ▲ 31% State avg: 1h 34m per day · National avg: 29m per day

Capacity and availability

This home is often near full

Higher occupancy than the District of Columbia average: 76.9%
Occupancy rate
95.1% Rank #2 / 9Occupancy rate — State benchmarkedThis home is ranked 2nd out of 9 homes in District of Columbia. Shows this facility's occupancy rate versus the District of Columbia average, with its Statewide rank out of 9. Higher occupancy signals strong local demand and financial stability.Rankings are based only on facilities in District of Columbia that report data for that category. Facilities without available data are excluded from the ranking.Click the rank badge to see the full State ranking.Click here to see the full State ranking.
Avg. Length of Stay
80 days
Bed community size
34-bed community
A moderately sized community that may balance personal attention with shared amenities and social activities.
Walk Score
Walk Score: 42 / 100
Somewhat walkable. A few nearby services may be reachable on foot, but most trips require transportation.

About this community

License Details

AccreditationsCARF Accredited, SAGECare Platinum certification, Great Place to Work, High Performer in LGBTQ+ Long-Term Care Equality, Fortune’s Best Workplaces in Aging Services

Therapy & Rehabilitation

3 services
Rehabilitation Services
Respite Care
Short-Term Rehab

Amenities & Lifestyle

Flexible Meal Plan
Weekly Housekeeping
Interior And Exterior Campus Maintenance
Center For Healthy Living
Indoor Pool
Aerobics And Yoga Studio
Fitness And Weight Room
Walking Trails In Rock Creek Park
Meditation Room
Art Studio
Library
Theater
Guest Suites
Salon/Day Spa
Wellness And Medical Clinic
Specific ProgramsMemory Care Assisted Living, Skilled Nursing and Rehab, Social Day Program

Contact Ingleside at Rock Creek, a CCRC

Staffing Data

Reporting period: October 1 – December 31, 2025 (Q4 2025). Source: CMS Payroll-Based Journal report.

Total staff 93
Employees 56
Contractors 37
Staff to resident ratio 3.44 : 1
136% more staff per resident than District of Columbia average
District of Columbia average ratio: 1.46 : 1 District of Columbia average ratio: 1.46 : 1See full District Of Columbia ranking
Avg staff/day 32
Average shift 7.3 hours
12% worse than District of Columbia average
District of Columbia average: 8.3 hours District of Columbia average shift: 8.3 hoursSee full District Of Columbia ranking
Total staff hours (quarter) 21,415

Nursing staff breakdown

Q4 2025 · Oct 1 – Dec 31 More info This data comes from the CMS Payroll-Based Journal report covering October 1 – December 31, 2025.
Registered Nurse

Manages medical care and health needs.

RN Staff Info 23 total: 14 full-time employees and 9 contractors. 23
Average shift length Info Average shift length. Calculated as total hours divided by days worked and average staff per day. 7.8 hours
Licensed Practical Nurse

Assists with medical care and medications.

LPN Staff Info 6 total: 3 full-time employees and 3 contractors. 6
Average shift length Info Average shift length. Calculated as total hours divided by days worked and average staff per day. 8.9 hours
Certified Nursing Assistant

Helps with daily care and mobility.

CNA Staff Info 32 total: 25 full-time employees and 7 contractors. 32
Average shift length Info Average shift length. Calculated as total hours divided by days worked and average staff per day. 7.6 hours

Contractor staffing

Q4 2025 · Oct 1 – Dec 31 More info This data comes from the CMS Payroll-Based Journal report covering October 1 – December 31, 2025.

Total hours from contractors

24.3%

5,213 contractor hours this quarter

Registered Nurse: 9 Certified Nursing Assistant: 7 Respiratory Therapy Technician: 6 Licensed Practical Nurse: 3 Diagnostic X-ray Services Staff: 3 Physical Therapy Assistant: 2 Qualified Social Worker: 2 Occupational Therapy Aide: 1 Mental Health Service Worker: 1 Speech Language Pathologist: 1 Medical Director: 1 Occupational Therapy Assistant: 1

Staff by category

Q4 2025 · Oct 1 – Dec 31 More info This data comes from the CMS Payroll-Based Journal report covering October 1 – December 31, 2025.
Certified Nursing Assistant257327,58992100%7.6
Registered Nurse149235,45792100%7.8
Other Dietary Services Staff6062,47192100%7.2
Licensed Practical Nurse3369707986%8.9
Clinical Nurse Specialist2026006065%8
Dietitian1014926267%7.9
Respiratory Therapy Technician0664817177%3.4
Nurse Practitioner2024806065%8
Physical Therapy Assistant0224736773%4.9
Administrator2024645863%8
Dental Services Staff1014355560%7.9
Qualified Social Worker0224146470%6.3
Mental Health Service Worker0113654953%7.4
Occupational Therapy Aide0112803538%8
Speech Language Pathologist0112723437%8
Diagnostic X-ray Services Staff033881617%4.6
Medical Director011663235%2.1
Occupational Therapy Assistant0111955%3.8
32 Certified Nursing Assistant
% of Days 100%
23 Registered Nurse
% of Days 100%
6 Other Dietary Services Staff
% of Days 100%
6 Licensed Practical Nurse
% of Days 86%
2 Clinical Nurse Specialist
% of Days 65%
1 Dietitian
% of Days 67%
6 Respiratory Therapy Technician
% of Days 77%
2 Nurse Practitioner
% of Days 65%
2 Physical Therapy Assistant
% of Days 73%
2 Administrator
% of Days 63%
1 Dental Services Staff
% of Days 60%
2 Qualified Social Worker
% of Days 70%
1 Mental Health Service Worker
% of Days 53%
1 Occupational Therapy Aide
% of Days 38%
1 Speech Language Pathologist
% of Days 37%
3 Diagnostic X-ray Services Staff
% of Days 17%
1 Medical Director
% of Days 35%
1 Occupational Therapy Assistant
% of Days 5%

Penalties and fines

Includes penalties issued in 2023-2025

Federal penalties imposed by CMS for regulatory violations, including civil money penalties (fines) and denials of payment for new Medicare/Medicaid admissions.

Source: CMS Penalties Database (Data as of Jan 2026)

Total fines amount $39K Rank #7 / 10Federal fines — State benchmarkedThis home is ranked 7th out of 10 homes in District of Columbia. Shows this facility's cumulative CMS federal fine dollars versus the District of Columbia average among facilities with fines, and where it ranks among 10 facilities in the pool. Lower total dollars mean a better rank.Rankings are based only on facilities in District of Columbia that report data for that category. Facilities without available data are excluded from the ranking.Click the rank badge to see the full State ranking.Click here to see the full State ranking.
60% lower than District of Columbia average

District of Columbia average: $100K

Number of fines 2
17% more fines than District of Columbia average

District of Columbia average: 1.7

Payment Denials Info Serious action where Medicare and/or Medicaid temporarily stops payments for new residents until issues are fixed. 0
100% fewer payment denials than District of Columbia average

District of Columbia average: 0.5

Fines amount comparison
This facility $39K
District of Columbia average $100K
Penalty History

Penalties are imposed by CMS for violations of federal nursing home regulations.

2 penalties in the past 3 years

Multiple penalties were reported in the last 3 years.

Civil Money Penalty Info Fines imposed for noncompliance, which can be assessed per day or per instance of violation. Mar 26, 2025
$14K
Civil Money Penalty Info Fines imposed for noncompliance, which can be assessed per day or per instance of violation. Dec 8, 2023
$25K

Last updated: Jan 2026

Quality of care over time

These measures show how residents usually do over time at this home, based on health outcomes and preventive care.

High-risk clinical events score Info A composite score based on pressure ulcers, falls with injury, weight loss, walking ability decline, and activities of daily living decline. 2.6
76% better than District of Columbia average

District of Columbia average: 10.8

Functional decline score Info A composite score based on activities of daily living decline, walking ability decline, and incontinence. 37.7
65% worse than District of Columbia average

District of Columbia average: 22.9

Long-stay resident measures
Low Risk Residents with Bowel/Bladder Incontinence Info Percent of low risk long-stay residents who lose control of their bowels or bladder 37.7%
60% worse than District of Columbia average

District of Columbia average: 23.5%

Falls with Major Injury Info Percent of long-stay residents experiencing one or more falls with major injury 3.4%
188% worse than District of Columbia average

District of Columbia average: 1.2%

High Risk Residents with Pressure Ulcers Info Percent of long-stay high risk residents with pressure ulcers 4.5%
45% better than District of Columbia average

District of Columbia average: 8.1%

Urinary Tract Infection Info Percent of long-stay residents with a urinary tract infection 1.2%
35% better than District of Columbia average

District of Columbia average: 1.8%

Lost Too Much Weight Info Percent of long-stay residents who lose too much weight 0.0%
100% better than District of Columbia average

District of Columbia average: 4.6%

Depressive Symptoms Info Percent of long-stay residents who have depressive symptoms 0.0%
100% better than District of Columbia average

District of Columbia average: 5.3%

Antipsychotic Use Info Percent of long-stay residents who received an antipsychotic medication 6.8%
6% better than District of Columbia average

District of Columbia average: 7.2%

Pneumococcal Vaccine Info Percent of long-stay residents assessed and appropriately given the pneumococcal vaccine 81.8%
10% worse than District of Columbia average

District of Columbia average: 90.4%

Influenza Vaccine Info Percent of long-stay residents assessed and appropriately given the seasonal influenza vaccine 100.0%
In line with District of Columbia average

District of Columbia average: 97.0%

Short-stay resident measures
Pneumococcal Vaccine Info Percent of short-stay residents assessed and appropriately given the pneumococcal vaccine 71.7%
7% better than District of Columbia average

District of Columbia average: 66.9%

Antipsychotic medication increase Info Percent of short-stay residents who newly received an antipsychotic medication 1.6%
127% worse than District of Columbia average

District of Columbia average: 0.7%

Influenza Vaccine Info Percent of short-stay residents assessed and appropriately given the seasonal influenza vaccine 70.5%
In line with District of Columbia average

District of Columbia average: 73.2%

Breakdown by payment type

Medicare

87% of new residents, usually for short-term rehab.

Typical stay 24 days

Private pay

12% of new residents, often for short stays.

Typical stay 17 years

Medicaid

1% of new residents, often for long-term daily care.

Typical stay 5 years

Facility Characteristics

Source: CMS Long-Term Care Facility Characteristics (Data as of Jan 2026)

Total residents 27
Medicare
4
14.8% of residents
Medicaid
7
25.9% of residents
Private pay or other
16
59.3% of residents
Programs & Services
Residents Group

Residents meet regularly to discuss policies, care quality, and activities

Family Member Group

Family members meet regularly to discuss policies, care quality, and activities

CCRC

Part of a Continuing Care Retirement Community offering multiple care levels

Active Family Council

Organized group of family members that meets regularly to discuss facility policies, resident care, and activities.

Active Resident Council

Organized group of residents that meets regularly to discuss facility policies, quality of life, and activities.

Finances and operations

Based on CMS SNF Cost Report for fiscal year ending in 12/2023.

Nonprofit
Nonprofit Corporation
Net patient revenue Info Net patient revenue — what the home actually collects for resident care, after contractual allowances, bad debt and discounts are subtracted from its gross charges (CMS cost report, Worksheet G-3). It covers resident care only; money the home earns from other sources is shown separately as "Other income."
$34.3M
Net patient income Info Net patient income: net patient revenue minus the home's total operating expenses. A positive figure means it earns more from resident care than it spends to deliver it; a negative figure means the opposite. It excludes non-operating "other income."
-$7.7M
Nonprofit Nonprofit Corporation
Net patient revenue Info Net patient revenue — what the home actually collects for resident care, after contractual allowances, bad debt and discounts are subtracted from its gross charges (CMS cost report, Worksheet G-3). It covers resident care only; money the home earns from other sources is shown separately as "Other income."
$34.3M Rank #3 / 9Revenue — State benchmarkedThis home is ranked 3rd out of 9 homes in District of Columbia. Shows this facility's annual revenue compared to the District of Columbia average. Higher revenue generally means more resources for staffing and capital — read alongside Payroll %.Rankings are based only on facilities in District of Columbia that report data for that category. Facilities without available data are excluded from the ranking.Click the rank badge to see the full State ranking.Click here to see the full State ranking.
Net patient income Info Net patient income: net patient revenue minus the home's total operating expenses. A positive figure means it earns more from resident care than it spends to deliver it; a negative figure means the opposite. It excludes non-operating "other income."
-$7.7M
Other income Info Money the home earns outside of resident care — such as investments, grants, rentals and other non-operating sources (CMS cost report, Worksheet G-3). It is tracked separately from net patient revenue: it is not part of that figure, and it is not included in net patient income.
$5.8M
Payroll costs Info Staff salaries plus wage-related costs — benefits such as payroll taxes, health insurance and retirement — from the home's own accounting records (CMS cost report, Worksheet A). Contract or agency labor is counted separately, under other operating costs. Rank #4 / 9Payroll — State benchmarkedThis home is ranked 4th out of 9 homes in District of Columbia. Shows total annual staff payroll benchmarked to the District of Columbia average. Higher payroll investment relative to peers often signals better staffing and less reliance on cheaper contract labor.Rankings are based only on facilities in District of Columbia that report data for that category. Facilities without available data are excluded from the ranking.Click the rank badge to see the full State ranking.Click here to see the full State ranking.
$13.1M 38.2% of net patient revenue Info Payroll as a share of revenue: staff salaries and wage-related benefits divided by net patient revenue. A higher figure means more of each revenue dollar goes to staff pay. Rank #9 / 9Payroll % — State benchmarkedThis home is ranked 9th out of 9 homes in District of Columbia. Shows payroll as a percentage of revenue versus the District of Columbia average. Below 25% may signal understaffing or heavy agency use — read with Staffing ratings.Rankings are based only on facilities in District of Columbia that report data for that category. Facilities without available data are excluded from the ranking.Click the rank badge to see the full State ranking.Click here to see the full State ranking.
Other operating costs Info Everything it costs to run the home apart from payroll — food, utilities, supplies, maintenance, contract labor and administration. Calculated as total operating expense minus payroll (staff salaries and wage-related benefits).
$28.9M
Total costs Info The home's total operating expense for the year — all the costs of running it, salaries included (CMS cost report, Worksheet G-3).
$42.0M

Who this home usually serves

TYPE OF STAY

Mostly short-term rehab stays

Most residents typically stay for a few weeks or months before returning home or moving on.

Most new residents arrive under Medicare (87% of admissions), and a typical Medicare stay runs around 24 days.

Admissions
142 total

Coverage residents most often arrive under.

Medicare 87%
Private pay 12%
Medicaid 1%
Discharges
181 total

Coverage residents most often leave under.

Medicare 83%
Private pay 15%
Medicaid 2%

Managed by Jason Basile

Executive Director

Over 15 years of experience

Jason Basile serves as Executive Director of Ingleside at Rock Creek, overseeing daily operations and strategic vision. With over 15 years in senior living not-for-profits, he has led major community enhancements including a full refurbishment and the launch of an adult day program. Jason holds a Masters in Health Care Administration and is a licensed nursing home administrator in South Carolina and Washington, D.C.

Places of interest near Ingleside at Rock Creek, a CCRC

Address 4.0 miles from city center Info Estimated distance in miles from Washington's city center to Ingleside at Rock Creek, a CCRC's address, calculated via Google Maps. — 3.07 miles to nearest hospital (Sibley Memorial Hospital)

Calculate Travel Distance to Ingleside at Rock Creek, a CCRC

Add your location

Address

Compare Nursing Homes around Washington

Ingleside at Rock Creek, a CCRC
NH
AL
HC
IL
MC
NC
Assisted Living In Washington (Northwest Washington) -34 - 42 1 Bed / 2 Bed
Knollwood Life Plan Community
NH
AL
IL
MC
NC
Assisted Living In Washington (Northwest Washington) -69 - 15 Studio / 1 Bed / 2 Bed
Carroll Manor Nursing & Rehab Center
NH
IL
MC
Independent Living In Washington (Northeast Washington) -252 - 34 -
Sibley Memorial Hosp Renaissance
NH
Nursing Homes In Washington (Northwest Washington) -45 - 26 -
Lisner-Louise-Dickson-Hurt-Home
NH
AL
NC
RC
Assisted Living In Washington (Northwest Washington) -60 - 91 -

Frequently Asked Questions about Ingleside at Rock Creek, a CCRC

What neighborhood is Ingleside at Rock Creek, a CCRC in?

Ingleside at Rock Creek, a CCRC is in the Northwest Washington neighborhood.

Is Ingleside at Rock Creek, a CCRC in a walkable area?

Ingleside at Rock Creek, a CCRC has a walk score of 42. Somewhat walkable. A few nearby services may be reachable on foot, but most trips require transportation.

What is the occupancy rate at Ingleside at Rock Creek, a CCRC?

Ingleside at Rock Creek, a CCRC's occupancy is 95.1%.

Does Ingleside at Rock Creek, a CCRC have different floorplan options?

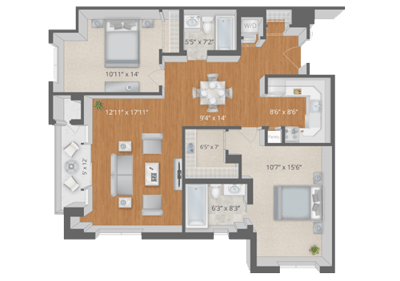
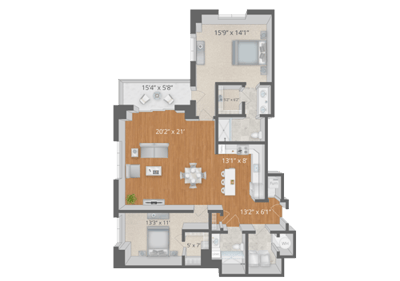
Yes — see the floorplan options available at Ingleside at Rock Creek, a CCRC on this page.

Does Ingleside at Rock Creek, a CCRC operate as a for-profit or non-profit?

Ingleside at Rock Creek, a CCRC is registered as a non-profit.

Are there photos of Ingleside at Rock Creek, a CCRC?

Yes — there are 21 photos of Ingleside at Rock Creek, a CCRC in the photo gallery on this page.

What is the address of Ingleside at Rock Creek, a CCRC?

Ingleside at Rock Creek, a CCRC is located at 3050 Military Rd Nw, Washington, DC 20015.

Guides for Better Senior Living

Care Cost Calculator: See Prices in Your Area

Nursing Home Data Explorer

Don’t Wait Too Long: 7 Red Flag Signs Your Parent Needs Assisted Living Now

The True Cost of Assisted Living in 2025 – And How Families Are Paying For It

Understanding Senior Living Costs: Pricing Models, Discounts & Financial Assistance