


Total staff
215
Employees
172
Contractors
43
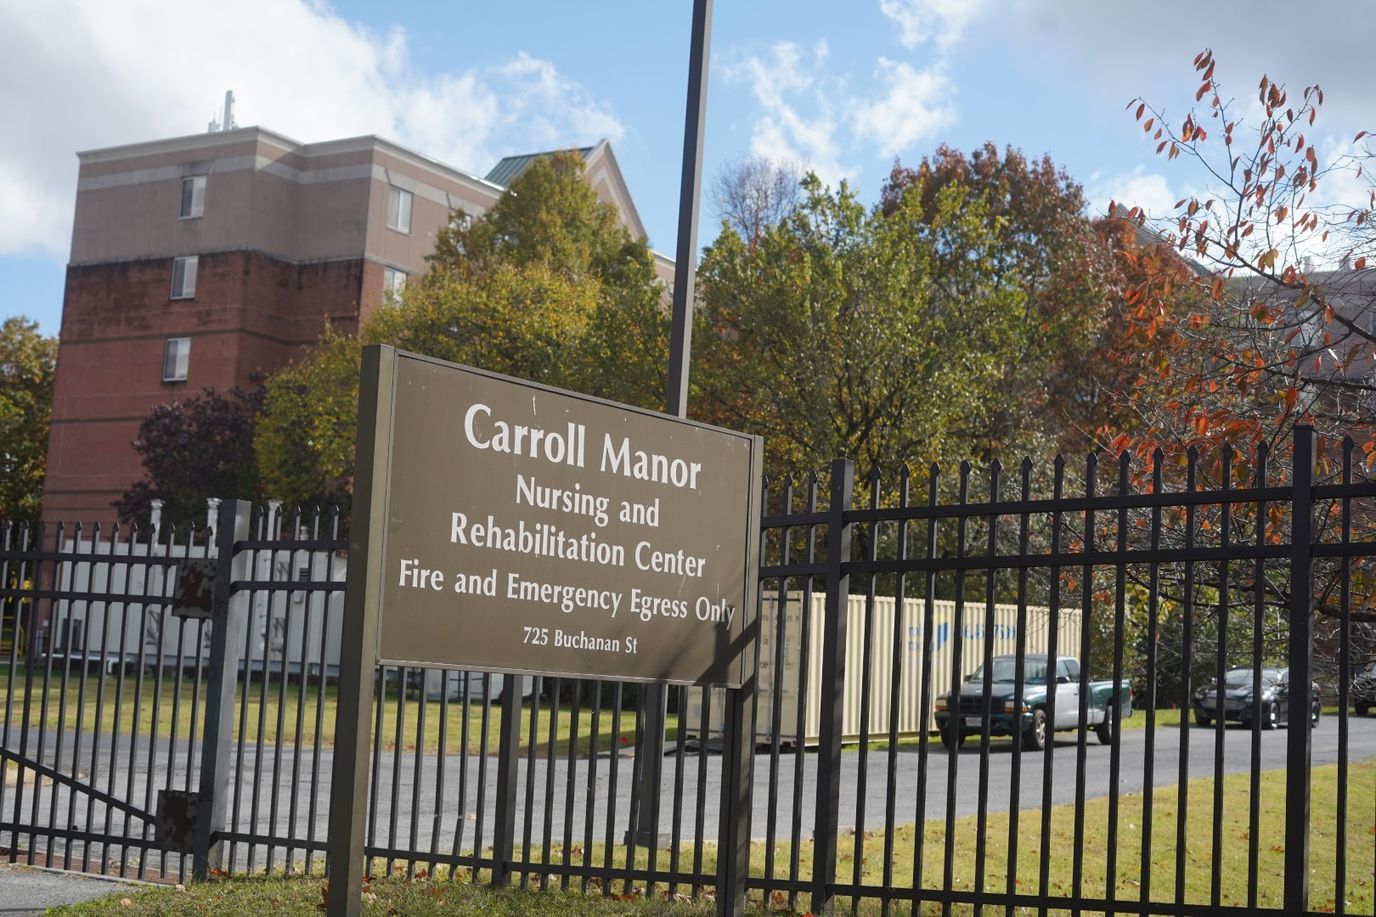
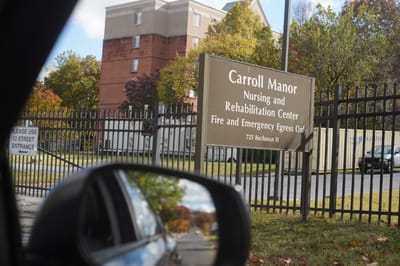
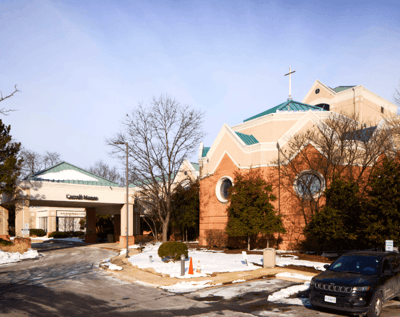
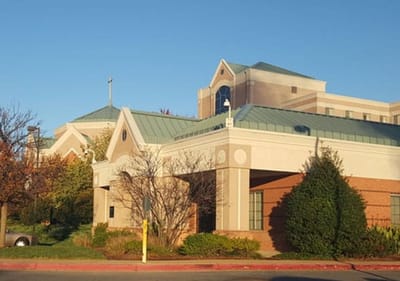
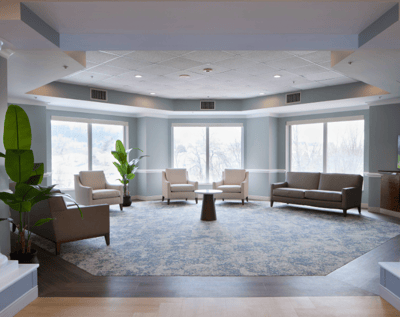
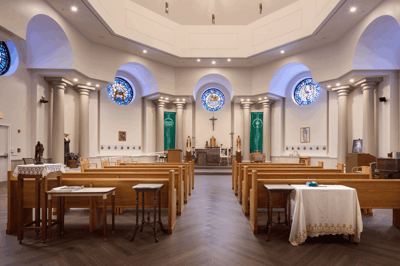
Managed by Ascension Health Senior Care, Carroll Manor Nursing & Rehab Center provides independent living, memory care, and nursing services in Washington, D.C. The community accommodates 252 residents and is among the larger care communities in the area. With both Medicare and Medicaid certification as well as accreditation from The Joint Commission, it also accepts Medicare and private-pay residents. 24-hour support is also offered.
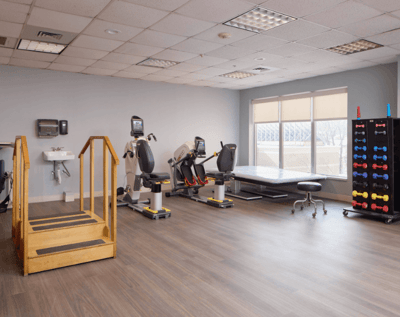
The community serves individuals recovering from illness or injury as well as those requiring ongoing nursing support, with an average resident stay of 185 days. Around 5 hours and 13 minutes of nursing care is provided daily from a team that consists of RNs, LPNs, and nurse aides. Rehabilitation services are also supported by speech-language pathologists, respiratory therapy technicians, occupational therapy aides, and physical therapy assistants and aides.
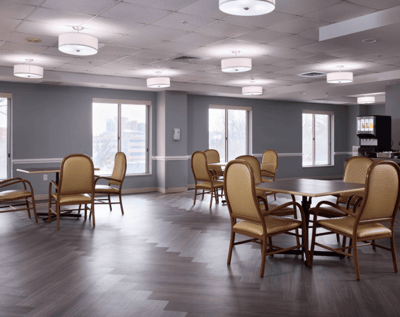
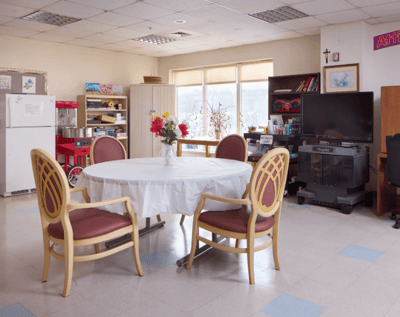
A variety of amenities help promote comfort and engagement for older adults, including six landscaped garden courtyards, a salon and barbershop, pet visitation programs, and a range of recreational and enrichment activities. Meals and snacks are also served daily in designated dining spaces, and a Residents Council provides opportunities for feedback and participation. The community is also located within walking distance of Providence Health System, offering convenient access to additional healthcare services.
| Staff type | Hours / Day / Resident | vs state avg |
|---|---|---|
|
Registered Nurse (RN)
| 58m per day | ▼ 44% State avg: 1h 45m per day · National avg: 41m per day |
|
LPN / LVN
| 1h 0m per day | ▲ 76% State avg: 34m per day · National avg: 52m per day |
|
Nurse Aide
| 2h 42m per day | ▲ 6% State avg: 2h 33m per day · National avg: 2h 21m per day |
|
Weekend Total Nursing
| 4h 14m per day | ▼ 3% State avg: 4h 21m per day · National avg: 3h 26m per day |
|
Physical Therapist
| 5m per day | ▼ 9% State avg: 6m per day · National avg: 4m per day |
|
Weekend RN
| 44m per day | ▼ 47% State avg: 1h 23m per day · National avg: 29m per day |
Reporting period: October 1 – December 31, 2025 (Q4 2025). Source: CMS Payroll-Based Journal report.
Manages medical care and health needs.
Assists with medical care and medications.
Helps with daily care and mobility.
Total hours from contractors
6,722 contractor hours this quarter
| Certified Nursing Assistant | 86 | 0 | 86 | 42,310 | 92 | 100% | 8.7 |
| Licensed Practical Nurse | 28 | 0 | 28 | 15,611 | 92 | 100% | 9.9 |
| Registered Nurse | 36 | 0 | 36 | 12,269 | 92 | 100% | 8.5 |
| Other Dietary Services Staff | 8 | 0 | 8 | 2,909 | 91 | 99% | 7.6 |
| Clinical Nurse Specialist | 7 | 0 | 7 | 2,566 | 64 | 70% | 8 |
| Physical Therapy Assistant | 0 | 12 | 12 | 1,960 | 86 | 93% | 6.6 |
| Dental Services Staff | 5 | 0 | 5 | 1,637 | 66 | 72% | 7.4 |
| Respiratory Therapy Technician | 0 | 10 | 10 | 1,426 | 81 | 88% | 7.6 |
| Physical Therapy Aide | 0 | 7 | 7 | 1,044 | 80 | 87% | 7.1 |
| Speech Language Pathologist | 0 | 3 | 3 | 712 | 63 | 68% | 7.4 |
| Qualified Social Worker | 0 | 4 | 4 | 704 | 67 | 73% | 6.1 |
| Occupational Therapy Aide | 0 | 5 | 5 | 517 | 45 | 49% | 6.8 |
| Administrator | 1 | 0 | 1 | 456 | 57 | 62% | 8 |
| Nurse Practitioner | 1 | 0 | 1 | 448 | 56 | 61% | 8 |
| Therapeutic Recreation Specialist | 0 | 2 | 2 | 359 | 42 | 46% | 8.6 |
Includes penalties issued in 2024
Federal penalties imposed by CMS for regulatory violations, including civil money penalties (fines) and denials of payment for new Medicare/Medicaid admissions.
Source: CMS Penalties Database (Data as of Jan 2026)
District of Columbia average: $100K
District of Columbia average: 1.7
District of Columbia average: 0.5
Penalties are imposed by CMS for violations of federal nursing home regulations.
2 penalties in the past 3 years
Multiple penalties were reported in the last 3 years.
Last updated: Jan 2026
These measures show how residents usually do over time at this home, based on health outcomes and preventive care.
District of Columbia average: 10.8
District of Columbia average: 22.9
District of Columbia average: 23.0%
District of Columbia average: 22.8%
District of Columbia average: 23.5%
District of Columbia average: 1.2%
District of Columbia average: 8.1%
District of Columbia average: 1.8%
District of Columbia average: 4.6%
District of Columbia average: 5.3%
District of Columbia average: 7.2%
District of Columbia average: 90.4%
District of Columbia average: 97.0%
District of Columbia average: 1.07
District of Columbia average: 0.66
District of Columbia average: 66.9%
District of Columbia average: 0.7%
District of Columbia average: 73.2%
District of Columbia average: 18.1%
District of Columbia average: 7.2%
District of Columbia average: 0.8%
District of Columbia average: 53.7%
District of Columbia average: 50.6%
Quality measures are calculated from Minimum Data Set (MDS) assessments. For most measures, lower percentages indicate better care quality.
40% of new residents, usually for short-term rehab.
60% of new residents, often for short stays.
Source: CMS Long-Term Care Facility Characteristics (Data as of Jan 2026)
Residents meet regularly to discuss policies, care quality, and activities
Organized group of residents that meets regularly to discuss facility policies, quality of life, and activities.
Data sourced from CMS Long-Term Care Facility Characteristics quarterly report. Payer mix reflects the current resident census by primary payment source.
Historical financial and operational data for Carroll Manor Nursing & Rehab Center from 2020–2024, based on CMS SNF Cost Reports.
Key figures below are for fiscal year ending in 06/2024.
Based on CMS SNF Cost Report for fiscal year ending in 06/2024.
Pets Allowed
Residents typically stay for brief periods, with frequent admissions and discharges throughout the year.
Most new residents arrive under private pay (60% of admissions), and a typical private pay stay runs around 9 - 10 months.
Coverage residents most often arrive under.
Coverage residents most often leave under.
![]() 3.4 miles from city center
3.4 miles from city center
![]() Estimated distance in miles from Washington's city center to Carroll Manor Nursing & Rehab Center's address, calculated via Google Maps.
Estimated distance in miles from Washington's city center to Carroll Manor Nursing & Rehab Center's address, calculated via Google Maps.
Add your location
Info below is compiled from CMS reports & the DC Dept. of Health, senior community websites & trusted data sources such as Walk Score & BBB.
Communities are listed from highest to lowest based on our ranking methodology.
| Lisner-Louise-Dickson-Hurt-Home | NH AL RESC SNF | Washington (Northwest D.C) | 60 |
90.5%
Facility
90.5%
DC AVG
80.6
Rank
#4 / 10 | +12% | 5.04
Facility
5.04
DC AVG
4.60
Rank
#4 / 9 | -6% | +10% | $0
Facility
$0
DC AVG
$118.4k
Rank
#1 / 10 | 25
Facility
25
DC AVG
63.1
Rank
#1 / 10 | 5.0
Facility
5.0
DC AVG
11.1
Rank
#1 / 10 | - | 54 | - | 91 | Jonathan Plater | $8.0MFiscal year ending 06/2024
Facility
$8.0MFiscal year ending 06/2024
DC AVG
$34.0M
Rank
#7 / 9 | $8.9MFiscal year ending 06/2024
Facility
$8.9MFiscal year ending 06/2024
DC AVG
$11.6M
Rank
#7 / 9 | 111.1%Fiscal year ending 06/2024
Facility
111.1%Fiscal year ending 06/2024
DC AVG
39.8%
Rank
#5 / 9 | 95025 | ||||
| Ingleside at Rock Creek, a CCRC | NH AL HC IL MC SNF | Washington (Northwest D.C) | 34 |
87.1%
Facility
87.1%
DC AVG
80.6
Rank
#5 / 10 | +8% | 5.52
Facility
5.52
DC AVG
4.60
Rank
#2 / 9 | +22% | +20% | $39.4k
Facility
$39.4k
DC AVG
$118.4k
Rank
#7 / 10 | 42
Facility
42
DC AVG
63.1
Rank
#5 / 10 | 14.0
Facility
14.0
DC AVG
11.1
Rank
#8 / 10 | 1 | 30 | - | 42 | Bruce Bartels | $34.3MFiscal year ending 12/2023
Facility
$34.3MFiscal year ending 12/2023
DC AVG
$34.0M
Rank
#3 / 9 | $13.1MFiscal year ending 12/2023
Facility
$13.1MFiscal year ending 12/2023
DC AVG
$11.6M
Rank
#4 / 9 | 38.2%Fiscal year ending 12/2023
Facility
38.2%Fiscal year ending 12/2023
DC AVG
39.8%
Rank
#9 / 9 | 95028 | ||||
| Sibley Memorial Hosp Renaissance | NH SNF | Washington (Northwest D.C) | 45 |
79.1%
Facility
79.1%
DC AVG
80.6
Rank
#6 / 10 | -2% | 5.77
Facility
5.77
DC AVG
4.60
Rank
#1 / 9 | +70% | +25% | $8.8k
Facility
$8.8k
DC AVG
$118.4k
Rank
#3 / 10 | 34
Facility
34
DC AVG
63.1
Rank
#2 / 10 | 6.8
Facility
6.8
DC AVG
11.1
Rank
#2 / 10 | 2 | 36 | - | 26 | - | - | - | - | 95030 | ||||
| Forest Hills of DC | NH AL MC RC SNF | Washington (Northwest D.C) | 55 |
93.3%
Facility
93.3%
DC AVG
80.6
Rank
#3 / 10 | +16% | 4.69
Facility
4.69
DC AVG
4.60
Rank
#5 / 9 | +10% | +2% | $9.3k
Facility
$9.3k
DC AVG
$118.4k
Rank
#4 / 10 | 40
Facility
40
DC AVG
63.1
Rank
#4 / 10 | 10.0
Facility
10.0
DC AVG
11.1
Rank
#4 / 10 | 1 | 51 | - | 79 | Scott Taylor | $14.5MFiscal year ending 12/2023
Facility
$14.5MFiscal year ending 12/2023
DC AVG
$34.0M
Rank
#9 / 9 | $7.7MFiscal year ending 12/2023
Facility
$7.7MFiscal year ending 12/2023
DC AVG
$11.6M
Rank
#8 / 9 | 53.4%Fiscal year ending 12/2023
Facility
53.4%Fiscal year ending 12/2023
DC AVG
39.8%
Rank
#2 / 9 | 95038 | ||||
| Carroll Manor Nursing & Rehab Center | NH IL MC SNF | Washington (Northeast D.C) | 252 |
67.7%
Facility
67.7%
DC AVG
80.6
Rank
#8 / 10 | -16% | 5.22
Facility
5.22
DC AVG
4.60
Rank
#3 / 9 | -18% | +13% | $16.8k
Facility
$16.8k
DC AVG
$118.4k
Rank
#6 / 10 | 54
Facility
54
DC AVG
63.1
Rank
#6 / 10 | 18.0
Facility
18.0
DC AVG
11.1
Rank
#10 / 10 | 2 | 171 | - | 34 | Ascension Health Senior Care | $24.6MFiscal year ending 06/2024
Facility
$24.6MFiscal year ending 06/2024
DC AVG
$34.0M
Rank
#5 / 9 | $12.8MFiscal year ending 06/2024
Facility
$12.8MFiscal year ending 06/2024
DC AVG
$11.6M
Rank
#3 / 9 | 52.1%Fiscal year ending 06/2024
Facility
52.1%Fiscal year ending 06/2024
DC AVG
39.8%
Rank
#7 / 9 | 95034 |
Carroll Manor Nursing & Rehab Center is in the Northeast D.C. neighborhood.
Carroll Manor Nursing & Rehab Center has a walk score of 34. Somewhat walkable. A few nearby services may be reachable on foot, but most trips require transportation.
Carroll Manor Nursing & Rehab Center's occupancy is 73.2%.
Yes, Carroll Manor Nursing & Rehab Center allows residents to bring their pets.
Carroll Manor Nursing & Rehab Center is registered as a non-profit.
Yes — there are 10 photos of Carroll Manor Nursing & Rehab Center in the photo gallery on this page.
Carroll Manor Nursing & Rehab Center is located at 725 Buchanan St Ne, Washington, DC 20017.
Care Cost Calculator: See Prices in Your Area
Nursing Home Data Explorer
Don’t Wait Too Long: 7 Red Flag Signs Your Parent Needs Assisted Living Now
The True Cost of Assisted Living in 2025 – And How Families Are Paying For It
Understanding Senior Living Costs: Pricing Models, Discounts & Financial Assistance


