

Total staff
95
Employees
59
Contractors
36

We arrange tours, appointments, and even moving support so you don’t have to
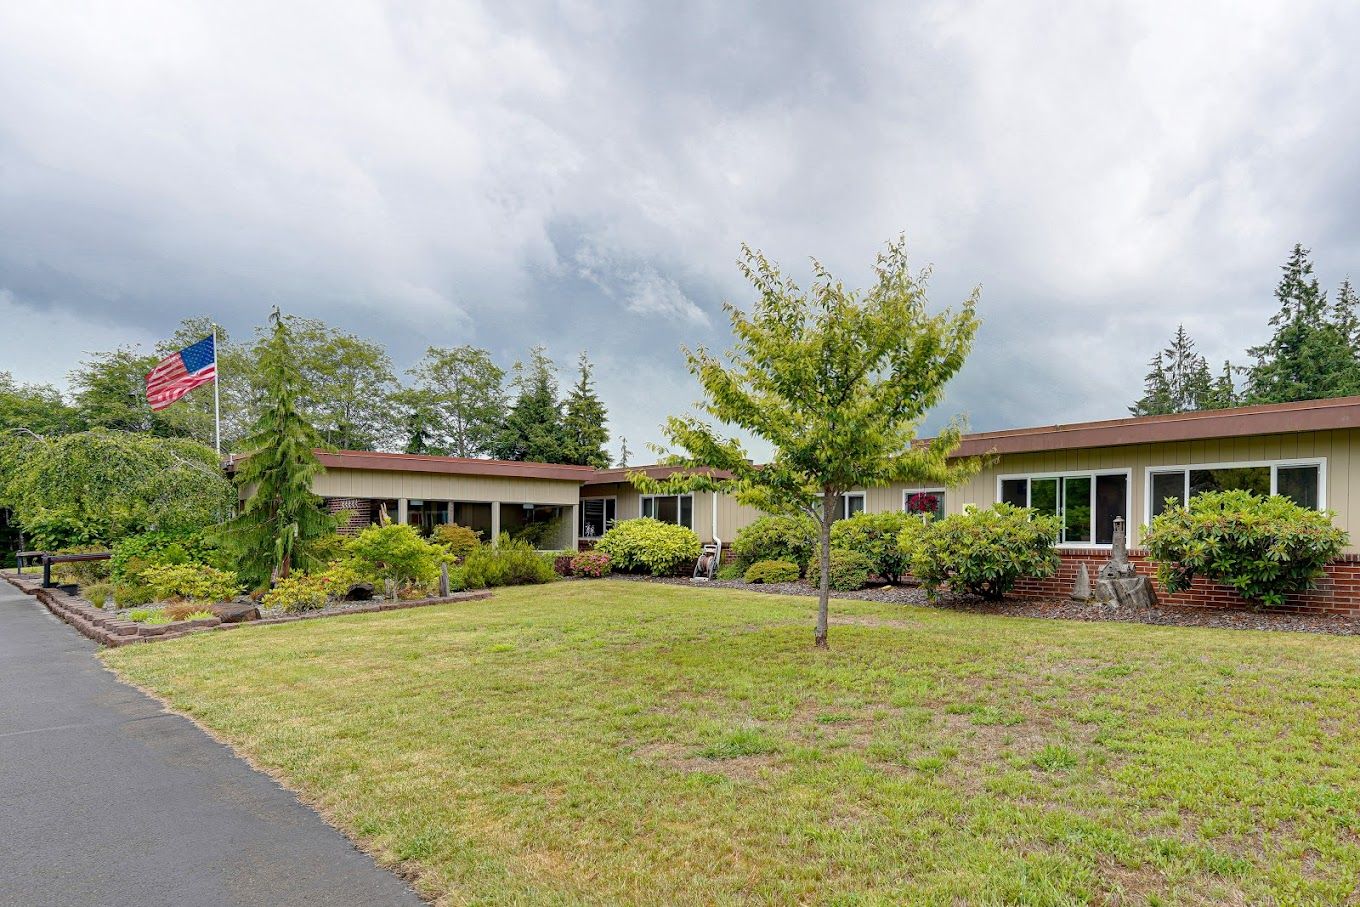
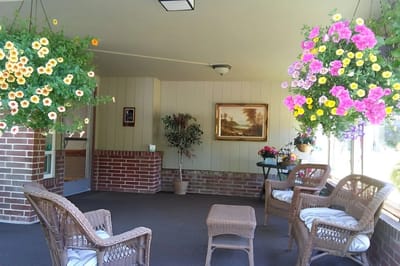

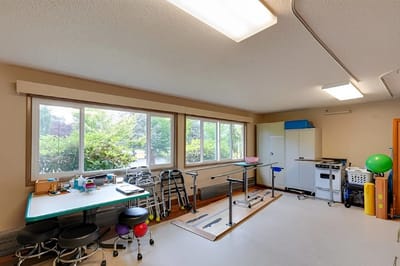
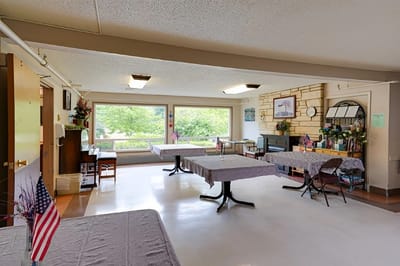
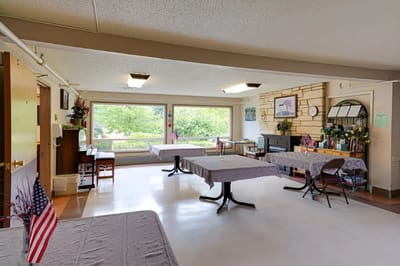
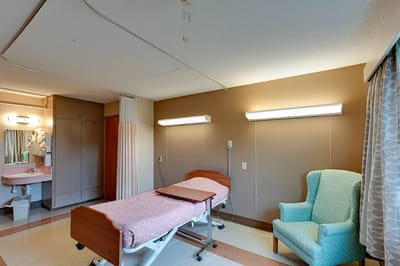
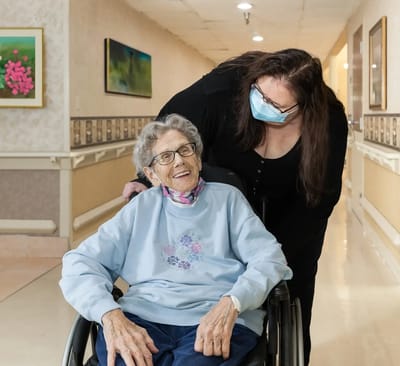
Delivering exceptional care for over 75 years, Willapa Harbor Care situated on Jackson Street, Raymond, WA, provides short-term rehab, long-term skilled nursing, and therapy services. Featuring physical, speech, and occupational therapies, the community ensures seniors’ well-being. Keep your peace of mind and live a maintenance-free lifestyle with round-the-clock care and support provided by a kind and compassionate team.
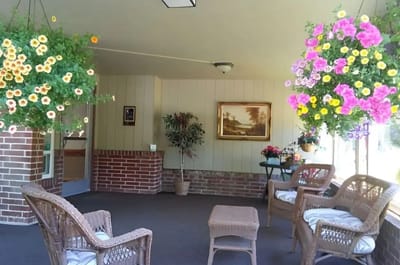
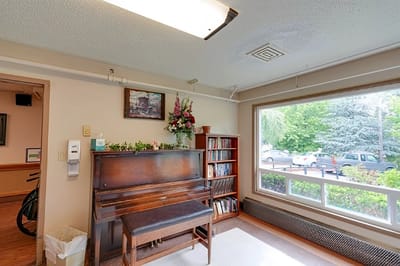
The community fosters a vibrant environment, conducting wellness-focused activities to ensure seniors remain happy and active. Moreover, Willapa Harbor Care values the importance of healthy and balanced meals for seniors’ well-being, providing them with nutritional support to meet their dietary needs. Experience relaxation at its finest with the peaceful and safe community of Willapa Harbor Care.
| Staff type | Hours / Day / Resident | vs state avg |
|---|---|---|
|
Registered Nurse (RN)
| 39m per day | ▼ 27% State avg: 53m per day · National avg: 41m per day |
|
LPN / LVN
| 34m per day | ▼ 31% State avg: 49m per day · National avg: 52m per day |
|
Nurse Aide
| 2h 16m per day | ▼ 15% State avg: 2h 41m per day · National avg: 2h 21m per day |
|
Weekend Total Nursing
| 2h 59m per day | ▼ 21% State avg: 3h 47m per day · National avg: 3h 26m per day |
|
Physical Therapist
| 6m per day | ▲ 18% State avg: 5m per day · National avg: 4m per day |
|
Weekend RN
| 21m per day | ▼ 44% State avg: 38m per day · National avg: 29m per day |
Reporting period: October 1 – December 31, 2025 (Q4 2025). Source: CMS Payroll-Based Journal report.
Manages medical care and health needs.
Assists with medical care and medications.
Helps with daily care and mobility.
Total hours from contractors
1,909 contractor hours this quarter
| Certified Nursing Assistant | 24 | 8 | 32 | 8,500 | 92 | 100% | 8.6 |
| Licensed Practical Nurse | 3 | 19 | 22 | 2,370 | 92 | 100% | 9.3 |
| Registered Nurse | 5 | 6 | 11 | 2,024 | 91 | 99% | 9.1 |
| Nurse Aide in Training | 4 | 0 | 4 | 1,150 | 81 | 88% | 8 |
| Other Dietary Services Staff | 4 | 0 | 4 | 1,081 | 92 | 100% | 7.2 |
| Speech Language Pathologist | 2 | 0 | 2 | 713 | 66 | 72% | 6.5 |
| Administrator | 1 | 0 | 1 | 528 | 66 | 72% | 8 |
| Nurse Practitioner | 1 | 0 | 1 | 528 | 66 | 72% | 8 |
| Respiratory Therapy Technician | 3 | 0 | 3 | 416 | 56 | 61% | 6.6 |
| Mental Health Service Worker | 1 | 0 | 1 | 412 | 51 | 55% | 8.1 |
| Physical Therapy Aide | 1 | 0 | 1 | 384 | 63 | 68% | 6.1 |
| Clinical Nurse Specialist | 2 | 0 | 2 | 186 | 20 | 22% | 9.3 |
| Occupational Therapy Aide | 2 | 1 | 3 | 73 | 15 | 16% | 4.8 |
| Physical Therapy Assistant | 2 | 0 | 2 | 50 | 27 | 29% | 1.8 |
| Occupational Therapy Assistant | 0 | 1 | 1 | 27 | 7 | 8% | 3.9 |
| Medical Director | 0 | 1 | 1 | 24 | 18 | 20% | 1.3 |
| Qualified Social Worker | 3 | 0 | 3 | 19 | 7 | 8% | 2.7 |
| RN Director of Nursing | 1 | 0 | 1 | 18 | 5 | 5% | 3.7 |
Federal penalties imposed by CMS for regulatory violations, including civil money penalties (fines) and denials of payment for new Medicare/Medicaid admissions.
Source: CMS Penalties Database
No penalties in the past 3 years
No civil money penalties or payment denials were reported in the last 3 years.
These measures show how residents usually do over time at this home, based on health outcomes and preventive care.
Washington average: 10.0
Washington average: 20.9
Washington average: 16.4%
Washington average: 21.8%
Washington average: 24.3%
Washington average: 2.6%
Washington average: 4.9%
Washington average: 1.7%
Washington average: 5.8%
Washington average: 16.2%
Washington average: 14.5%
Washington average: 96.2%
Washington average: 93.8%
Washington average: 1.38
Washington average: 1.51
Washington average: 88.1%
Washington average: 1.4%
Washington average: 82.0%
Washington average: 19.9%
Washington average: 13.2%
Washington average: 0.8%
Washington average: 53.7%
Washington average: 50.6%
Quality measures are calculated from Minimum Data Set (MDS) assessments. For most measures, lower percentages indicate better care quality.
81% of new residents, usually for short-term rehab.
10% of new residents, often for short stays.
10% of new residents, often for long-term daily care.
Source: CMS Long-Term Care Facility Characteristics (Data as of Jan 2026)
Residents meet regularly to discuss policies, care quality, and activities
Organized group of residents that meets regularly to discuss facility policies, quality of life, and activities.
Data sourced from CMS Long-Term Care Facility Characteristics quarterly report. Payer mix reflects the current resident census by primary payment source.
Historical financial and operational data for Willapa Harbor Care based on CMS SNF Cost Reports.
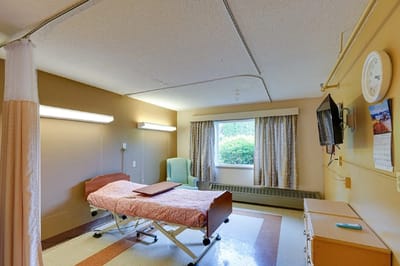
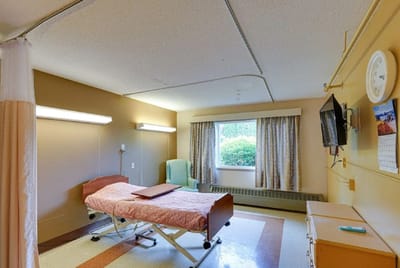
Housing Options: Private Rooms
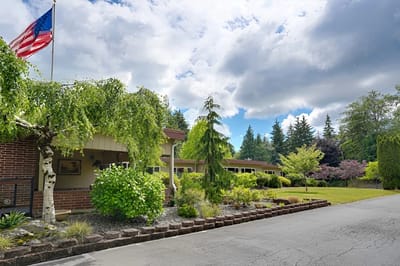
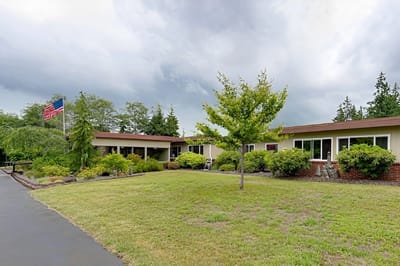
Building Type: Single-story
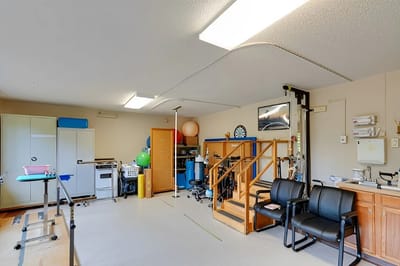
Fitness and Recreation
Most residents typically stay for a few weeks or months before returning home or moving on.
![]() 66.1 miles from city center
66.1 miles from city center
![]() Estimated distance in miles from Raymond's city center to Willapa Harbor Care's address, calculated via Google Maps.
— 0 miles to nearest hospital (Willapa Harbor Care)
Estimated distance in miles from Raymond's city center to Willapa Harbor Care's address, calculated via Google Maps.
— 0 miles to nearest hospital (Willapa Harbor Care)
Add your location
Willapa Harbor Care is located in Raymond, Washington.
Here are the financial assistance programs available to residents in Washington.
The information below is reported by the Washington Department of Social and Health Services, Residential Care Services.
| Puget Health Care Center |
NH Nursing Home Licensed facility providing 24/7 skilled nursing care for residents with complex, ongoing medical needs. Staffed by RNs, LPNs, and CNAs. Inspected and star-rated annually by CMS. Accepts Medicare (short-term rehab) and Medicaid (long-term care).
AL Assisted Living A licensed, long-term care setting for seniors or individuals with disabilities who need help with daily activities — like bathing, dressing, and medication management — but not 24-hour skilled nursing. Offers housing, meals, and around-the-clock support while aiming to maximize resident independence.
IL Independent Living Lifestyle-focused communities for older adults offering dining, activities, and transportation with minimal personal care. Best for active, independent seniors who want community without medical support.
MC Memory Care Secured, specialized care for people living with Alzheimer's or dementia. Staff trained in cognitive impairment, with higher staff-to-resident ratios and an environment designed to reduce confusion and wandering risk. | Olympia (Capital Mall Drive Southwest) | 108
Facility
108
WA AVG
82
Rank
#79 / 366 | - | - | 4.06
Facility
4.06
WA AVG
4.22
Rank
#47 / 89 | -45% | -4% | $8.0k
Facility
$8.0k
WA AVG
$87.7k
Rank
#31 / 91 | 18
Facility
18
WA AVG
48.9
Rank
#7 / 91 | 3.0
Facility
3.0
WA AVG
6.9
Rank
#3 / 91 | 1 | 93 |
31
Facility
31
WA AVG
51
Rank
#469 / 628 | - | $16.7M
Facility
$16.7M
WA AVG
$13.2M
Rank
#33 / 93 | $7.3M
Facility
$7.3M
WA AVG
$5.7M
Rank
#38 / 93 | 43.5%
Facility
43.5%
WA AVG
45.5%
Rank
#60 / 93 | 505299 | ||||
| Willapa Harbor Care |
NH Nursing Home Licensed facility providing 24/7 skilled nursing care for residents with complex, ongoing medical needs. Staffed by RNs, LPNs, and CNAs. Inspected and star-rated annually by CMS. Accepts Medicare (short-term rehab) and Medicaid (long-term care). | Raymond | 60
Facility
60
WA AVG
82
Rank
#246 / 366 |
60.5%
Facility
60.5%
WA AVG
72.5%
Rank
#245 / 310 | -17% | 3.91
Facility
3.91
WA AVG
4.22
Rank
#58 / 89 | -19% | -7% | $0
Facility
$0
WA AVG
$87.7k
Rank
#1 / 91 | 30
Facility
30
WA AVG
48.9
Rank
#17 / 91 | 7.5
Facility
7.5
WA AVG
6.9
Rank
#57 / 91 | - | 46 |
13
Facility
13
WA AVG
51
Rank
#570 / 628 | Tashina Mcneley | $1.7M
Facility
$1.7M
WA AVG
$13.2M
Rank
#93 / 93 | $637.6k
Facility
$637.6k
WA AVG
$5.7M
Rank
#93 / 93 | 37.2%
Facility
37.2%
WA AVG
45.5%
Rank
#78 / 93 | 505349 | ||||
| Olympia Transitional Care and Rehabilitation |
NH Nursing Home Licensed facility providing 24/7 skilled nursing care for residents with complex, ongoing medical needs. Staffed by RNs, LPNs, and CNAs. Inspected and star-rated annually by CMS. Accepts Medicare (short-term rehab) and Medicaid (long-term care).
AL Assisted Living A licensed, long-term care setting for seniors or individuals with disabilities who need help with daily activities — like bathing, dressing, and medication management — but not 24-hour skilled nursing. Offers housing, meals, and around-the-clock support while aiming to maximize resident independence.
IL Independent Living Lifestyle-focused communities for older adults offering dining, activities, and transportation with minimal personal care. Best for active, independent seniors who want community without medical support.
MC Memory Care Secured, specialized care for people living with Alzheimer's or dementia. Staff trained in cognitive impairment, with higher staff-to-resident ratios and an environment designed to reduce confusion and wandering risk. | Olympia | 113
Facility
113
WA AVG
82
Rank
#63 / 366 |
61.7%
Facility
61.7%
WA AVG
72.5%
Rank
#242 / 310 | -15% | 4.47
Facility
4.47
WA AVG
4.22
Rank
#17 / 89 | -53% | +6% | $0
Facility
$0
WA AVG
$87.7k
Rank
#1 / 91 | 29
Facility
29
WA AVG
48.9
Rank
#13 / 91 | 4.1
Facility
4.1
WA AVG
6.9
Rank
#10 / 91 | 1 | 81 |
38
Facility
38
WA AVG
51
Rank
#420 / 628 | Joel Smith | $16.3M
Facility
$16.3M
WA AVG
$13.2M
Rank
#34 / 93 | $9.1M
Facility
$9.1M
WA AVG
$5.7M
Rank
#24 / 93 | 55.6%
Facility
55.6%
WA AVG
45.5%
Rank
#28 / 93 | 505243 | ||||
| Avamere Olympic Rehabilitation of Sequim |
NH Nursing Home Licensed facility providing 24/7 skilled nursing care for residents with complex, ongoing medical needs. Staffed by RNs, LPNs, and CNAs. Inspected and star-rated annually by CMS. Accepts Medicare (short-term rehab) and Medicaid (long-term care).
AL Assisted Living A licensed, long-term care setting for seniors or individuals with disabilities who need help with daily activities — like bathing, dressing, and medication management — but not 24-hour skilled nursing. Offers housing, meals, and around-the-clock support while aiming to maximize resident independence.
IL Independent Living Lifestyle-focused communities for older adults offering dining, activities, and transportation with minimal personal care. Best for active, independent seniors who want community without medical support.
MC Memory Care Secured, specialized care for people living with Alzheimer's or dementia. Staff trained in cognitive impairment, with higher staff-to-resident ratios and an environment designed to reduce confusion and wandering risk. | Sequim | 90
Facility
90
WA AVG
82
Rank
#134 / 366 |
83.2%
Facility
83.2%
WA AVG
72.5%
Rank
#92 / 310 | +15% | 4.28
Facility
4.28
WA AVG
4.22
Rank
#27 / 89 | +24% | +1% | $95.2k
Facility
$95.2k
WA AVG
$87.7k
Rank
#43 / 91 | 41
Facility
41
WA AVG
48.9
Rank
#35 / 91 | 3.4
Facility
3.4
WA AVG
6.9
Rank
#5 / 91 | 2 | 71 |
16
Facility
16
WA AVG
51
Rank
#554 / 628 | - | $15.3M
Facility
$15.3M
WA AVG
$13.2M
Rank
#36 / 93 | $7.1M
Facility
$7.1M
WA AVG
$5.7M
Rank
#41 / 93 | 46.3%
Facility
46.3%
WA AVG
45.5%
Rank
#54 / 93 | 505327 | ||||
| Woodard Creek Health & Rehabilitation |
NH Nursing Home Licensed facility providing 24/7 skilled nursing care for residents with complex, ongoing medical needs. Staffed by RNs, LPNs, and CNAs. Inspected and star-rated annually by CMS. Accepts Medicare (short-term rehab) and Medicaid (long-term care).
HC Home Care Professional care delivered in the person's own home — from companionship and errands to skilled nursing and therapy. Allows seniors to age in place. Medicare covers skilled home health when medically necessary. | Olympia (Ensign Road Northeast) | 152
Facility
152
WA AVG
82
Rank
#15 / 366 | - | - | 4.30
Facility
4.30
WA AVG
4.22
Rank
#27 / 89 | -2% | +2% | $12.7k
Facility
$12.7k
WA AVG
$87.7k
Rank
#1 / 91 | 65
Facility
65
WA AVG
48.9
Rank
#64 / 91 | 7.2
Facility
7.2
WA AVG
6.9
Rank
#54 / 91 | - | 99 |
29
Facility
29
WA AVG
51
Rank
#483 / 628 | Rachel Erickson | $22.3M
Facility
$22.3M
WA AVG
$13.2M
Rank
#21 / 93 | $11.7M
Facility
$11.7M
WA AVG
$5.7M
Rank
#15 / 93 | 52.6%
Facility
52.6%
WA AVG
45.5%
Rank
#32 / 93 | 505387 |
Willapa Harbor Care has a walk score of 13. Car-dependent. Most errands require a car, with limited nearby walkable options.
Willapa Harbor Care's occupancy is 60.5%.
Yes — there are 16 photos of Willapa Harbor Care in the photo gallery on this page.
(360) 942-2424 will put you in contact with the team at Willapa Harbor Care.
Yes — Willapa Harbor Care is a CMS-certified provider of Medicare and Medicaid.
Care Cost Calculator: See Prices in Your Area
Nursing Home Data Explorer
Don’t Wait Too Long: 7 Red Flag Signs Your Parent Needs Assisted Living Now
The True Cost of Assisted Living in 2025 – And How Families Are Paying For It
Understanding Senior Living Costs: Pricing Models, Discounts & Financial Assistance


Thank you for your interest!
Our team will be in touch shortly to help with next steps.
