Puget Health Care Center
Nursing Home · Olympia, WA
CMS overall rating Info The Overall CMS Rating is scored from 1 to 5 stars and combines results from health inspections, staffing levels, and quality measures. Health inspections carry the most weight. Staffing and quality scores can increase or decrease the final rating based on performance compared to state and national standards.

Puget Health Care Center

Nursing Home · Olympia, WA
CMS overall rating Info The Overall CMS Rating is scored from 1 to 5 stars and combines results from health inspections, staffing levels, and quality measures. Health inspections carry the most weight. Staffing and quality scores can increase or decrease the final rating based on performance compared to state and national standards.
Calculator: See prices in your area
Puget Health Care Center accepts Medicare, Medicaid, and private pay.

Overview of Puget Health Care Center

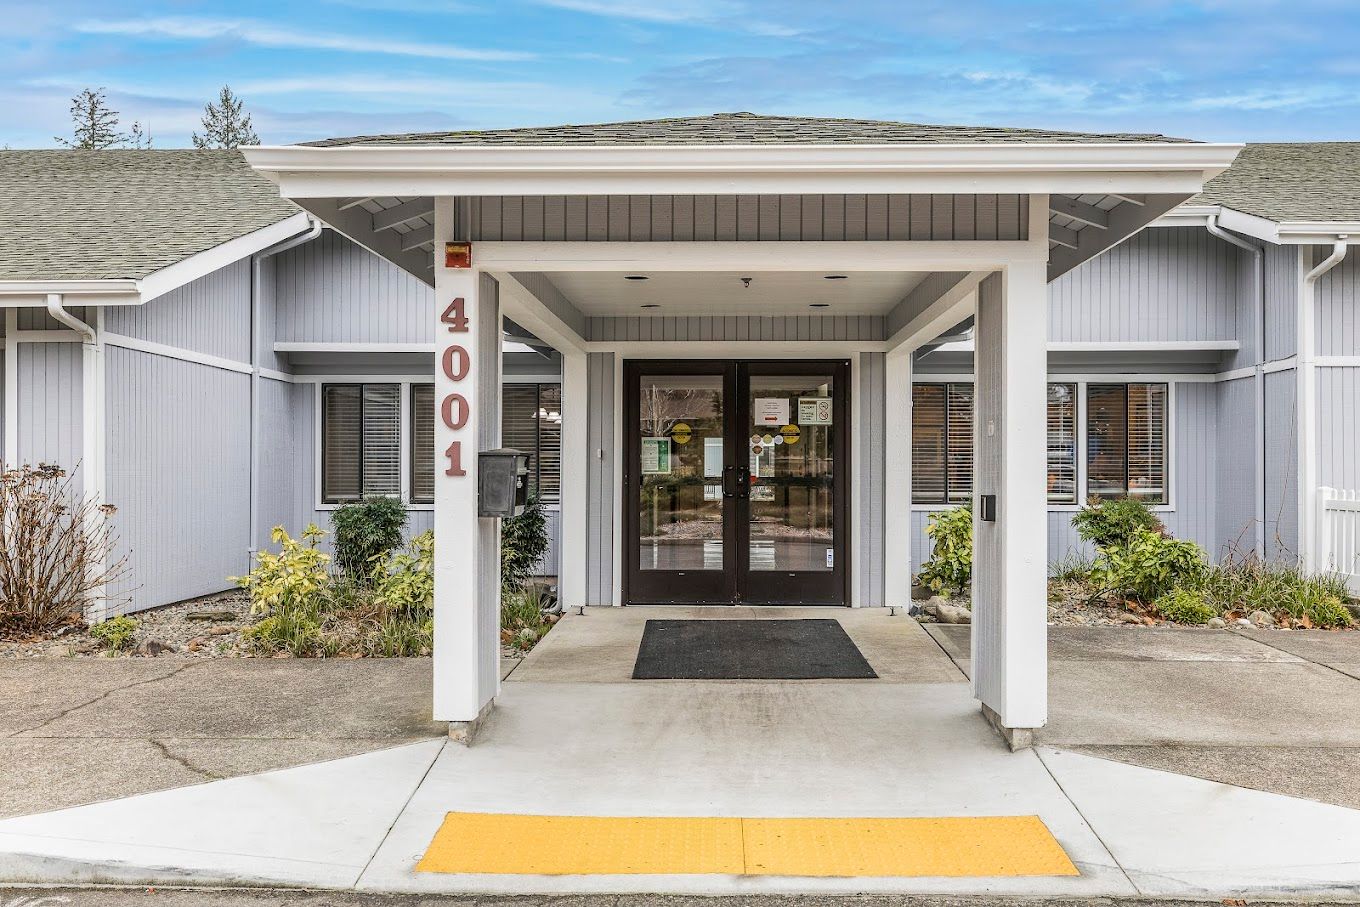
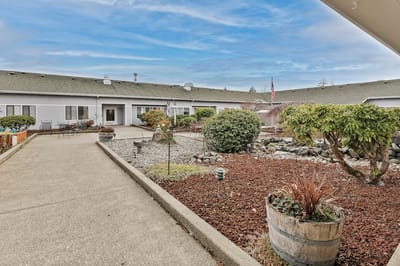
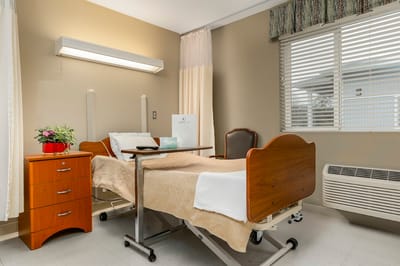
Based in the area of Olympia, WA, Puget Sound Care is a reliable senior care provider, offering extensive short-term rehab and long-term skilled nursing care. Residents here enjoy their peace of mind, knowing that a reliable care team is always available to care for their needs and provide support with anything they may need support with. The community goes above and beyond in providing resident-centered care and individualized treatment plans tailored to each individual’s needs.

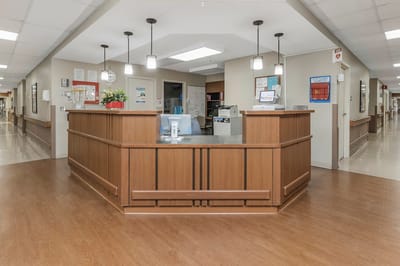
Guaranteeing a smooth recovery process for the residents, the community provides an excellent team of nurses, therapists, and physicians that work hard in guiding and supporting residents every step of the way. Residents are also offered a wide array of life-enrichment services designed to nurture their overall well-being, ensuring a fulfilling living or healing experience. Here, residents receive all the care they need in a comfortable, safe environment that promotes healing and rest.

(206) 428-3657

Quality ratings

Measured by Centers for Medicare & Medicaid Services (CMS)

Overall rating Info The Overall CMS Rating combines results from health inspections, staffing levels and quality measures. Health inspections carry the most weight. Staffing and quality scores can increase or decrease the final rating based on performance compared to state and national standards.
▲ 15.6% Above WA avg. ▲ 15.6% Above WA avg.Click the badge to see the full State ranking.Click here to see the full State ranking.
Health Inspection Info Based on the results of the facility's three most recent standard inspections and any complaint investigations. CMS reviews the number, scope, and severity of deficiencies, with more recent findings weighted more heavily.
▲ 38.9% Above WA avg. ▲ 38.9% Above WA avg.Click the badge to see the full State ranking.Click here to see the full State ranking.
Staffing Info Measures average nursing staff hours per resident per day, including Registered Nurses (RNs) and total nursing staff. Ratings are adjusted based on the level of care residents require and are compared to state and national benchmarks.
▼ 22.1% Below WA avg. ▼ 22.1% Below WA avg.Click the badge to see the full State ranking.Click here to see the full State ranking.
Quality Measures Info Based on clinical and physical health indicators reported to CMS, such as hospital readmissions, falls, pressure ulcers, and improvements in mobility. These measures reflect how well residents' health needs are being managed.
▼ 2.0% Below WA avg. ▼ 2.0% Below WA avg.Click the badge to see the full State ranking.Click here to see the full State ranking.

Staffing hours breakdown

Info Daily nursing hours per resident by staff type, reported to CMS. Higher is generally better — compare this facility to state and national averages to see where staffing stands.

Hours per resident per day — compared to Washington state averages

Total nursing care / resident Info This home is ranked 47th out of 89 homes in Washington. Total adjusted nursing hours per resident per day, combining RN, LPN, and aide time. CMS adjusts this for case-mix so facilities can be fairly compared.
4h 3m per day
Rank #47 / 89Nurse hours — State benchmarkedThis home is ranked 47th out of 89 homes in Washington. Shows adjusted nurse hours per resident per day benchmarked to the Washington average, with a ranking across 89 Washington SNFs. More hours mean more direct care. The national average is about 3.5 hrs; below 3.0 is a red flag.Click the rank badge to see the full State ranking.Click here to see the full State ranking.
This facility Washington avg (4h 22m per day)
vs Washington avg
-7%

3 of 6 metrics below state avg

Standout metric LPN / LVN is +8% above state avg
Staff typeHours / Day / Residentvs state avg
Registered Nurse (RN) Info RNs hold the highest nursing license and can assess residents, interpret test results, and direct care plans. More RN hours per day often signals stronger clinical oversight and faster response to health changes. 33m per day ▼ 38% State avg: 53m per day · National avg: 41m per day
LPN / LVN Info Licensed Practical Nurses (LPNs) or Licensed Vocational Nurses (LVNs) deliver routine hands-on care — medication administration, wound dressing, and monitoring vital signs. They work under RN supervision and make up a large share of daily bedside care. 53m per day ▲ 8% State avg: 49m per day · National avg: 52m per day
Nurse Aide Info Certified Nurse Aides (CNAs) provide the most direct day-to-day assistance: bathing, dressing, feeding, and mobility. Nurse aide hours are typically the largest staffing category and directly affect residents' quality of life. 2h 50m per day ▲ 6% State avg: 2h 41m per day · National avg: 2h 21m per day
Weekend Total Nursing Info Combined nursing hours (RN + LPN + Nurse Aide) per resident per day on weekends. Staffing often drops on weekends — this figure reveals whether the facility maintains adequate coverage outside of weekday hours. 3h 19m per day ▼ 13% State avg: 3h 47m per day · National avg: 3h 26m per day
Physical Therapist Info Hours per resident per day provided by licensed Physical Therapists (PTs) or PT Assistants. PT services help residents recover mobility after injury or illness and are especially important for post-acute (short-stay) rehabilitation. 5m per day ■ Avg State avg: 5m per day · National avg: 4m per day
Weekend RN Info Registered nurse hours specifically on weekends. Facilities sometimes reduce RN presence on Saturdays and Sundays — a low weekend RN figure compared to weekday hours can indicate reduced clinical oversight when most administrative staff are absent. 15m per day ▼ 61% State avg: 38m per day · National avg: 29m per day

Types of Care at Puget Health Care Center

Nursing Home

Capacity and availability

This home usually has limited availability

Occupancy between 85% and 95% suggests balanced demand.

Higher occupancy than the Washington average: 72.5%
Occupancy rate 89% Rank #51 / 310Occupancy rate — State benchmarkedThis home is ranked 51st out of 310 homes in Washington. Shows this facility's occupancy rate versus the Washington average, with its Statewide rank out of 310. Higher occupancy signals strong local demand and financial stability.Click the rank badge to see the full State ranking.Click here to see the full State ranking.
Avg. Length of Stay 88 days
Occupancy rate
89% Rank #51 / 310Occupancy rate — State benchmarkedThis home is ranked 51st out of 310 homes in Washington. Shows this facility's occupancy rate versus the Washington average, with its Statewide rank out of 310. Higher occupancy signals strong local demand and financial stability.Click the rank badge to see the full State ranking.Click here to see the full State ranking.
Avg. Length of Stay
88 days
Years in operation
39 years in operation Rank #15 / 133Years in operation — State benchmarkedThis home is ranked 15th out of 133 homes in Washington. Shows how long this facility has been in operation compared to other Washington SNFs. Longer operating histories may benefit residents, families, and staff.Click the rank badge to see the full State ranking.Click here to see the full State ranking.
A longer operating history, which may indicate experience navigating regulations and delivering ongoing care.
Walk Score
Walk Score: 31 / 100 Rank #469 / 628Walk Score — State benchmarkedThis home is ranked 469th out of 628 homes in Washington. Shows how walkable this facility's neighborhood is compared to the average Walk Score across Washington SNFs. Higher scores benefit residents, families, and staff.Click the rank badge to see the full State ranking.Click here to see the full State ranking.
Somewhat walkable. A few nearby services may be reachable on foot, but most trips require transportation.

License Details

CMS Certification Number505299

Staffing

Key information about the people who lead and staff this community.

Leadership

ContactMr. Jon Ollmann, Administrator

Contact Puget Health Care Center

Inspection History

In Washington, the Department of Social and Health Services, Residential Care Services conducts unannounced inspections and issues reports on the quality of care in all licensed settings.

Since 2022 · 4 years of data 20 deficiencies

Inspection Scorecard Info This scorecard compares key inspection, citation, and complaint metrics at this facility against the Washington state average. Metrics rated ≥15% worse than average are highlighted in red; those ≥15% better are highlighted in green.

Since 2022 vs. Washington state average
Overall vs. WA average 0 Worse No metrics in this bucket. 2 Better Metrics better than Washington average:
• Total deficiencies (35% below)
• Deficiencies per year (36% below)
Latest Inspection July 1, 2025 Routine

Deficiencies Info Deficiencies are formal regulatory issues recorded during state inspections.

This FacilityWA Averagevs. WA Avg
Total deficiencies Info Formal regulatory issues recorded by inspectors across all inspection types. 2031 This facility has 35% fewer total deficiencies than a typical Washington nursing home (20 vs. WA avg 31).↓ 35% better
Deficiencies per year Info Average deficiencies per year since 2022. 57.8 This facility has 36% fewer deficiencies per year than a typical Washington nursing home (5 vs. WA avg 7.8).↓ 36% better

Inspection Reports Summary Info An editor-reviewed summary of the themes and findings across this facility's recent inspection reports.

The most recent inspection on July 1, 2025, identified deficiencies related to food storage and sanitation in the kitchen area. Earlier inspections showed a pattern of issues including medication errors, resident care planning gaps, delayed meal service, and incomplete incident investigations. Inspectors cited recurring themes of food safety concerns and medication management problems, along with some deficiencies in resident care and investigation procedures. Complaint investigations mostly found unsubstantiated issues, except for a substantiated medication error that caused harm and hospitalization in early 2024. The facility’s inspection history shows ongoing challenges with food safety and medication practices, with no clear improvement trend.

Read the full inspection reports for this facility, including detailed findings and corrective actions.

Show Inspection Reports

Health Inspection History

Inspections since 2022
Total health inspections 6

Washington average 7.8


Last Health inspection on Jul 2025

Total health citations
18 Rank #7 / 91Health citations — State benchmarkedThis home is ranked 7th out of 91 homes in Washington. Shows this facility's total health deficiency citations benchmarked to the Washington State average, with a ranking across all 91 WA SNFs. Lower citation counts earn a better rank.Click the rank badge to see the full State ranking.Click here to see the full State ranking.

Washington average 48.9

Citations per inspection
3 Rank #3 / 91Citations per inspection — State benchmarkedThis home is ranked 3rd out of 91 homes in Washington. Shows average deficiency citations per CMS inspection for this facility versus the Washington mean across 91 SNFs with citation data. Lower is better.Click the rank badge to see the full State ranking.Click here to see the full State ranking.

Washington average 6.92


Health citations are formal notices following inspections when they fail to comply with safety and care standards.

15 of 18 citations resulted from standard inspections; and 3 of 18 resulted from complaint investigations.

Breakdown of citation severity (last 4 years)
Critical health citations
0
100% better than Washington average

Washington average: 0.3


Serious health citations
1
41% better than Washington average

Washington average: 1.7

0 critical citations Washington average: 0.3

1 serious citation Washington average: 1.7

17 moderate citations Washington average: 46.3

0 minor citations Washington average: 0.5
Citations history (last 4 years)
Nutrition moderate citation Jul 01, 2025
Corrected

Nutrition moderate citation Nov 07, 2024
Corrected

Quality of Care moderate citation Nov 07, 2024
Corrected

Quality of Care moderate citation Nov 07, 2024
Corrected

Staffing Data

Reporting period: October 1 – December 31, 2025 (Q4 2025). Source: CMS Payroll-Based Journal report.

Total staff 152
Employees 150
Contractors 2
Staff to resident ratio 1.60:1
14% worse than Washington average
Washington average ratio: 1.86:1 Washington average ratio: 1.86:1See full Washington ranking
Avg staff/day 55
Average shift 8 hours
0% compared with Washington average
Washington average: 8.1 hours Washington average shift: 8.1 hoursSee full Washington ranking
Total staff hours (quarter) 40,309

Nursing staff breakdown

Q4 2025 · Oct 1 – Dec 31 More info This data comes from the CMS Payroll-Based Journal report covering October 1 – December 31, 2025.
Registered Nurse

Manages medical care and health needs.

RN Staff 12
Average shift length Info Average shift length. Calculated as total hours divided by days worked and average staff per day. 9.7 hours

No contractors work on this role.

Licensed Practical Nurse

Assists with medical care and medications.

LPN Staff 20
Average shift length Info Average shift length. Calculated as total hours divided by days worked and average staff per day. 9.5 hours

No contractors work on this role.

Certified Nursing Assistant

Helps with daily care and mobility.

CNA Staff 60
Average shift length Info Average shift length. Calculated as total hours divided by days worked and average staff per day. 7.9 hours

No contractors work on this role.

Contractor staffing

Q4 2025 · Oct 1 – Dec 31 More info This data comes from the CMS Payroll-Based Journal report covering October 1 – December 31, 2025.

Total hours from contractors

0.2%

69 contractor hours this quarter

Medical Director: 1 Occupational Therapy Assistant: 1

Staff by category

Q4 2025 · Oct 1 – Dec 31 More info This data comes from the CMS Payroll-Based Journal report covering October 1 – December 31, 2025.
Certified Nursing Assistant6006018,56192100%7.9
Licensed Practical Nurse200204,41592100%9.5
Nurse Aide in Training220224,34192100%7.4
Registered Nurse120123,35492100%9.7
RN Director of Nursing6062,0199199%8.2
Other Dietary Services Staff2021,0107480%8.5
Clinical Nurse Specialist2029417784%7.4
Physical Therapy Aide3038527784%6.9
Speech Language Pathologist2027246975%6.4
Occupational Therapy Aide3037006672%7.6
Respiratory Therapy Technician8085986975%6.8
Administrator1015286672%8
Nurse Practitioner1015286672%8
Dental Services Staff1014626065%7.7
Mental Health Service Worker1014525964%7.7
Dietitian1013725358%7
Physical Therapy Assistant3032296470%3.4
Qualified Social Worker2021554953%3.2
Occupational Therapy Assistant0114589%5.6
Medical Director011241516%1.6
60 Certified Nursing Assistant
% of Days 100%
20 Licensed Practical Nurse
% of Days 100%
22 Nurse Aide in Training
% of Days 100%
12 Registered Nurse
% of Days 100%
6 RN Director of Nursing
% of Days 99%
2 Other Dietary Services Staff
% of Days 80%
2 Clinical Nurse Specialist
% of Days 84%
3 Physical Therapy Aide
% of Days 84%
2 Speech Language Pathologist
% of Days 75%
3 Occupational Therapy Aide
% of Days 72%
8 Respiratory Therapy Technician
% of Days 75%
1 Administrator
% of Days 72%
1 Nurse Practitioner
% of Days 72%
1 Dental Services Staff
% of Days 65%
1 Mental Health Service Worker
% of Days 64%
1 Dietitian
% of Days 58%
3 Physical Therapy Assistant
% of Days 70%
2 Qualified Social Worker
% of Days 53%
1 Occupational Therapy Assistant
% of Days 9%
1 Medical Director
% of Days 16%

Penalties and fines

Includes penalties issued in 2024

Federal penalties imposed by CMS for regulatory violations, including civil money penalties (fines) and denials of payment for new Medicare/Medicaid admissions.

Source: CMS Penalties Database (Data as of Jan 2026)

Total fines amount $8K Rank #31 / 91Federal fines — State benchmarkedThis home is ranked 31st out of 91 homes in Washington. Shows this facility's cumulative CMS federal fine dollars versus the Washington average among facilities with fines, and where it ranks among 91 skilled nursing facilities in the pool. Lower total dollars mean a better rank.Click the rank badge to see the full State ranking.Click here to see the full State ranking.
90% lower than Washington average

Washington average: $82K

Number of fines 1
46% fewer fines than Washington average

Washington average: 1.8

Payment Denials Info Serious action where Medicare and/or Medicaid temporarily stops payments for new residents until issues are fixed. 0
100% fewer payment denials than Washington average

Washington average: 0.3

Fines amount comparison
This facility $8K
Washington average $82K
Penalty History

Penalties are imposed by CMS for violations of federal nursing home regulations.

1 penalty in the past 3 years

Mar 28, 2024 · $8K

Civil Money Penalty Info Fines imposed for noncompliance, which can be assessed per day or per instance of violation. Mar 28, 2024
$8K

Last updated: Jan 2026

Quality of care over time

These measures show how residents usually do over time at this home, based on health outcomes and preventive care.

High-risk clinical events score Info A composite score based on pressure ulcers, falls with injury, weight loss, walking ability decline, and activities of daily living decline. 13.9
38% worse than Washington average

Washington average: 10.0

Functional decline score Info A composite score based on activities of daily living decline, walking ability decline, and incontinence. 23.4
12% worse than Washington average

Washington average: 20.9

Long-stay resident measures
Above average Washington avg: 3.6 Info CMS star rating based on long-stay quality measure performance. 5 stars = significantly above average, 1 star = significantly below average.
Need for Help with Daily Activities Increased Info Percent of long-stay residents whose need for help with daily activities has increased 21.8%
33% worse than Washington average

Washington average: 16.4%

Walking Ability Worsened Info Percent of long-stay residents whose ability to move independently worsened 19.1%
12% better than Washington average

Washington average: 21.8%

Low Risk Residents with Bowel/Bladder Incontinence Info Percent of low risk long-stay residents who lose control of their bowels or bladder 29.3%
21% worse than Washington average

Washington average: 24.3%

Falls with Major Injury Info Percent of long-stay residents experiencing one or more falls with major injury 1.7%
34% better than Washington average

Washington average: 2.6%

High Risk Residents with Pressure Ulcers Info Percent of long-stay high risk residents with pressure ulcers 9.3%
88% worse than Washington average

Washington average: 4.9%

Urinary Tract Infection Info Percent of long-stay residents with a urinary tract infection 5.7%
227% worse than Washington average

Washington average: 1.7%

Lost Too Much Weight Info Percent of long-stay residents who lose too much weight 17.5%
201% worse than Washington average

Washington average: 5.8%

Depressive Symptoms Info Percent of long-stay residents who have depressive symptoms 5.3%
67% better than Washington average

Washington average: 16.2%

Antipsychotic Use Info Percent of long-stay residents who received an antipsychotic medication 15.6%
8% worse than Washington average

Washington average: 14.5%

Pneumococcal Vaccine Info Percent of long-stay residents assessed and appropriately given the pneumococcal vaccine 96.2%
In line with Washington average

Washington average: 96.2%

Influenza Vaccine Info Percent of long-stay residents assessed and appropriately given the seasonal influenza vaccine 92.9%
In line with Washington average

Washington average: 93.8%

Hospitalizations per 1,000 days Info Number of hospitalizations per 1,000 long-stay resident days. 0.92
33% better than Washington average

Washington average: 1.38

ED visits per 1,000 days Info Number of outpatient emergency department visits per 1,000 long-stay resident days. 0.73
52% better than Washington average

Washington average: 1.51

Short-stay resident measures
Above average Washington avg: 3.6 Info CMS star rating based on short-stay quality measure performance. 5 stars = much above average, 1 star = much below average.
Pneumococcal Vaccine Info Percent of short-stay residents assessed and appropriately given the pneumococcal vaccine 80.9%
8% worse than Washington average

Washington average: 88.1%

Antipsychotic medication increase Info Percent of short-stay residents who newly received an antipsychotic medication 1.4%
In line with Washington average

Washington average: 1.4%

Influenza Vaccine Info Percent of short-stay residents assessed and appropriately given the seasonal influenza vaccine 67.5%
18% worse than Washington average

Washington average: 82.0%

Re-hospitalized after SNF stay Info Percentage of short-stay residents who were re-hospitalized after their nursing home admission. 21.8%
10% worse than Washington average

Washington average: 19.9%

Emergency department visits Info Percentage of short-stay residents who had an outpatient emergency department visit. 14.8%
12% worse than Washington average

Washington average: 13.2%

Falls with major injury Info Percentage of SNF residents who experience falls with major injury during their stay. 0.5%
38% better than Washington average

Washington average: 0.8%

Ability to care for self at discharge Info Percentage of residents at or above expected ability to care for themselves at discharge. 40.4%
25% worse than Washington average

Washington average: 53.7%

Successful return to home or community Info Rate of successful return to home or community from a skilled nursing facility. 55.1%
9% better than Washington average

Washington average: 50.6%

Breakdown by payment type

Medicare

53% of new residents, usually for short-term rehab.

Typical stay 26 days

Private pay

42% of new residents, often for short stays.

Typical stay 1 months

Medicaid

5% of new residents, often for long-term daily care.

Typical stay 3 years

Facility Characteristics

Source: CMS Long-Term Care Facility Characteristics (Data as of Jan 2026)

Total residents 95
Medicare
21
22.1% of residents
Medicaid
72
75.8% of residents
Private pay or other
2
2.1% of residents
Programs & Services
Residents Group

Residents meet regularly to discuss policies, care quality, and activities

Nurse Aide Training

State-approved Nurse Aide Training and Competency Evaluation Program on-site

Active Resident Council

Organized group of residents that meets regularly to discuss facility policies, quality of life, and activities.

Finances and operations

Privately-owned community
Operated by a business corporation.
Home revenue
$16.7M
Profit
$2.5M
Privately-owned community Operated by a business corporation.
Home revenue
$16.7M Rank #33 / 93Revenue — State benchmarkedThis home is ranked 33rd out of 93 homes in Washington. Shows this facility's annual revenue compared to the Washington SNF average. Higher revenue generally means more resources for staffing and capital — read alongside Payroll %.Click the rank badge to see the full State ranking.Click here to see the full State ranking.
Profit
$2.5M
Payroll costs Info The portion of the home's budget spent on staff, including nurses, caregivers, and other employees who support care and operations. Rank #38 / 93Payroll — State benchmarkedThis home is ranked 38th out of 93 homes in Washington. Shows total annual staff payroll benchmarked to the Washington average. Higher payroll investment relative to peers often signals better staffing and less reliance on cheaper contract labor.Click the rank badge to see the full State ranking.Click here to see the full State ranking.
$7.3M
43.5% of revenue Rank #60 / 93Payroll % — State benchmarkedThis home is ranked 60th out of 93 homes in Washington. Shows payroll as a percentage of revenue versus the Washington average. Well-run Washington SNFs typically land around 53–61% — the top third Statewide. Below 25% may signal understaffing or heavy agency use — read with Staffing ratings.Click the rank badge to see the full State ranking.Click here to see the full State ranking.
Other operating costs Info All remaining costs needed to run the home, such as food, utilities, building maintenance, supplies and administrative expenses.
$6.9M
Total costs $14.2M

What does this home offer?

Total residents icon

Total Residents: 108

Building type icon
Building type icon

Building Type: Single-story

Who this home usually serves

TYPE OF STAY

Mostly short-term rehab stays

Most residents typically stay for a few weeks or months before returning home or moving on.

Places of interest near Puget Health Care Center

Address 3.4 miles from city center Info Estimated distance in miles from Olympia's city center to Puget Health Care Center's address, calculated via Google Maps. — 0.13 miles to nearest hospital (MultiCare Capital Medical Center)

Calculate Travel Distance to Puget Health Care Center

Add your location

Address

Financial Assistance for
Nursing Home in Washington

Puget Health Care Center is located in Olympia, Washington.
Here are the financial assistance programs available to residents in Washington.

Get Financial aid guidance

Community Options Program Entry System (COPES)

WA Medicaid COPES

Age 65+ or disabled
General Washington resident, Medicaid-eligible, nursing home-level care need.
Income Limits (2025) ~$2,829/month 300% FBR, individual
Asset Limits $2,000 (individual), $3,000 (couple).
WA

High demand in urban areas (e.g., Seattle).

Benefits
Personal care (5-7 hours/day) Respite (240 hours/year) Adult day care ($70/day) Home modifications ($1,500 avg.)

Washington Family Caregiver Support Program

WA NFCSP

Age Caregiver of someone 60+ (or with dementia)
General Washington resident.
Income Limits No strict limit; prioritizes low-income.
Asset Limits Not applicable.
WA

High urban demand; rural outreach.

Benefits
In-home respite (4-6 hours/day) Adult day care (~$70/day) Short-term facility care (up to 5 days)

Community First Choice (CFC)

Washington Community First Choice

Age 65+ (or disabled 18+)
General WA resident, Medicaid-eligible, need help with 2+ ADLs/IADLs.
Income Limits (2025) ~$2,829/month; QIT optional.
Asset Limits $2,000 (individual), $3,000 (couple).
WA

Broader than COPES; serves ~20,000; self-directed option.

Benefits
Personal care (4-6 hours/day) Respite (~240 hours/year) Assistive devices Training Transportation

Older Americans Act (OAA) Services

Washington OAA Services

Age 60+
General WA resident; no income/asset limits.
Income Limits (2025) None; donations encouraged.
Asset Limits Not assessed.
WA

13 AAAs; includes Meals on Wheels; rural focus.

Benefits
Meals (~$5-$7/meal) Transportation Homemaker services (~4 hours/week) Respite (~5 days/year) Legal aid

Medicare Savings Program (MSP)

Washington Medicare Savings Program

Age 65+ or disabled
General WA resident, Medicare Part A/B.
Income Limits (2025) ~$2,510/month (QMB), ~$3,380/month (SLMB), ~$3,598/month (QI)—individual.
Asset Limits $9,430 (individual), $14,130 (couple).
WA

Includes Extra Help for Part D; no waitlist.

Benefits
Covers Part B premiums ($174.70/month) Deductibles ($240/year) Copays (~20%)

VA Aid and Attendance (A&A) and Housebound Benefits

Washington VA Aid and Attendance/Housebound

Age 65+ or disabled veteran/spouse
General WA resident, wartime service, ADL help (A&A) or homebound.
Income Limits (2025) Net income < ~$1,984/month (veteran with dependent, A&A); pension offsets income.
Asset Limits ~$155,356 net worth
WA

High veteran use; supports rural/urban needs.

Benefits
Cash (~$1,433-$2,642/month veteran, ~$951-$1,318 spouse) for care costs

Senior Citizens Property Tax Exemption

Washington Senior Property Tax Exemption

Age 61+ or disabled retiree
General WA resident, homeowner, income-based.
Income Limits (2025) ~$45,000-$70,000/year varies by county, e.g., King: $70,000
Asset Limits Not assessed; home value cap varies ~$250,000-$400,000
WA

Saves ~$500-$1,500/year; offered statewide.

Benefits
Tax exemption (~$500-$1,500/year depending on county)

Senior Farmers’ Market Nutrition Program (SFMNP)

Washington SFMNP

Age 60+
General WA resident, low-income.
Income Limits (2025) ~$2,322/month 185% FPL
Asset Limits Not assessed.
WA

Vouchers (~$80/season); serves ~20,000 via AAAs.

Benefits
Vouchers (~$80/season) for produce at farmers’ markets

Compare Nursing Home around Olympia

The information below is reported by the Washington Department of Social and Health Services, Residential Care Services.

5 facilities compared · CMS & WA Dept. of Health data

Filter by care type
Willapa Harbor Care
NH

Nursing Home Licensed facility providing 24/7 skilled nursing care for residents with complex, ongoing medical needs. Staffed by RNs, LPNs, and CNAs. Inspected and star-rated annually by CMS. Accepts Medicare (short-term rehab) and Medicaid (long-term care).

Raymond60 60.5% -17%3.91 -19%-7%$0307.5-41 13 Tashina Mcneley$1.7M$637.6k37.2%505349
Penrose Harbor at Heron‘s Key
NH

Nursing Home Licensed facility providing 24/7 skilled nursing care for residents with complex, ongoing medical needs. Staffed by RNs, LPNs, and CNAs. Inspected and star-rated annually by CMS. Accepts Medicare (short-term rehab) and Medicaid (long-term care).

AL

Assisted Living A licensed, long-term care setting for seniors or individuals with disabilities who need help with daily activities — like bathing, dressing, and medication management — but not 24-hour skilled nursing. Offers housing, meals, and around-the-clock support while aiming to maximize resident independence.

Gig Harbor49 69.7% -4%5.88 +46%+39%$15.0k338.3120 36 Herons Key$25.6M$7.8M30.3%505531
Puget Health Care Center
NH

Nursing Home Licensed facility providing 24/7 skilled nursing care for residents with complex, ongoing medical needs. Staffed by RNs, LPNs, and CNAs. Inspected and star-rated annually by CMS. Accepts Medicare (short-term rehab) and Medicaid (long-term care).

AL

Assisted Living A licensed, long-term care setting for seniors or individuals with disabilities who need help with daily activities — like bathing, dressing, and medication management — but not 24-hour skilled nursing. Offers housing, meals, and around-the-clock support while aiming to maximize resident independence.

IL

Independent Living Lifestyle-focused communities for older adults offering dining, activities, and transportation with minimal personal care. Best for active, independent seniors who want community without medical support.

MC

Memory Care Secured, specialized care for people living with Alzheimer's or dementia. Staff trained in cognitive impairment, with higher staff-to-resident ratios and an environment designed to reduce confusion and wandering risk.

Olympia (Capital Mall Drive Southwest)108 89.0% +23%4.06 -45%-4%$8.0k183.0195 31 -$16.7M$7.3M43.5%505299
Olympia Transitional Care and Rehabilitation
NH

Nursing Home Licensed facility providing 24/7 skilled nursing care for residents with complex, ongoing medical needs. Staffed by RNs, LPNs, and CNAs. Inspected and star-rated annually by CMS. Accepts Medicare (short-term rehab) and Medicaid (long-term care).

AL

Assisted Living A licensed, long-term care setting for seniors or individuals with disabilities who need help with daily activities — like bathing, dressing, and medication management — but not 24-hour skilled nursing. Offers housing, meals, and around-the-clock support while aiming to maximize resident independence.

IL

Independent Living Lifestyle-focused communities for older adults offering dining, activities, and transportation with minimal personal care. Best for active, independent seniors who want community without medical support.

MC

Memory Care Secured, specialized care for people living with Alzheimer's or dementia. Staff trained in cognitive impairment, with higher staff-to-resident ratios and an environment designed to reduce confusion and wandering risk.

Olympia135 61.7% -15%4.47 -53%+6%$0294.1181 38 Joel Smith$16.3M$9.1M55.6%505243
Woodard Creek Health & Rehabilitation
NH

Nursing Home Licensed facility providing 24/7 skilled nursing care for residents with complex, ongoing medical needs. Staffed by RNs, LPNs, and CNAs. Inspected and star-rated annually by CMS. Accepts Medicare (short-term rehab) and Medicaid (long-term care).

HC

Home Care Professional care delivered in the person's own home — from companionship and errands to skilled nursing and therapy. Allows seniors to age in place. Medicare covers skilled home health when medically necessary.

Olympia (Ensign Road Northeast)152 58.7% -19%4.30 -2%+2%$0657.2-92 29 Rachel Erickson$22.3M$11.7M52.6%505387

Frequently Asked Questions about Puget Health Care Center

What neighborhood is Puget Health Care Center in?

Puget Health Care Center is in the Capital Mall Drive Southwest neighborhood of Olympia.

Is Puget Health Care Center in a walkable area?

Puget Health Care Center has a walk score of 31. Somewhat walkable. A few nearby services may be reachable on foot, but most trips require transportation.

What is the address of Puget Health Care Center?

Puget Health Care Center is located at 4001 Capital Mall Dr SW, Olympia, WA 98502, United States.

What is the phone number of Puget Health Care Center?

(206) 428-3657 will put you in contact with the team at Puget Health Care Center.

Is Puget Health Care Center Medicare or Medicaid certified?

Yes — Puget Health Care Center is a CMS-certified provider of Medicare and Medicaid.

Guides for Better Senior Living

Care Cost Calculator: See Prices in Your Area

Nursing Home Data Explorer

Don’t Wait Too Long: 7 Red Flag Signs Your Parent Needs Assisted Living Now

The True Cost of Assisted Living in 2025 – And How Families Are Paying For It

Understanding Senior Living Costs: Pricing Models, Discounts & Financial Assistance

Explore Open Rooms
1 Contact details
2 What type of senior care service are you looking for?
3 What budget do you have in mind for senior care?
4 How soon do you need to find care?
5 Additional details

Thank you for your interest!

Our team will be in touch shortly to help with next steps.