Willapa Harbor Care
CMS overall rating Info CMS (the Centers for Medicare & Medicaid Services) is the federal agency that rates nursing home quality. Its Overall Rating runs from 1 to 5 stars, combining health inspections, staffing, and quality measures, with inspections weighted most heavily.

Willapa Harbor Care

CMS overall rating Info CMS (the Centers for Medicare & Medicaid Services) is the federal agency that rates nursing home quality. Its Overall Rating runs from 1 to 5 stars, combining health inspections, staffing, and quality measures, with inspections weighted most heavily.
Calculator: See prices in your area
Willapa Harbor Care accepts Medicare, Medicaid, and private pay.

Overview of Willapa Harbor Care

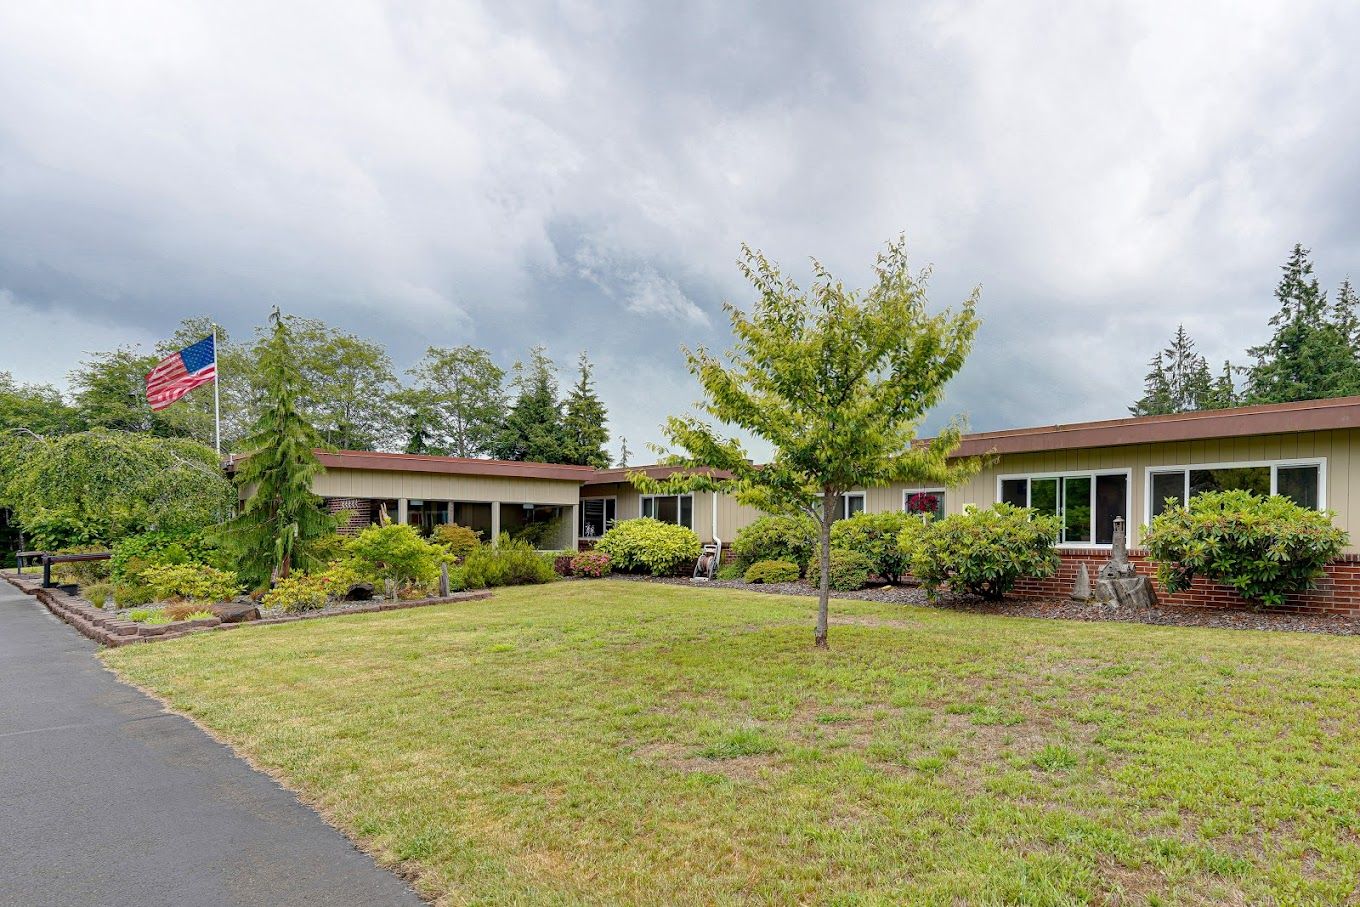
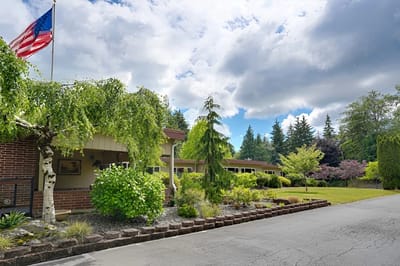
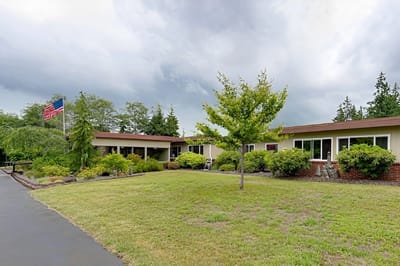
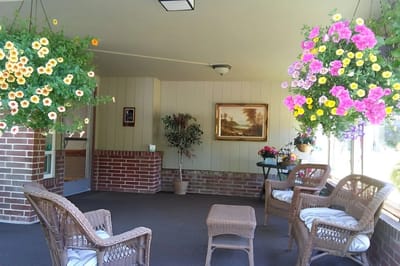
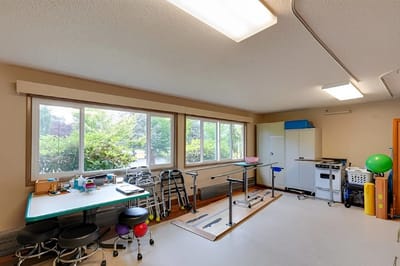
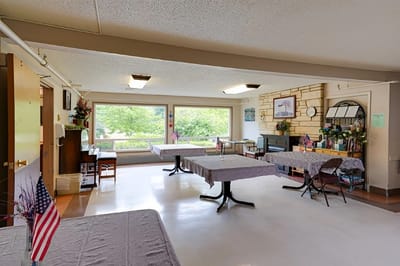
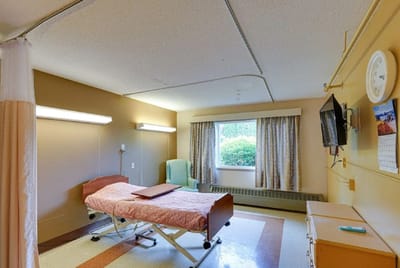
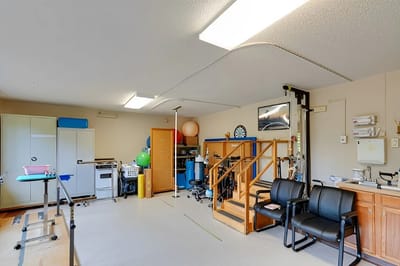
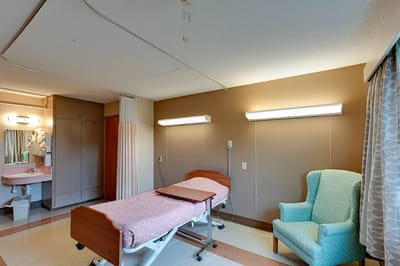
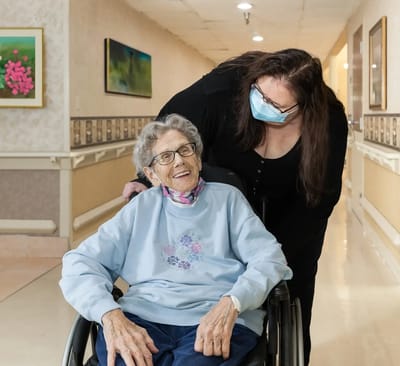
Delivering exceptional care for over 75 years, Willapa Harbor Care situated on Jackson Street, Raymond, WA, provides short-term rehab, long-term skilled nursing, and therapy services. Featuring physical, speech, and occupational therapies, the community ensures seniors’ well-being. Keep your peace of mind and live a maintenance-free lifestyle with round-the-clock care and support provided by a kind and compassionate team.

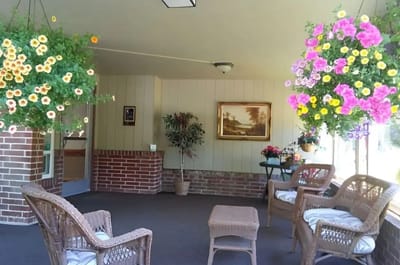
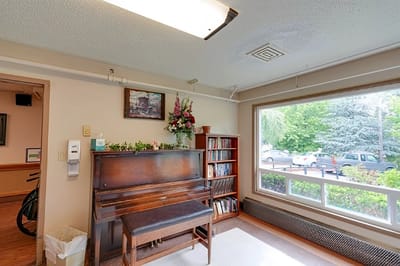
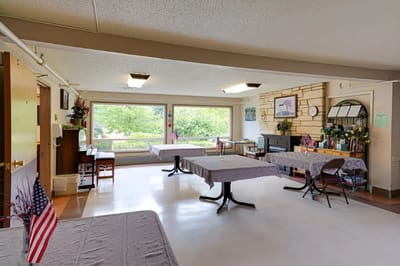
The community fosters a vibrant environment, conducting wellness-focused activities to ensure seniors remain happy and active. Moreover, Willapa Harbor Care values the importance of healthy and balanced meals for seniors’ well-being, providing them with nutritional support to meet their dietary needs. Experience relaxation at its finest with the peaceful and safe community of Willapa Harbor Care.

Quality ratings

Measured by Centers for Medicare & Medicaid Services (CMS)

Overall rating Info The Overall CMS Rating combines results from health inspections, staffing levels and quality measures. Health inspections carry the most weight. Staffing and quality scores can increase or decrease the final rating based on performance compared to state and national standards.
▲ 24.0% Above WA avg. ▲ 24.0% Above WA avg.WA average: 3.2Click the badge to see the full State ranking.Click here to see the full State ranking.
Health Inspection Info Based on the results of the facility's three most recent standard inspections and any complaint investigations. CMS reviews the number, scope, and severity of deficiencies, with more recent findings weighted more heavily.
▲ 42.1% Above WA avg. ▲ 42.1% Above WA avg.WA average: 2.8Click the badge to see the full State ranking.Click here to see the full State ranking.
Staffing Info Measures average nursing staff hours per resident per day, including Registered Nurses (RNs) and total nursing staff. Ratings are adjusted based on the level of care residents require and are compared to state and national benchmarks.
▼ 41.6% Below WA avg. ▼ 41.6% Below WA avg.WA average: 3.4Click the badge to see the full State ranking.Click here to see the full State ranking.
Quality Measures Info Based on clinical and physical health indicators reported to CMS, such as hospital readmissions, falls, pressure ulcers, and improvements in mobility. These measures reflect how well residents' health needs are being managed.
▲ 1.7% Above WA avg. ▲ 1.7% Above WA avg.WA average: 3.9Click the badge to see the full State ranking.Click here to see the full State ranking.

Staffing hours breakdown

Info Daily nursing hours per resident by staff type, reported to CMS. Higher is generally better — compare this facility to state and national averages to see where staffing stands.

Hours per resident per day — compared to Washington state averages

Total nursing care / resident Info This home is ranked 58th out of 90 homes in Washington for nurse hours. Total adjusted nursing hours per resident per day, combining RN, LPN, and aide time. CMS adjusts this for case-mix so facilities can be fairly compared.
3h 55m per day
Rank #58 / 90Nurse hours — State benchmarkedThis home is ranked 58th out of 90 homes in Washington. Shows adjusted nurse hours per resident per day benchmarked to the Washington average, with a ranking across 90 Washington facilities. More hours mean more direct care. The national average is about 3.5 hrs; below 3.0 is a red flag.Rankings are based only on facilities in Washington that report data for that category. Facilities without available data are excluded from the ranking.Click the rank badge to see the full State ranking.Click here to see the full State ranking.
This facility Washington avg (4h 13m per day)
vs Washington avg
-7%

5 of 6 metrics below state avg

Standout metric Physical Therapist is +18% above state avg
Staff typeHours / Day / Residentvs state avg
Registered Nurse (RN) Info RNs hold the highest nursing license and can assess residents, interpret test results, and direct care plans. More RN hours per day often signals stronger clinical oversight and faster response to health changes. 39m per day ▼ 27% State avg: 53m per day · National avg: 41m per day
LPN / LVN Info Licensed Practical Nurses (LPNs) or Licensed Vocational Nurses (LVNs) deliver routine hands-on care — medication administration, wound dressing, and monitoring vital signs. They work under RN supervision and make up a large share of daily bedside care. 34m per day ▼ 31% State avg: 49m per day · National avg: 52m per day
Nurse Aide Info Certified Nurse Aides (CNAs) provide the most direct day-to-day assistance: bathing, dressing, feeding, and mobility. Nurse aide hours are typically the largest staffing category and directly affect residents' quality of life. 2h 16m per day ▼ 15% State avg: 2h 41m per day · National avg: 2h 21m per day
Weekend Total Nursing Info Combined nursing hours (RN + LPN + Nurse Aide) per resident per day on weekends. Staffing often drops on weekends — this figure reveals whether the facility maintains adequate coverage outside of weekday hours. 2h 59m per day ▼ 21% State avg: 3h 47m per day · National avg: 3h 26m per day
Physical Therapist Info Hours per resident per day provided by licensed Physical Therapists (PTs) or PT Assistants. PT services help residents recover mobility after injury or illness and are especially important for post-acute (short-stay) rehabilitation. 6m per day ▲ 18% State avg: 5m per day · National avg: 4m per day
Weekend RN Info Registered nurse hours specifically on weekends. Facilities sometimes reduce RN presence on Saturdays and Sundays — a low weekend RN figure compared to weekday hours can indicate reduced clinical oversight when most administrative staff are absent. 21m per day ▼ 44% State avg: 38m per day · National avg: 29m per day

Capacity and availability

This home usually has availability

Lower occupancy than the Washington average: 72.5%
Occupancy rate
60.5% Rank #246 / 310Occupancy rate — State benchmarkedThis home is ranked 246th out of 310 homes in Washington. Shows this facility's occupancy rate versus the Washington average, with its Statewide rank out of 310. Higher occupancy signals strong local demand and financial stability.Rankings are based only on facilities in Washington that report data for that category. Facilities without available data are excluded from the ranking.Click the rank badge to see the full State ranking.Click here to see the full State ranking.
Avg. Length of Stay
101 days
Bed community size
60-bed community Rank #246 / 366Bed count — State benchmarkedThis home is ranked 246th out of 366 homes in Washington. Shows this facility's certified or reported bed count compared to other Washington facilities. Larger communities may offer more amenities, programs, and on-site services for residents and families.Rankings are based only on facilities in Washington that report data for that category. Facilities without available data are excluded from the ranking.Click the rank badge to see the full State ranking.Click here to see the full State ranking.
A moderately sized community that may balance personal attention with shared amenities and social activities.
Walk Score
Walk Score: 13 / 100 Rank #570 / 628Walk Score — State benchmarkedThis home is ranked 570th out of 628 homes in Washington. Shows how walkable this facility's neighborhood is compared to the average Walk Score across Washington facilities. Higher scores benefit residents, families, and staff.Rankings are based only on facilities in Washington that report data for that category. Facilities without available data are excluded from the ranking.Click the rank badge to see the full State ranking.Click here to see the full State ranking.
Car-dependent. Most errands require a car, with limited nearby walkable options.

Therapy & Rehabilitation

2 services
Rehabilitation Services
Short-Term Rehab

Staffing & Medical

1 service
24-Hour Staffing

Additional Services

2 services
Long-Term Skilled Nursing
Therapy Services

Amenities & Lifestyle

Specific ProgramsNutritional support, Wellness-focused activities
Touring HoursMon - Fri: 9:00AM - 5:00PM

Contact Willapa Harbor Care

Staffing Data

Reporting period: October 1 – December 31, 2025 (Q4 2025). Source: CMS Payroll-Based Journal report.

Total staff 95
Employees 59
Contractors 36
Staff to resident ratio 2.32 : 1
25% more staff per resident than Washington average
Washington average ratio: 1.86 : 1 Washington average ratio: 1.86 : 1See full Washington ranking
Avg staff/day 25
Average shift 8 hours
0% compared with Washington average
Washington average: 8.1 hours Washington average shift: 8.1 hoursSee full Washington ranking
Total staff hours (quarter) 18,503

Nursing staff breakdown

Q4 2025 · Oct 1 – Dec 31 More info This data comes from the CMS Payroll-Based Journal report covering October 1 – December 31, 2025.
Registered Nurse

Manages medical care and health needs.

RN Staff Info 11 total: 5 full-time employees and 6 contractors. 11
Average shift length Info Average shift length. Calculated as total hours divided by days worked and average staff per day. 9.1 hours
Licensed Practical Nurse

Assists with medical care and medications.

LPN Staff Info 22 total: 3 full-time employees and 19 contractors. 22
Average shift length Info Average shift length. Calculated as total hours divided by days worked and average staff per day. 9.3 hours
Certified Nursing Assistant

Helps with daily care and mobility.

CNA Staff Info 32 total: 24 full-time employees and 8 contractors. 32
Average shift length Info Average shift length. Calculated as total hours divided by days worked and average staff per day. 8.6 hours

Contractor staffing

Q4 2025 · Oct 1 – Dec 31 More info This data comes from the CMS Payroll-Based Journal report covering October 1 – December 31, 2025.

Total hours from contractors

10.3%

1,909 contractor hours this quarter

Licensed Practical Nurse: 19 Certified Nursing Assistant: 8 Registered Nurse: 6 Medical Director: 1 Occupational Therapy Assistant: 1 Occupational Therapy Aide: 1

Staff by category

Q4 2025 · Oct 1 – Dec 31 More info This data comes from the CMS Payroll-Based Journal report covering October 1 – December 31, 2025.
Certified Nursing Assistant248328,50092100%8.6
Licensed Practical Nurse319222,37092100%9.3
Registered Nurse56112,0249199%9.1
Nurse Aide in Training4041,1508188%8
Other Dietary Services Staff4041,08192100%7.2
Speech Language Pathologist2027136672%6.5
Administrator1015286672%8
Nurse Practitioner1015286672%8
Respiratory Therapy Technician3034165661%6.6
Mental Health Service Worker1014125155%8.1
Physical Therapy Aide1013846368%6.1
Clinical Nurse Specialist2021862022%9.3
Occupational Therapy Aide213731516%4.8
Physical Therapy Assistant202502729%1.8
Occupational Therapy Assistant0112778%3.9
Medical Director011241820%1.3
Qualified Social Worker3031978%2.7
RN Director of Nursing1011855%3.7
32 Certified Nursing Assistant
% of Days 100%
22 Licensed Practical Nurse
% of Days 100%
11 Registered Nurse
% of Days 99%
4 Nurse Aide in Training
% of Days 88%
4 Other Dietary Services Staff
% of Days 100%
2 Speech Language Pathologist
% of Days 72%
1 Administrator
% of Days 72%
1 Nurse Practitioner
% of Days 72%
3 Respiratory Therapy Technician
% of Days 61%
1 Mental Health Service Worker
% of Days 55%
1 Physical Therapy Aide
% of Days 68%
2 Clinical Nurse Specialist
% of Days 22%
3 Occupational Therapy Aide
% of Days 16%
2 Physical Therapy Assistant
% of Days 29%
1 Occupational Therapy Assistant
% of Days 8%
1 Medical Director
% of Days 20%
3 Qualified Social Worker
% of Days 8%
1 RN Director of Nursing
% of Days 5%

Penalties and fines

Federal penalties imposed by CMS for regulatory violations, including civil money penalties (fines) and denials of payment for new Medicare/Medicaid admissions.

Source: CMS Penalties Database

No penalties in the past 3 years

No civil money penalties or payment denials were reported in the last 3 years.

Quality of care over time

These measures show how residents usually do over time at this home, based on health outcomes and preventive care.

High-risk clinical events score Info A composite score based on pressure ulcers, falls with injury, weight loss, walking ability decline, and activities of daily living decline. 9.9
In line with Washington average

Washington average: 10.0

Functional decline score Info A composite score based on activities of daily living decline, walking ability decline, and incontinence. 20.7
In line with Washington average

Washington average: 20.9

Long-stay resident measures
Above average Washington avg: 3.6 Info CMS star rating based on long-stay quality measure performance. 5 stars = significantly above average, 1 star = significantly below average.
Need for Help with Daily Activities Increased Info Percent of long-stay residents whose need for help with daily activities has increased 15.7%
In line with Washington average

Washington average: 16.4%

Walking Ability Worsened Info Percent of long-stay residents whose ability to move independently worsened 26.4%
21% worse than Washington average

Washington average: 21.8%

Low Risk Residents with Bowel/Bladder Incontinence Info Percent of low risk long-stay residents who lose control of their bowels or bladder 20.0%
18% better than Washington average

Washington average: 24.3%

Falls with Major Injury Info Percent of long-stay residents experiencing one or more falls with major injury 0.8%
68% better than Washington average

Washington average: 2.6%

High Risk Residents with Pressure Ulcers Info Percent of long-stay high risk residents with pressure ulcers 4.7%
5% better than Washington average

Washington average: 4.9%

Urinary Tract Infection Info Percent of long-stay residents with a urinary tract infection 0.9%
51% better than Washington average

Washington average: 1.7%

Lost Too Much Weight Info Percent of long-stay residents who lose too much weight 1.9%
68% better than Washington average

Washington average: 5.8%

Depressive Symptoms Info Percent of long-stay residents who have depressive symptoms 4.4%
73% better than Washington average

Washington average: 16.2%

Antipsychotic Use Info Percent of long-stay residents who received an antipsychotic medication 7.9%
45% better than Washington average

Washington average: 14.5%

Pneumococcal Vaccine Info Percent of long-stay residents assessed and appropriately given the pneumococcal vaccine 100.0%
In line with Washington average

Washington average: 96.2%

Influenza Vaccine Info Percent of long-stay residents assessed and appropriately given the seasonal influenza vaccine 100.0%
7% better than Washington average

Washington average: 93.8%

Hospitalizations per 1,000 days Info Number of hospitalizations per 1,000 long-stay resident days. 0.82
41% better than Washington average

Washington average: 1.38

ED visits per 1,000 days Info Number of outpatient emergency department visits per 1,000 long-stay resident days. 2.91
93% worse than Washington average

Washington average: 1.51

Short-stay resident measures
Above average Washington avg: 3.6 Info CMS star rating based on short-stay quality measure performance. 5 stars = much above average, 1 star = much below average.
Pneumococcal Vaccine Info Percent of short-stay residents assessed and appropriately given the pneumococcal vaccine 74.8%
15% worse than Washington average

Washington average: 88.1%

Antipsychotic medication increase Info Percent of short-stay residents who newly received an antipsychotic medication 0.8%
47% better than Washington average

Washington average: 1.4%

Influenza Vaccine Info Percent of short-stay residents assessed and appropriately given the seasonal influenza vaccine 71.2%
13% worse than Washington average

Washington average: 82.0%

Re-hospitalized after SNF stay Info Percentage of short-stay residents who were re-hospitalized after their nursing home admission. 14.1%
29% better than Washington average

Washington average: 19.9%

Emergency department visits Info Percentage of short-stay residents who had an outpatient emergency department visit. 19.3%
46% worse than Washington average

Washington average: 13.2%

Falls with major injury Info Percentage of SNF residents who experience falls with major injury during their stay. 0.0%
100% better than Washington average

Washington average: 0.8%

Ability to care for self at discharge Info Percentage of residents at or above expected ability to care for themselves at discharge. 42.0%
22% worse than Washington average

Washington average: 53.7%

Successful return to home or community Info Rate of successful return to home or community from a skilled nursing facility. 52.7%
In line with Washington average

Washington average: 50.6%

Breakdown by payment type

Medicare

81% of new residents, usually for short-term rehab.

Typical stay 1 months

Private pay

10% of new residents, often for short stays.

Typical stay 3 - 4 months

Medicaid

10% of new residents, often for long-term daily care.

Typical stay 1 - 2 years

Facility Characteristics

Source: CMS Long-Term Care Facility Characteristics (Data as of Jan 2026)

Total residents 41
Medicare
4
9.8% of residents
Medicaid
29
70.7% of residents
Private pay or other
8
19.5% of residents
Programs & Services
Residents Group

Residents meet regularly to discuss policies, care quality, and activities

Active Resident Council

Organized group of residents that meets regularly to discuss facility policies, quality of life, and activities.

Finances and operations

Based on CMS SNF Cost Report for fiscal year ending in 03/2023.

For-profit
Operated by a single business entity.
Net patient revenue Info Net patient revenue — what the home actually collects for resident care, after contractual allowances, bad debt and discounts are subtracted from its gross charges (CMS cost report, Worksheet G-3). It covers resident care only; money the home earns from other sources is shown separately as "Other income."
$1.3M
Net patient income Info Net patient income: net patient revenue minus the home's total operating expenses. A positive figure means it earns more from resident care than it spends to deliver it; a negative figure means the opposite. It excludes non-operating "other income."
$33.7K
For-profit Operated by a single business entity.
Net patient revenue Info Net patient revenue — what the home actually collects for resident care, after contractual allowances, bad debt and discounts are subtracted from its gross charges (CMS cost report, Worksheet G-3). It covers resident care only; money the home earns from other sources is shown separately as "Other income."
$1.3M Rank #94 / 94Revenue — State benchmarkedThis home is ranked 94th out of 94 homes in Washington. Shows this facility's annual revenue compared to the Washington average. Higher revenue generally means more resources for staffing and capital — read alongside Payroll %.Rankings are based only on facilities in Washington that report data for that category. Facilities without available data are excluded from the ranking.Click the rank badge to see the full State ranking.Click here to see the full State ranking.
Net patient income Info Net patient income: net patient revenue minus the home's total operating expenses. A positive figure means it earns more from resident care than it spends to deliver it; a negative figure means the opposite. It excludes non-operating "other income."
$33.7K
Other income Info Money the home earns outside of resident care — such as investments, grants, rentals and other non-operating sources (CMS cost report, Worksheet G-3). It is tracked separately from net patient revenue: it is not part of that figure, and it is not included in net patient income.
$5.5K
Payroll costs Info Staff salaries plus wage-related costs — benefits such as payroll taxes, health insurance and retirement — from the home's own accounting records (CMS cost report, Worksheet A). Contract or agency labor is counted separately, under other operating costs. Rank #94 / 94Payroll — State benchmarkedThis home is ranked 94th out of 94 homes in Washington. Shows total annual staff payroll benchmarked to the Washington average. Higher payroll investment relative to peers often signals better staffing and less reliance on cheaper contract labor.Rankings are based only on facilities in Washington that report data for that category. Facilities without available data are excluded from the ranking.Click the rank badge to see the full State ranking.Click here to see the full State ranking.
$540.6K 41.3% of net patient revenue Info Payroll as a share of revenue: staff salaries and wage-related benefits divided by net patient revenue. A higher figure means more of each revenue dollar goes to staff pay. Rank #79 / 94Payroll % — State benchmarkedThis home is ranked 79th out of 94 homes in Washington. Shows payroll as a percentage of revenue versus the Washington average. Well-run Washington facilities typically land around 53–61% — the top third Statewide. Below 25% may signal understaffing or heavy agency use — read with Staffing ratings.Rankings are based only on facilities in Washington that report data for that category. Facilities without available data are excluded from the ranking.Click the rank badge to see the full State ranking.Click here to see the full State ranking.
Other operating costs Info Everything it costs to run the home apart from payroll — food, utilities, supplies, maintenance, contract labor and administration. Calculated as total operating expense minus payroll (staff salaries and wage-related benefits).
$735.1K
Total costs Info The home's total operating expense for the year — all the costs of running it, salaries included (CMS cost report, Worksheet G-3).
$1.3M

What does this home offer?

Housing options icon

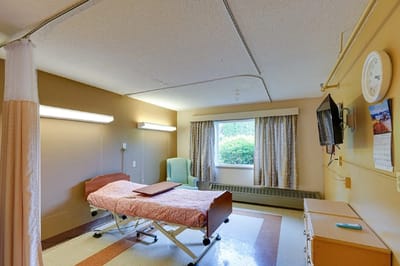
Housing Options: Private Rooms

Building type icon
Building type icon

Building Type: Single-story

Fitness and recreation icon

Fitness and Recreation

Who this home usually serves

TYPE OF STAY

Mostly short-term rehab stays

Most residents typically stay for a few weeks or months before returning home or moving on.

Most new residents arrive under Medicare (81% of admissions), and a typical Medicare stay runs around 1 months.

Admissions
31 total

Coverage residents most often arrive under.

Medicare 81%
Private pay 10%
Medicaid 10%
Discharges
28 total

Coverage residents most often leave under.

Medicare 64%
Private pay 14%
Medicaid 21%

Places of interest near Willapa Harbor Care

Address 1.0 miles from city center Info Estimated distance in miles from Raymond's city center to Willapa Harbor Care's address, calculated via Google Maps.

Calculate Travel Distance to Willapa Harbor Care

Add your location

Address

Compare Nursing Homes around Olympia

The information below is reported by the Washington Department of Social and Health Services, Residential Care Services.

5 facilities compared · CMS & WA Dept. of Health data

Penrose Harbor at Heron‘s Key
NH
AL
IL
MC
Gig Harbor
49
Facility 49
WA AVG 82
Rank #302 / 366
69.7%
Facility 69.7%
WA AVG 72.5%
Rank #198 / 310
-4%
5.88
Facility 5.88
WA AVG 4.22
Rank #1 / 90
+46%+39%
$15.0k
Facility $15.0k
WA AVG $87.7k
Rank #41 / 92
33
Facility 33
WA AVG 48.9
Rank #25 / 92
8.3
Facility 8.3
WA AVG 6.9
Rank #65 / 92
122-
36
Facility 36
WA AVG 51
Rank #433 / 628
Herons Key
$23.3M
Facility $23.3M
WA AVG $13.2M
Rank #15 / 94
$7.8M
Facility $7.8M
WA AVG $5.7M
Rank #36 / 94
33.3%
Facility 33.3%
WA AVG 45.5%
Rank #89 / 94
505531
Puget Health Care Center
NH
NC
Olympia (Capital Mall Drive Southwest)
108
Facility 108
WA AVG 82
Rank #79 / 366
89.0%
Facility 89.0%
WA AVG 72.5%
Rank #51 / 310
+23%
4.06
Facility 4.06
WA AVG 4.22
Rank #47 / 90
-45%-4%
$8.0k
Facility $8.0k
WA AVG $87.7k
Rank #34 / 92
18
Facility 18
WA AVG 48.9
Rank #7 / 92
3.0
Facility 3.0
WA AVG 6.9
Rank #3 / 92
193-
31
Facility 31
WA AVG 51
Rank #469 / 628
-
$14.8M
Facility $14.8M
WA AVG $13.2M
Rank #34 / 94
$7.3M
Facility $7.3M
WA AVG $5.7M
Rank #40 / 94
49.2%
Facility 49.2%
WA AVG 45.5%
Rank #61 / 94
505299
Willapa Harbor Care
NH
Raymond
60
Facility 60
WA AVG 82
Rank #246 / 366
60.5%
Facility 60.5%
WA AVG 72.5%
Rank #246 / 310
-17%
3.91
Facility 3.91
WA AVG 4.22
Rank #58 / 90
-19%-7%
$0
Facility $0
WA AVG $87.7k
Rank #1 / 92
30
Facility 30
WA AVG 48.9
Rank #19 / 92
7.5
Facility 7.5
WA AVG 6.9
Rank #58 / 92
-46-
13
Facility 13
WA AVG 51
Rank #570 / 628
Tashina Mcneley
$1.3M
Facility $1.3M
WA AVG $13.2M
Rank #94 / 94
$540.6k
Facility $540.6k
WA AVG $5.7M
Rank #94 / 94
41.3%
Facility 41.3%
WA AVG 45.5%
Rank #79 / 94
505349
Olympia Transitional Care and Rehabilitation
NH
MC
Olympia
113
Facility 113
WA AVG 82
Rank #63 / 366
61.7%
Facility 61.7%
WA AVG 72.5%
Rank #243 / 310
-15%
4.47
Facility 4.47
WA AVG 4.22
Rank #17 / 90
-53%+6%
$0
Facility $0
WA AVG $87.7k
Rank #1 / 92
29
Facility 29
WA AVG 48.9
Rank #15 / 92
4.1
Facility 4.1
WA AVG 6.9
Rank #11 / 92
181-
38
Facility 38
WA AVG 51
Rank #420 / 628
Joel Smith
$15.1M
Facility $15.1M
WA AVG $13.2M
Rank #35 / 94
$8.6M
Facility $8.6M
WA AVG $5.7M
Rank #25 / 94
57%
Facility 57%
WA AVG 45.5%
Rank #29 / 94
505243
Woodard Creek Health & Rehabilitation
NH
HC
Olympia (Ensign Road Northeast)
152
Facility 152
WA AVG 82
Rank #15 / 366
58.7%
Facility 58.7%
WA AVG 72.5%
Rank #259 / 310
-19%
4.30
Facility 4.30
WA AVG 4.22
Rank #28 / 90
-2%+2%
$12.7k
Facility $12.7k
WA AVG $87.7k
Rank #39 / 92
65
Facility 65
WA AVG 48.9
Rank #66 / 92
7.2
Facility 7.2
WA AVG 6.9
Rank #55 / 92
-99-
29
Facility 29
WA AVG 51
Rank #483 / 628
Rachel Erickson
$15.7M
Facility $15.7M
WA AVG $13.2M
Rank #22 / 94
$11.7M
Facility $11.7M
WA AVG $5.7M
Rank #16 / 94
74.6%
Facility 74.6%
WA AVG 45.5%
Rank #33 / 94
505387

Financial Assistance for
Nursing Home in Washington

Willapa Harbor Care is located in Raymond, Washington.
Here are the financial assistance programs available to residents in Washington.

Get Financial aid guidance

Community Options Program Entry System (COPES)

WA Medicaid COPES

Age 65+ or disabled
General Washington resident, Medicaid-eligible, nursing home-level care need.
Income Limits (2025) ~$2,829/month 300% FBR, individual
Asset Limits $2,000 (individual), $3,000 (couple).
WA

High demand in urban areas (e.g., Seattle).

Benefits
Personal care (5-7 hours/day) Respite (240 hours/year) Adult day care ($70/day) Home modifications ($1,500 avg.)

Washington Family Caregiver Support Program

WA NFCSP

Age Caregiver of someone 60+ (or with dementia)
General Washington resident.
Income Limits No strict limit; prioritizes low-income.
Asset Limits Not applicable.
WA

High urban demand; rural outreach.

Benefits
In-home respite (4-6 hours/day) Adult day care (~$70/day) Short-term facility care (up to 5 days)

Community First Choice (CFC)

Washington Community First Choice

Age 65+ (or disabled 18+)
General WA resident, Medicaid-eligible, need help with 2+ ADLs/IADLs.
Income Limits (2025) ~$2,829/month; QIT optional.
Asset Limits $2,000 (individual), $3,000 (couple).
WA

Broader than COPES; serves ~20,000; self-directed option.

Benefits
Personal care (4-6 hours/day) Respite (~240 hours/year) Assistive devices Training Transportation

Older Americans Act (OAA) Services

Washington OAA Services

Age 60+
General WA resident; no income/asset limits.
Income Limits (2025) None; donations encouraged.
Asset Limits Not assessed.
WA

13 AAAs; includes Meals on Wheels; rural focus.

Benefits
Meals (~$5-$7/meal) Transportation Homemaker services (~4 hours/week) Respite (~5 days/year) Legal aid

Medicare Savings Program (MSP)

Washington Medicare Savings Program

Age 65+ or disabled
General WA resident, Medicare Part A/B.
Income Limits (2025) ~$2,510/month (QMB), ~$3,380/month (SLMB), ~$3,598/month (QI)—individual.
Asset Limits $9,430 (individual), $14,130 (couple).
WA

Includes Extra Help for Part D; no waitlist.

Benefits
Covers Part B premiums ($174.70/month) Deductibles ($240/year) Copays (~20%)

VA Aid and Attendance (A&A) and Housebound Benefits

Washington VA Aid and Attendance/Housebound

Age 65+ or disabled veteran/spouse
General WA resident, wartime service, ADL help (A&A) or homebound.
Income Limits (2025) Net income < ~$1,984/month (veteran with dependent, A&A); pension offsets income.
Asset Limits ~$155,356 net worth
WA

High veteran use; supports rural/urban needs.

Benefits
Cash (~$1,433-$2,642/month veteran, ~$951-$1,318 spouse) for care costs

Senior Citizens Property Tax Exemption

Washington Senior Property Tax Exemption

Age 61+ or disabled retiree
General WA resident, homeowner, income-based.
Income Limits (2025) ~$45,000-$70,000/year varies by county, e.g., King: $70,000
Asset Limits Not assessed; home value cap varies ~$250,000-$400,000
WA

Saves ~$500-$1,500/year; offered statewide.

Benefits
Tax exemption (~$500-$1,500/year depending on county)

Senior Farmers’ Market Nutrition Program (SFMNP)

Washington SFMNP

Age 60+
General WA resident, low-income.
Income Limits (2025) ~$2,322/month 185% FPL
Asset Limits Not assessed.
WA

Vouchers (~$80/season); serves ~20,000 via AAAs.

Benefits
Vouchers (~$80/season) for produce at farmers’ markets

Frequently Asked Questions about Willapa Harbor Care

Is Willapa Harbor Care in a walkable area?

Willapa Harbor Care has a walk score of 13. Car-dependent. Most errands require a car, with limited nearby walkable options.

What is the occupancy rate at Willapa Harbor Care?

Willapa Harbor Care's occupancy is 60.5%.

Does Willapa Harbor Care operate as a for-profit or non-profit?

Willapa Harbor Care is registered as a for-profit.

Are there photos of Willapa Harbor Care?

Yes — there are 16 photos of Willapa Harbor Care in the photo gallery on this page.

What is the address of Willapa Harbor Care?

Willapa Harbor Care is located at 1100 Jackson Ave, Raymond, WA 98577.

What is the phone number of Willapa Harbor Care?

(360) 942-2424 will put you in contact with the team at Willapa Harbor Care.

Is Willapa Harbor Care Medicare or Medicaid certified?

Yes — Willapa Harbor Care is a CMS-certified provider of Medicare and Medicaid.

Guides for Better Senior Living

Care Cost Calculator: See Prices in Your Area

Nursing Home Data Explorer

Don’t Wait Too Long: 7 Red Flag Signs Your Parent Needs Assisted Living Now

The True Cost of Assisted Living in 2025 – And How Families Are Paying For It

Understanding Senior Living Costs: Pricing Models, Discounts & Financial Assistance