


Total staff
105
Employees
72
Contractors
33
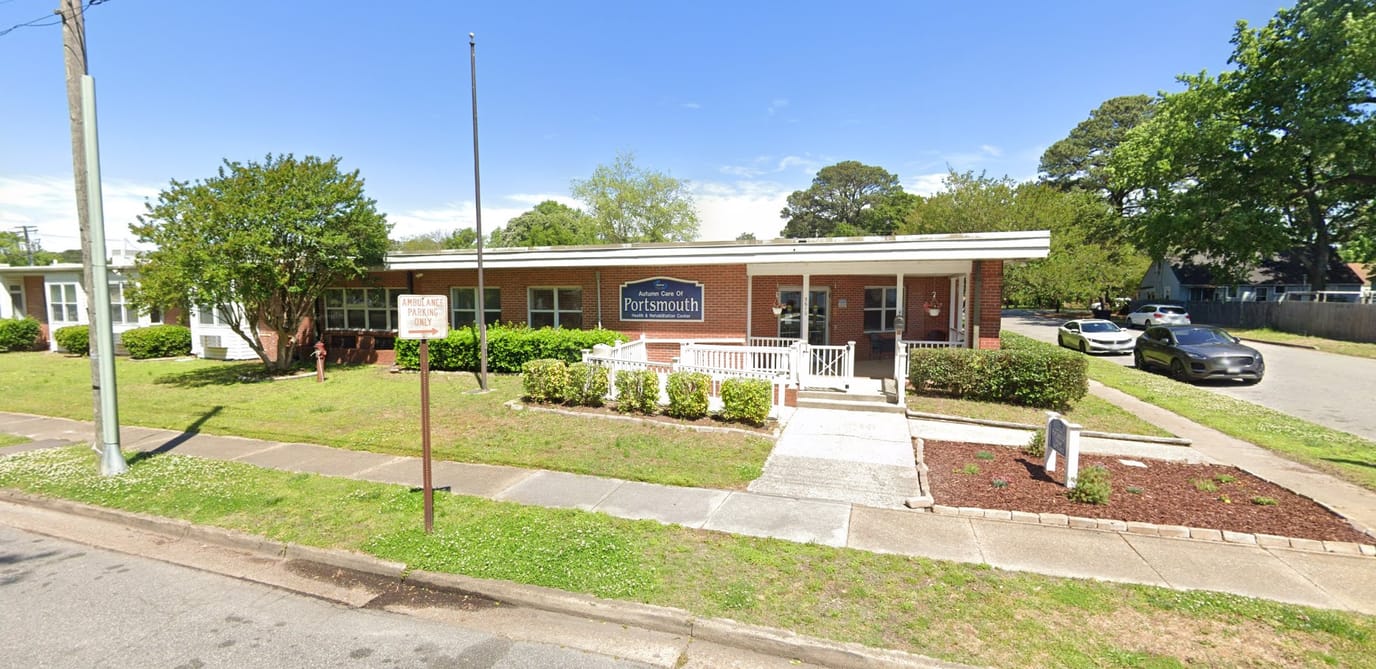
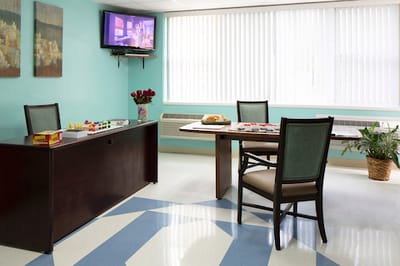
Autumn Care of Portsmouth is a skilled nursing and rehabilitation center that focuses on enhancing the quality of life of each senior resident. Specializing in short-term rehabilitation and long-term skilled nursing, assisted living, and memory care, the facility is cozy and comfortable for residents to make the best of their stay in a nurturing environment.
Autumn Care of Portsmouth is guaranteed to create connections and provide engaging experiences among community members while maintaining a balance of independence and extra comprehensive assistance.
| Staff type | Hours / Day / Resident | vs state avg |
|---|---|---|
|
Registered Nurse (RN)
| 17m per day | ▼ 58% State avg: 41m per day · National avg: 41m per day |
|
LPN / LVN
| 57m per day | ▼ 5% State avg: 1h 0m per day · National avg: 52m per day |
|
Nurse Aide
| 1h 57m per day | ▼ 8% State avg: 2h 7m per day · National avg: 2h 20m per day |
|
Weekend Total Nursing
| 2h 44m per day | ▼ 18% State avg: 3h 19m per day · National avg: 3h 26m per day |
|
Physical Therapist
| 2m per day | ▼ 69% State avg: 5m per day · National avg: 4m per day |
|
Weekend RN
| 12m per day | ▼ 56% State avg: 28m per day · National avg: 28m per day |
Reporting period: October 1 – December 31, 2025 (Q4 2025). Source: CMS Payroll-Based Journal report.
Manages medical care and health needs.
Assists with medical care and medications.
Helps with daily care and mobility.
Total hours from contractors
3,706 contractor hours this quarter
| Certified Nursing Assistant | 37 | 10 | 47 | 17,604 | 92 | 100% | 8.1 |
| Licensed Practical Nurse | 20 | 5 | 25 | 7,998 | 92 | 100% | 8.2 |
| Registered Nurse | 6 | 6 | 12 | 1,527 | 87 | 95% | 9.2 |
| Speech Language Pathologist | 0 | 2 | 2 | 658 | 67 | 73% | 6.3 |
| RN Director of Nursing | 1 | 0 | 1 | 615 | 69 | 75% | 8.9 |
| Clinical Nurse Specialist | 1 | 2 | 3 | 590 | 58 | 63% | 8.3 |
| Physical Therapy Assistant | 0 | 1 | 1 | 550 | 73 | 79% | 7.5 |
| Other Dietary Services Staff | 2 | 0 | 2 | 524 | 73 | 79% | 6.1 |
| Dietitian | 1 | 0 | 1 | 516 | 61 | 66% | 8.5 |
| Nurse Practitioner | 1 | 0 | 1 | 496 | 62 | 67% | 8 |
| Administrator | 1 | 0 | 1 | 464 | 58 | 63% | 8 |
| Dental Services Staff | 1 | 0 | 1 | 454 | 57 | 62% | 8 |
| Qualified Social Worker | 0 | 1 | 1 | 340 | 50 | 54% | 6.8 |
| Respiratory Therapy Technician | 0 | 1 | 1 | 235 | 51 | 55% | 4.6 |
| Occupational Therapy Aide | 1 | 0 | 1 | 208 | 53 | 58% | 3.9 |
| Occupational Therapy Assistant | 0 | 4 | 4 | 45 | 45 | 49% | 0.9 |
| Medical Director | 0 | 1 | 1 | 25 | 35 | 38% | 0.7 |
Federal penalties imposed by CMS for regulatory violations, including civil money penalties (fines) and denials of payment for new Medicare/Medicaid admissions.
Source: CMS Penalties Database
No penalties in the past 3 years
No civil money penalties or payment denials were reported in the last 3 years.
These measures show how residents usually do over time at this home, based on health outcomes and preventive care.
Virginia average: 10.1
Virginia average: 19.7
Virginia average: 16.8%
Virginia average: 19.7%
Virginia average: 22.6%
Virginia average: 3.6%
Virginia average: 5.4%
Virginia average: 1.5%
Virginia average: 5.9%
Virginia average: 14.9%
Virginia average: 12.9%
Virginia average: 91.3%
Virginia average: 94.0%
Virginia average: 74.9%
Virginia average: 1.2%
Virginia average: 73.6%
Virginia average: 22.0%
Virginia average: 11.7%
Virginia average: 0.8%
Virginia average: 53.7%
Virginia average: 50.6%
Quality measures are calculated from Minimum Data Set (MDS) assessments. For most measures, lower percentages indicate better care quality.
22% of new residents, usually for short-term rehab.
71% of new residents, often for short stays.
7% of new residents, often for long-term daily care.
Source: CMS Long-Term Care Facility Characteristics (Data as of Jan 2026)
Residents meet regularly to discuss policies, care quality, and activities
Organized group of residents that meets regularly to discuss facility policies, quality of life, and activities.
Data sourced from CMS Long-Term Care Facility Characteristics quarterly report. Payer mix reflects the current resident census by primary payment source.
Historical financial and operational data for Autumn Care of Portsmouth from 2012–2023, based on CMS SNF Cost Reports.
Key figures below are for fiscal year ending in 12/2023.
Based on CMS SNF Cost Report for fiscal year ending in 12/2023.
Pets Allowed
Housing Options: Private Rooms / Semi-Private Rooms
Building Type: Single-story
Transportation Services
Fitness and Recreation
Residents typically stay for brief periods, with frequent admissions and discharges throughout the year.
Most new residents arrive under private pay (71% of admissions), and a typical private pay stay runs around 4 - 5 months.
Coverage residents most often arrive under.
Coverage residents most often leave under.
![]() 3.2 miles from city center
3.2 miles from city center
![]() Estimated distance in miles from Portsmouth's city center to Autumn Care of Portsmouth's address, calculated via Google Maps.
— 0.78 miles to nearest hospital (Bon Secours Maryview Medical Center)
Estimated distance in miles from Portsmouth's city center to Autumn Care of Portsmouth's address, calculated via Google Maps.
— 0.78 miles to nearest hospital (Bon Secours Maryview Medical Center)
Add your location
Info below is compiled from CMS reports & the VA Depts. of Social Services & Health, senior community websites & trusted data sources such as Walk Score & BBB.
Communities are listed from highest to lowest based on our ranking methodology.
| Falcons Landing | NH AL IL MC SNF | Potomac Falls | 60
Facility
60
VA AVG
96
Rank
#270 / 365 |
81.0%
Facility
81.0%
VA AVG
70.5
Rank
#100 / 297 | +15% | 6.16
Facility
6.16
VA AVG
3.74
Rank
#6 / 71 | -70% | +64% | $0
Facility
$0
VA AVG
$54.3k
Rank
#1 / 75 | 11
Facility
11
VA AVG
38.4
Rank
#7 / 70 | 3.7
Facility
3.7
VA AVG
8.9
Rank
#8 / 70 | - | 49 | A+ |
33
Facility
33
VA AVG
44
Rank
#281 / 446 | Air Force Retired Officers Community-Washington D.c | $37.2MFiscal year ending 12/2023
Facility
$37.2MFiscal year ending 12/2023
VA AVG
$18.3M
Rank
#13 / 71 | $21.0MFiscal year ending 12/2023
Facility
$21.0MFiscal year ending 12/2023
VA AVG
$6.9M
Rank
#7 / 71 | 56.5%Fiscal year ending 12/2023
Facility
56.5%Fiscal year ending 12/2023
VA AVG
39.7%
Rank
#15 / 71 | 495312 | ||||
| The Chesapeake | NH AL IL MC SNF | Newport News (Saunders) | 52
Facility
52
VA AVG
96
Rank
#298 / 365 |
89.6%
Facility
89.6%
VA AVG
70.5
Rank
#47 / 297 | +27% | 5.15
Facility
5.15
VA AVG
3.74
Rank
#18 / 71 | -5% | +38% | $0
Facility
$0
VA AVG
$54.3k
Rank
#1 / 75 | 23
Facility
23
VA AVG
38.4
Rank
#32 / 70 | 7.7
Facility
7.7
VA AVG
8.9
Rank
#36 / 70 | - | 47 | - |
30
Facility
30
VA AVG
44
Rank
#303 / 446 | Virginia Baptist Homes Inc | $27.0MFiscal year ending 12/2023
Facility
$27.0MFiscal year ending 12/2023
VA AVG
$18.3M
Rank
#33 / 71 | $12.7MFiscal year ending 12/2023
Facility
$12.7MFiscal year ending 12/2023
VA AVG
$6.9M
Rank
#21 / 71 | 47.1%Fiscal year ending 12/2023
Facility
47.1%Fiscal year ending 12/2023
VA AVG
39.7%
Rank
#30 / 71 | 495397 | ||||
| Brandermill Woods Healthcare Communities | NH AL IL MC SNF | Midlothian (Brandermill) | 91
Facility
91
VA AVG
96
Rank
#177 / 365 |
60.4%
Facility
60.4%
VA AVG
70.5
Rank
#213 / 297 | -14% | 5.62
Facility
5.62
VA AVG
3.74
Rank
#10 / 71 | +17% | +50% | $0
Facility
$0
VA AVG
$54.3k
Rank
#1 / 75 | 7
Facility
7
VA AVG
38.4
Rank
#3 / 70 | 2.3
Facility
2.3
VA AVG
8.9
Rank
#2 / 70 | - | 55 | - |
4
Facility
4
VA AVG
44
Rank
#428 / 446 | Frasier Brickhouse | $29.3MFiscal year ending 06/2024
Facility
$29.3MFiscal year ending 06/2024
VA AVG
$18.3M
Rank
#26 / 71 | $11.8MFiscal year ending 06/2024
Facility
$11.8MFiscal year ending 06/2024
VA AVG
$6.9M
Rank
#28 / 71 | 40.5%Fiscal year ending 06/2024
Facility
40.5%Fiscal year ending 06/2024
VA AVG
39.7%
Rank
#49 / 71 | 495183 | ||||
| Birmingham Green | NH AL MC SNF | Manassas | 64
Facility
64
VA AVG
96
Rank
#263 / 365 | - | - | - | -32% | - | $0
Facility
$0
VA AVG
$54.3k
Rank
#1 / 75 | 15
Facility
15
VA AVG
38.4
Rank
#19 / 70 | 7.5
Facility
7.5
VA AVG
8.9
Rank
#35 / 70 | 1 | 164 | - |
50
Facility
50
VA AVG
44
Rank
#175 / 446 | Perry Mason | $26.9MFiscal year ending 06/2024
Facility
$26.9MFiscal year ending 06/2024
VA AVG
$18.3M
Rank
#19 / 71 | $22.8MFiscal year ending 06/2024
Facility
$22.8MFiscal year ending 06/2024
VA AVG
$6.9M
Rank
#6 / 71 | 84.6%Fiscal year ending 06/2024
Facility
84.6%Fiscal year ending 06/2024
VA AVG
39.7%
Rank
#3 / 71 | 495390 | ||||
| Autumn Care of Portsmouth | NH HOS MC RC | Portsmouth (Midtown) | 108
Facility
108
VA AVG
96
Rank
#119 / 365 |
91.2%
Facility
91.2%
VA AVG
70.5
Rank
#42 / 297 | +29% | 3.26
Facility
3.26
VA AVG
3.74
Rank
#53 / 71 | +18% | -13% | $0
Facility
$0
VA AVG
$54.3k
Rank
#1 / 75 | 43
Facility
43
VA AVG
38.4
Rank
#50 / 70 | 14.3
Facility
14.3
VA AVG
8.9
Rank
#59 / 70 | 2 | 99 | - |
72
Facility
72
VA AVG
44
Rank
#60 / 446 | Ashley Jackson | $10.4MFiscal year ending 12/2023
Facility
$10.4MFiscal year ending 12/2023
VA AVG
$18.3M
Rank
#70 / 71 | $5.2MFiscal year ending 12/2023
Facility
$5.2MFiscal year ending 12/2023
VA AVG
$6.9M
Rank
#57 / 71 | 49.5%Fiscal year ending 12/2023
Facility
49.5%Fiscal year ending 12/2023
VA AVG
39.7%
Rank
#2 / 71 | 495194 |
Autumn Care of Portsmouth is in the Midtown neighborhood.
Autumn Care of Portsmouth has a walk score of 72. Very walkable. Most errands can be accomplished on foot, and many essentials are within a short walk.
Autumn Care of Portsmouth's occupancy is 90.5%.
Yes, Autumn Care of Portsmouth allows residents to bring their pets.
Autumn Care of Portsmouth is registered as a for-profit.
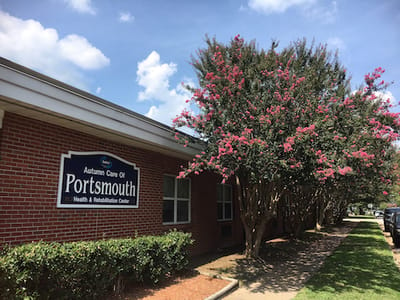
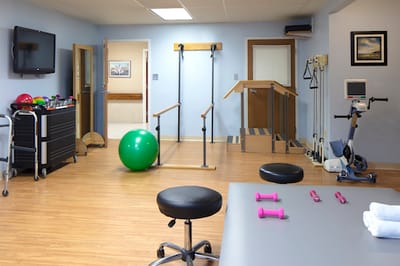
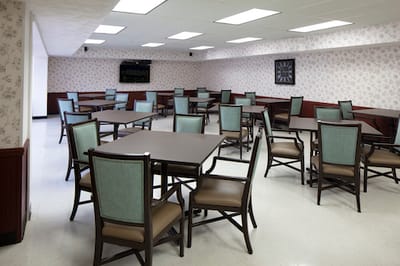
Yes — there are 5 photos of Autumn Care of Portsmouth in the photo gallery on this page.
Autumn Care of Portsmouth is located at 3610 Winchester Dr, Portsmouth, VA 23707.
Care Cost Calculator: See Prices in Your Area
Nursing Home Data Explorer
Don’t Wait Too Long: 7 Red Flag Signs Your Parent Needs Assisted Living Now
The True Cost of Assisted Living in 2025 – And How Families Are Paying For It
Understanding Senior Living Costs: Pricing Models, Discounts & Financial Assistance


