Senior Suites New City
Nursing Home & Independent Living · Chicago, IL
CMS overall rating Info CMS (the Centers for Medicare & Medicaid Services) is the federal agency that rates nursing home quality. Its Overall Rating runs from 1 to 5 stars, combining health inspections, staffing, and quality measures, with inspections weighted most heavily.

Senior Suites New City

Nursing Home & Independent Living · Chicago, IL
CMS overall rating Info CMS (the Centers for Medicare & Medicaid Services) is the federal agency that rates nursing home quality. Its Overall Rating runs from 1 to 5 stars, combining health inspections, staffing, and quality measures, with inspections weighted most heavily.
Calculator: See prices in your area
Senior Suites New City accepts Medicare, Medicaid, and private pay.

Overview of Senior Suites New City

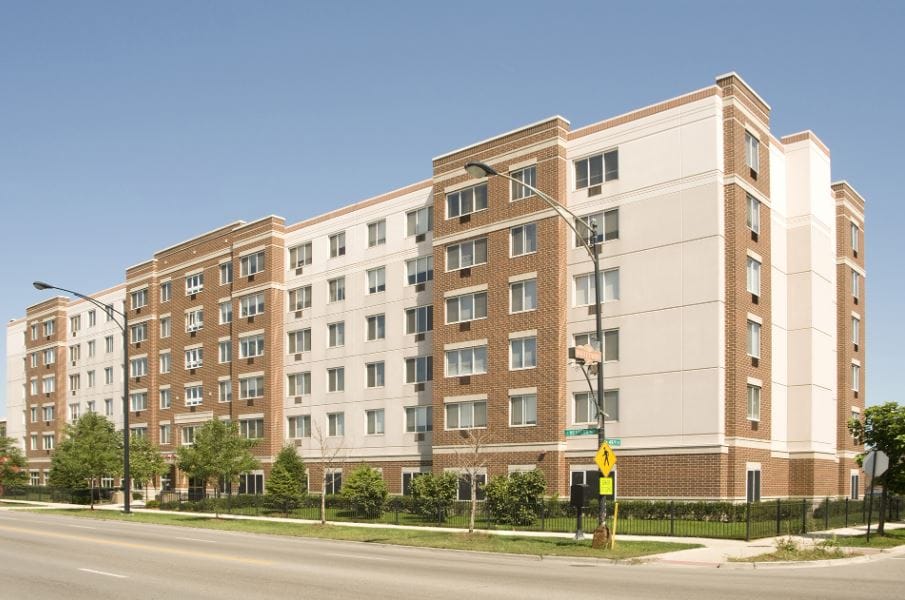
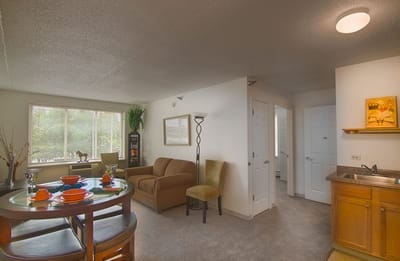
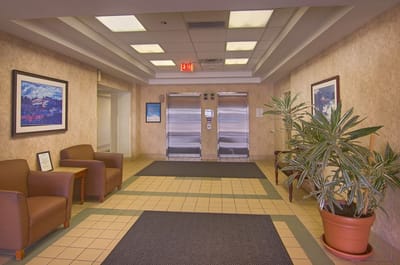
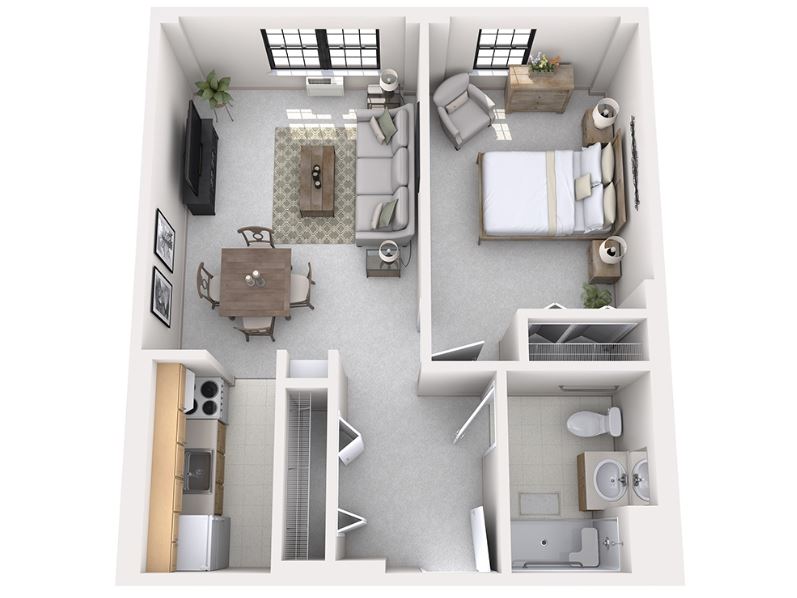
Located in Chicago, IL, Senior Suites New City is a secure senior living community that offers independent living. Residents enjoy a restful retirement with well-designed accommodations with access to full-kitchen, individually controlled heating and cooling, and secured entry system. With services like regular housekeeping, transportation services, and on-site maintenance, residents live conveniently and confidently.

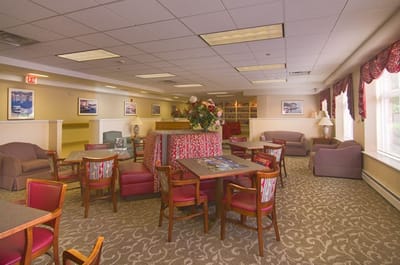
At Senior Suites New City, residents stay connected with an array of activities and amenities. Residents enjoy spending their time playing cards, doing movie marathons with friends, or reading a book at the comfort of their apartments. With emergency call systems, regular welfare checkups, and secured entry systems, residents have peace of mind knowing they are in a safe and secured environment.

(773) 523-9333

Quality ratings

Measured by Centers for Medicare & Medicaid Services (CMS)

Overall rating Info The Overall CMS Rating combines results from health inspections, staffing levels and quality measures. Health inspections carry the most weight. Staffing and quality scores can increase or decrease the final rating based on performance compared to state and national standards.
▼ 60.3% Below IL avg. ▼ 60.3% Below IL avg.IL average: 2.5Click the badge to see the full State ranking.Click here to see the full State ranking.
Health Inspection Info Based on the results of the facility's three most recent standard inspections and any complaint investigations. CMS reviews the number, scope, and severity of deficiencies, with more recent findings weighted more heavily.
▼ 64.0% Below IL avg. ▼ 64.0% Below IL avg.IL average: 2.8Click the badge to see the full State ranking.Click here to see the full State ranking.
Staffing Info Measures average nursing staff hours per resident per day, including Registered Nurses (RNs) and total nursing staff. Ratings are adjusted based on the level of care residents require and are compared to state and national benchmarks.
▼ 53.2% Below IL avg. ▼ 53.2% Below IL avg.IL average: 2.1Click the badge to see the full State ranking.Click here to see the full State ranking.
Quality Measures Info Based on clinical and physical health indicators reported to CMS, such as hospital readmissions, falls, pressure ulcers, and improvements in mobility. These measures reflect how well residents' health needs are being managed.
▲ 6.6% Above IL avg. ▲ 6.6% Above IL avg.IL average: 2.8Click the badge to see the full State ranking.Click here to see the full State ranking.

Staffing hours breakdown

Info Daily nursing hours per resident by staff type, reported to CMS. Higher is generally better — compare this facility to state and national averages to see where staffing stands.

Hours per resident per day — compared to Illinois state averages

Total nursing care / resident Info This home is ranked 146th out of 172 homes in Illinois for nurse hours. Total adjusted nursing hours per resident per day, combining RN, LPN, and aide time. CMS adjusts this for case-mix so facilities can be fairly compared.
2h 20m per day
Rank #146 / 172Nurse hours — State benchmarkedThis home is ranked 146th out of 172 homes in Illinois. Shows adjusted nurse hours per resident per day benchmarked to the Illinois average, with a ranking across 172 Illinois facilities. More hours mean more direct care. The national average is about 3.5 hrs; below 3.0 is a red flag.Ranking totals vary by category as each rank only includes facilities that report data for that metric. Homes missing that data point aren't included in the ranking.Click the rank badge to see the full State ranking.Click here to see the full State ranking.
This facility Illinois avg (3h 6m per day)
vs Illinois avg
-25%

5 of 6 metrics below state avg

Standout metric LPN / LVN is +37% above state avg
Staff typeHours / Day / Residentvs state avg
Registered Nurse (RN) Info RNs hold the highest nursing license and can assess residents, interpret test results, and direct care plans. More RN hours per day often signals stronger clinical oversight and faster response to health changes. 26m per day ▼ 39% State avg: 43m per day · National avg: 41m per day
LPN / LVN Info Licensed Practical Nurses (LPNs) or Licensed Vocational Nurses (LVNs) deliver routine hands-on care — medication administration, wound dressing, and monitoring vital signs. They work under RN supervision and make up a large share of daily bedside care. 53m per day ▲ 37% State avg: 39m per day · National avg: 52m per day
Nurse Aide Info Certified Nurse Aides (CNAs) provide the most direct day-to-day assistance: bathing, dressing, feeding, and mobility. Nurse aide hours are typically the largest staffing category and directly affect residents' quality of life. 1h 48m per day ▼ 15% State avg: 2h 7m per day · National avg: 2h 20m per day
Weekend Total Nursing Info Combined nursing hours (RN + LPN + Nurse Aide) per resident per day on weekends. Staffing often drops on weekends — this figure reveals whether the facility maintains adequate coverage outside of weekday hours. 2h 45m per day ▼ 11% State avg: 3h 6m per day · National avg: 3h 27m per day
Physical Therapist Info Hours per resident per day provided by licensed Physical Therapists (PTs) or PT Assistants. PT services help residents recover mobility after injury or illness and are especially important for post-acute (short-stay) rehabilitation. 2m per day ▼ 43% State avg: 3m per day · National avg: 4m per day
Weekend RN Info Registered nurse hours specifically on weekends. Facilities sometimes reduce RN presence on Saturdays and Sundays — a low weekend RN figure compared to weekday hours can indicate reduced clinical oversight when most administrative staff are absent. 19m per day ▼ 42% State avg: 33m per day · National avg: 29m per day

Capacity and availability

This home usually has limited availability

Higher occupancy than the Illinois average: 69.3%
Occupancy rate
92.1% Rank #28 / 204Occupancy rate — State benchmarkedThis home is ranked 28th out of 204 homes in Illinois. Shows this facility's occupancy rate versus the Illinois average, with its Statewide rank out of 204. Higher occupancy signals strong local demand and financial stability.Ranking totals vary by category as each rank only includes facilities that report data for that metric. Homes missing that data point aren't included in the ranking.Click the rank badge to see the full State ranking.Click here to see the full State ranking.
Avg. Length of Stay
104 days
Bed community size
218-bed community Rank #18 / 426Bed count — State benchmarkedThis home is ranked 18th out of 426 homes in Illinois. Shows this facility's certified or reported bed count compared to other Illinois facilities. Larger communities may offer more amenities, programs, and on-site services for residents and families.Ranking totals vary by category as each rank only includes facilities that report data for that metric. Homes missing that data point aren't included in the ranking.Click the rank badge to see the full State ranking.Click here to see the full State ranking.
A large-scale community that may provide a wide range of amenities, services, and structured programs.
Walk Score
Walk Score: 79 / 100 Rank #109 / 648Walk Score — State benchmarkedThis home is ranked 109th out of 648 homes in Illinois. Shows how walkable this facility's neighborhood is compared to the average Walk Score across Illinois facilities. Higher scores benefit residents, families, and staff.Ranking totals vary by category as each rank only includes facilities that report data for that metric. Homes missing that data point aren't included in the ranking.Click the rank badge to see the full State ranking.Click here to see the full State ranking.
Very walkable. Most errands can be accomplished on foot, and many essentials are within a short walk.

About this community

Contact Senior Suites New City

Staffing Data

Reporting period: October 1 – December 31, 2025 (Q4 2025). Source: CMS Payroll-Based Journal report.

Total staff 239
Employees 186
Contractors 53
Staff to resident ratio 1.24 : 1
31% fewer staff per resident than Illinois average
Illinois average ratio: 1.80 : 1 Illinois average ratio: 1.80 : 1See full Illinois ranking
Avg staff/day 92
Average shift 7.7 hours
0% compared with Illinois average
Illinois average: 7.6 hours Illinois average shift: 7.6 hoursSee full Illinois ranking
Total staff hours (quarter) 65,566

Nursing staff breakdown

Q4 2025 · Oct 1 – Dec 31 More info This data comes from the CMS Payroll-Based Journal report covering October 1 – December 31, 2025.
Registered Nurse

Manages medical care and health needs.

RN Staff Info 41 total: 19 full-time employees and 22 contractors. 41
Average shift length Info Average shift length. Calculated as total hours divided by days worked and average staff per day. 8.5 hours
Licensed Practical Nurse

Assists with medical care and medications.

LPN Staff Info All 41 LPN Staff are full-time employees. No contractors work on this role. 41
Average shift length Info Average shift length. Calculated as total hours divided by days worked and average staff per day. 8.3 hours
Certified Nursing Assistant

Helps with daily care and mobility.

CNA Staff Info All 95 CNA Staff are full-time employees. No contractors work on this role. 95
Average shift length Info Average shift length. Calculated as total hours divided by days worked and average staff per day. 7.7 hours

Contractor staffing

Q4 2025 · Oct 1 – Dec 31 More info This data comes from the CMS Payroll-Based Journal report covering October 1 – December 31, 2025.

Total hours from contractors

7.7%

5,041 contractor hours this quarter

Registered Nurse: 22 Clinical Nurse Specialist: 6 Respiratory Therapy Technician: 4 Speech Language Pathologist: 4 Occupational Therapy Aide: 3 Physical Therapy Assistant: 3 Physical Therapy Aide: 3 Qualified Social Worker: 3 Dietitian: 2 Occupational Therapy Assistant: 2 Medical Director: 1

Staff by category

Q4 2025 · Oct 1 – Dec 31 More info This data comes from the CMS Payroll-Based Journal report covering October 1 – December 31, 2025.
Certified Nursing Assistant9509532,40092100%7.7
Licensed Practical Nurse4104111,70792100%8.3
Registered Nurse1922415,62792100%8.5
RN Director of Nursing100104,3629199%8.1
Other Dietary Services Staff7073,03592100%7.5
Clinical Nurse Specialist76131,8018188%7.4
Diagnostic X-ray Services Staff2029786672%8.1
Speech Language Pathologist0448797076%6.9
Qualified Social Worker0338246672%6.7
Physical Therapy Aide0338106975%6.3
Respiratory Therapy Technician0445247683%6.6
Administrator1015126470%8
Dietitian1235026267%7.7
Nurse Practitioner1014405560%8
Physical Therapy Assistant0334357177%6.1
Occupational Therapy Aide0332345661%3.3
Nurse Aide in Training1012142830%7.6
Mental Health Service Worker1012082628%8
Occupational Therapy Assistant022611112%4.4
Medical Director011131314%1
95 Certified Nursing Assistant
% of Days 100%
41 Licensed Practical Nurse
% of Days 100%
41 Registered Nurse
% of Days 100%
10 RN Director of Nursing
% of Days 99%
7 Other Dietary Services Staff
% of Days 100%
13 Clinical Nurse Specialist
% of Days 88%
2 Diagnostic X-ray Services Staff
% of Days 72%
4 Speech Language Pathologist
% of Days 76%
3 Qualified Social Worker
% of Days 72%
3 Physical Therapy Aide
% of Days 75%
4 Respiratory Therapy Technician
% of Days 83%
1 Administrator
% of Days 70%
3 Dietitian
% of Days 67%
1 Nurse Practitioner
% of Days 60%
3 Physical Therapy Assistant
% of Days 77%
3 Occupational Therapy Aide
% of Days 61%
1 Nurse Aide in Training
% of Days 30%
1 Mental Health Service Worker
% of Days 28%
2 Occupational Therapy Assistant
% of Days 12%
1 Medical Director
% of Days 14%

Penalties and fines

Includes penalties issued in 2024-2025

Federal penalties imposed by CMS for regulatory violations, including civil money penalties (fines) and denials of payment for new Medicare/Medicaid admissions.

Source: CMS Penalties Database (Data as of Jan 2026)

Total fines amount $114K Rank #126 / 173Federal fines — State benchmarkedThis home is ranked 126th out of 173 homes in Illinois. Shows this facility's cumulative CMS federal fine dollars versus the Illinois average among facilities with fines, and where it ranks among 173 facilities in the pool. Lower total dollars mean a better rank.Ranking totals vary by category as each rank only includes facilities that report data for that metric. Homes missing that data point aren't included in the ranking.Click the rank badge to see the full State ranking.Click here to see the full State ranking.
20% lower than Illinois average

Illinois average: $143K

Number of fines 5
69% more fines than Illinois average

Illinois average: 3.0

Payment Denials Info Serious action where Medicare and/or Medicaid temporarily stops payments for new residents until issues are fixed. 2
89% more payment denials than Illinois average

Illinois average: 1.1

Fines amount comparison
This facility $114K
Illinois average $143K
Penalty History

Penalties are imposed by CMS for violations of federal nursing home regulations.

5 penalties in the past 3 years

Multiple penalties were reported in the last 3 years.

Civil Money Penalty Info Fines imposed for noncompliance, which can be assessed per day or per instance of violation. May 5, 2025
$19K
Civil Money Penalty Info Fines imposed for noncompliance, which can be assessed per day or per instance of violation. Feb 26, 2025
$20K
Civil Money Penalty Info Fines imposed for noncompliance, which can be assessed per day or per instance of violation. Apr 17, 2024
$29K
Civil Money Penalty Info Fines imposed for noncompliance, which can be assessed per day or per instance of violation. Feb 23, 2024
$38K

Last updated: Jan 2026

Quality of care over time

These measures show how residents usually do over time at this home, based on health outcomes and preventive care.

High-risk clinical events score Info A composite score based on pressure ulcers, falls with injury, weight loss, walking ability decline, and activities of daily living decline. 9.7
In line with Illinois average

Illinois average: 9.7

Functional decline score Info A composite score based on activities of daily living decline, walking ability decline, and incontinence. 24.3
31% worse than Illinois average

Illinois average: 18.6

Long-stay resident measures
Need for Help with Daily Activities Increased Info Percent of long-stay residents whose need for help with daily activities has increased 14.3%
8% better than Illinois average

Illinois average: 15.5%

Walking Ability Worsened Info Percent of long-stay residents whose ability to move independently worsened 25.6%
39% worse than Illinois average

Illinois average: 18.4%

Low Risk Residents with Bowel/Bladder Incontinence Info Percent of low risk long-stay residents who lose control of their bowels or bladder 33.1%
53% worse than Illinois average

Illinois average: 21.6%

Falls with Major Injury Info Percent of long-stay residents experiencing one or more falls with major injury 1.4%
59% better than Illinois average

Illinois average: 3.4%

High Risk Residents with Pressure Ulcers Info Percent of long-stay high risk residents with pressure ulcers 6.9%
31% worse than Illinois average

Illinois average: 5.3%

Urinary Tract Infection Info Percent of long-stay residents with a urinary tract infection 0.6%
69% better than Illinois average

Illinois average: 1.8%

Lost Too Much Weight Info Percent of long-stay residents who lose too much weight 0.1%
98% better than Illinois average

Illinois average: 6.5%

Depressive Symptoms Info Percent of long-stay residents who have depressive symptoms 94.4%
96% worse than Illinois average

Illinois average: 48.1%

Antipsychotic Use Info Percent of long-stay residents who received an antipsychotic medication 12.9%
36% better than Illinois average

Illinois average: 20.2%

Pneumococcal Vaccine Info Percent of long-stay residents assessed and appropriately given the pneumococcal vaccine 67.7%
24% worse than Illinois average

Illinois average: 89.2%

Influenza Vaccine Info Percent of long-stay residents assessed and appropriately given the seasonal influenza vaccine 67.7%
26% worse than Illinois average

Illinois average: 91.6%

Short-stay resident measures
Pneumococcal Vaccine Info Percent of short-stay residents assessed and appropriately given the pneumococcal vaccine 28.6%
58% worse than Illinois average

Illinois average: 68.3%

Antipsychotic medication increase Info Percent of short-stay residents who newly received an antipsychotic medication 1.7%
27% better than Illinois average

Illinois average: 2.3%

Influenza Vaccine Info Percent of short-stay residents assessed and appropriately given the seasonal influenza vaccine 34.5%
45% worse than Illinois average

Illinois average: 63.0%

Breakdown by payment type

Medicare

28% of new residents, usually for short-term rehab.

Typical stay 1 months

Private pay

55% of new residents, often for short stays.

Typical stay 5 months

Medicaid

17% of new residents, often for long-term daily care.

Typical stay 5 - 6 months

Facility Characteristics

Source: CMS Long-Term Care Facility Characteristics (Data as of Jan 2026)

Total residents 192
Medicare
7
3.6% of residents
Medicaid
170
88.5% of residents
Private pay or other
15
7.8% of residents
Programs & Services
Residents Group

Residents meet regularly to discuss policies, care quality, and activities

Active Resident Council

Organized group of residents that meets regularly to discuss facility policies, quality of life, and activities.

Finances and operations

Based on CMS SNF Cost Report for fiscal year ending in 12/2023.

Privately-owned community
Operated by a single business entity.
Net patient revenue Info Net patient revenue — what the home actually collects for resident care, after contractual allowances, bad debt and discounts are subtracted from its gross charges (CMS cost report, Worksheet G-3). It covers resident care only; money the home earns from other sources is shown separately as "Other income."
$21.4M
Net patient income Info Net patient income: net patient revenue minus the home's total operating expenses. A positive figure means it earns more from resident care than it spends to deliver it; a negative figure means the opposite. It excludes non-operating "other income."
-$654.3K
Privately-owned community Operated by a single business entity.
Net patient revenue Info Net patient revenue — what the home actually collects for resident care, after contractual allowances, bad debt and discounts are subtracted from its gross charges (CMS cost report, Worksheet G-3). It covers resident care only; money the home earns from other sources is shown separately as "Other income."
$21.4M Rank #25 / 171Revenue — State benchmarkedThis home is ranked 25th out of 171 homes in Illinois. Shows this facility's annual revenue compared to the Illinois average. Higher revenue generally means more resources for staffing and capital — read alongside Payroll %.Ranking totals vary by category as each rank only includes facilities that report data for that metric. Homes missing that data point aren't included in the ranking.Click the rank badge to see the full State ranking.Click here to see the full State ranking.
Net patient income Info Net patient income: net patient revenue minus the home's total operating expenses. A positive figure means it earns more from resident care than it spends to deliver it; a negative figure means the opposite. It excludes non-operating "other income."
-$654.3K
Other income Info Money the home earns outside of resident care — such as investments, grants, rentals and other non-operating sources (CMS cost report, Worksheet G-3). It is tracked separately from net patient revenue: it is not part of that figure, and it is not included in net patient income.
$880.7K
Payroll costs Info Staff salaries plus wage-related costs — benefits such as payroll taxes, health insurance and retirement — from the home's own accounting records (CMS cost report, Worksheet A). Contract or agency labor is counted separately, under other operating costs. Rank #26 / 171Payroll — State benchmarkedThis home is ranked 26th out of 171 homes in Illinois. Shows total annual staff payroll benchmarked to the Illinois average. Higher payroll investment relative to peers often signals better staffing and less reliance on cheaper contract labor.Ranking totals vary by category as each rank only includes facilities that report data for that metric. Homes missing that data point aren't included in the ranking.Click the rank badge to see the full State ranking.Click here to see the full State ranking.
$9.8M 45.6% of net patient revenue Info Payroll as a share of revenue: staff salaries and wage-related benefits divided by net patient revenue. A higher figure means more of each revenue dollar goes to staff pay. Rank #126 / 171Payroll % — State benchmarkedThis home is ranked 126th out of 171 homes in Illinois. Shows payroll as a percentage of revenue versus the Illinois average. Well-run Illinois facilities typically land around 54–67% — the top third Statewide. Below 25% may signal understaffing or heavy agency use — read with Staffing ratings.Ranking totals vary by category as each rank only includes facilities that report data for that metric. Homes missing that data point aren't included in the ranking.Click the rank badge to see the full State ranking.Click here to see the full State ranking.
Other operating costs Info Everything it costs to run the home apart from payroll — food, utilities, supplies, maintenance, contract labor and administration. Calculated as total operating expense minus payroll (staff salaries and wage-related benefits).
$12.3M
Total costs Info The home's total operating expense for the year — all the costs of running it, salaries included (CMS cost report, Worksheet G-3).
$22.0M

What does this home offer?

Housing options icon

Housing Options: 1 Bed

Building type icon
Building type icon

Building Type: Mid-rise

Transportation services icon

Transportation Services

Who this home usually serves

TYPE OF STAY

Mix of rehab and long-term care

This home supports both short-term rehab and long-term care, with residents staying for a wide range of durations.

Most new residents arrive under private pay (55% of admissions), and a typical private pay stay runs around 5 months.

Admissions
612 total

Coverage residents most often arrive under.

Medicare 28%
Private pay 55%
Medicaid 17%
Discharges
704 total

Coverage residents most often leave under.

Medicare 25%
Private pay 52%
Medicaid 23%

Living Spaces & Floor Plans for Senior Suites New City

Lifestyle New City P1

Places of interest near Senior Suites New City

Address 7.3 miles from city center Info Estimated distance in miles from Chicago's city center to Senior Suites New City's address, calculated via Google Maps. — 2.54 miles to nearest hospital (Holy Cross Hospital)

Calculate Travel Distance to Senior Suites New City

Add your location

Address

Compare Nursing Home around Chicago

5 facilities compared · CMS & IL Dept. of Health data

The Selfhelp Home Senior Living Community
NH
AL
IL
RC
Chicago (Uptown)
72
Facility 72
IL AVG 86
Rank #209 / 426
81.9%
Facility 81.9%
IL AVG 69.3%
Rank #74 / 204
+18%
5.56
Facility 5.56
IL AVG 3.10
Rank #8 / 172
+44%+79%
$0
Facility $0
IL AVG $151.3k
Rank #1 / 173
21
Facility 21
IL AVG 36.8
Rank #45 / 172
5.3
Facility 5.3
IL AVG 3.7
Rank #154 / 172
155A+
92
Facility 92
IL AVG 51
Rank #28 / 648
Marvin Rubin
$9.3M
Facility $9.3M
IL AVG $12.2M
Rank #78 / 171
$7.0M
Facility $7.0M
IL AVG $4.8M
Rank #73 / 171
75.3%
Facility 75.3%
IL AVG 44.3%
Rank #70 / 171
146009
Encore Village of Schaumburg
NH
AL
IL
MC
Schaumburg
109
Facility 109
IL AVG 86
Rank #108 / 426
55.4%
Facility 55.4%
IL AVG 69.3%
Rank #169 / 204
-20%
3.46
Facility 3.46
IL AVG 3.10
Rank #54 / 172
+8%+12%
$25.5k
Facility $25.5k
IL AVG $151.3k
Rank #94 / 173
28
Facility 28
IL AVG 36.8
Rank #69 / 172
2.6
Facility 2.6
IL AVG 3.7
Rank #28 / 172
2105A+
58
Facility 58
IL AVG 51
Rank #253 / 648
Il Ccrc, LLC
$16.2M
Facility $16.2M
IL AVG $12.2M
Rank #1 / 171
$15.9M
Facility $15.9M
IL AVG $4.8M
Rank #4 / 171
98.3%
Facility 98.3%
IL AVG 44.3%
Rank #171 / 171
145341
Smith Village
NH
AL
IL
MC
Chicago (South Side)
82
Facility 82
IL AVG 86
Rank #171 / 426
85.4%
Facility 85.4%
IL AVG 69.3%
Rank #57 / 204
+23%
5.28
Facility 5.28
IL AVG 3.10
Rank #10 / 172
+4%+70%
$0
Facility $0
IL AVG $151.3k
Rank #1 / 173
20
Facility 20
IL AVG 36.8
Rank #42 / 172
3.3
Facility 3.3
IL AVG 3.7
Rank #69 / 172
466A+
71
Facility 71
IL AVG 51
Rank #147 / 648
The Washington And Jane Smith Home
$11.0M
Facility $11.0M
IL AVG $12.2M
Rank #31 / 171
$8.0M
Facility $8.0M
IL AVG $4.8M
Rank #24 / 171
72.5%
Facility 72.5%
IL AVG 44.3%
Rank #108 / 171
145904
Montgomery Place
NH
AL
IL
MC
Chicago (East Hyde Park)
40
Facility 40
IL AVG 86
Rank #350 / 426
35.0%
Facility 35.0%
IL AVG 69.3%
Rank #189 / 204
-49%
4.00
Facility 4.00
IL AVG 3.10
Rank #42 / 172
+31%+29%
$51.6k
Facility $51.6k
IL AVG $151.3k
Rank #107 / 173
30
Facility 30
IL AVG 36.8
Rank #79 / 172
4.3
Facility 4.3
IL AVG 3.7
Rank #132 / 172
114A+
82
Facility 82
IL AVG 51
Rank #98 / 648
Margo Brooks Pugh
$13.8M
Facility $13.8M
IL AVG $12.2M
Rank #70 / 171
$6.9M
Facility $6.9M
IL AVG $4.8M
Rank #69 / 171
49.7%
Facility 49.7%
IL AVG 44.3%
Rank #86 / 171
145748
Senior Suites New City
NH
IL
Chicago (Back Of The Yards)
218
Facility 218
IL AVG 86
Rank #18 / 426
92.1%
Facility 92.1%
IL AVG 69.3%
Rank #28 / 204
+33%
2.33
Facility 2.33
IL AVG 3.10
Rank #146 / 172
+21%-25%
$92.2k
Facility $92.2k
IL AVG $151.3k
Rank #126 / 173
88
Facility 88
IL AVG 36.8
Rank #168 / 172
3.8
Facility 3.8
IL AVG 3.7
Rank #103 / 172
6197-
79
Facility 79
IL AVG 51
Rank #109 / 648
Zina Ward
$21.4M
Facility $21.4M
IL AVG $12.2M
Rank #25 / 171
$9.8M
Facility $9.8M
IL AVG $4.8M
Rank #26 / 171
45.6%
Facility 45.6%
IL AVG 44.3%
Rank #126 / 171
146001

Financial Assistance for
Nursing Home in Illinois

Senior Suites New City is located in Chicago, Illinois.
Here are the financial assistance programs available to residents in Illinois.

Get Financial aid guidance

Community Care Program

Illinois CCP

Age 60+
General Illinois resident, at risk of nursing home placement.
Income Limits (2025) ~$1,215/month individual
Asset Limits $17,500 individual, excludes home, car
IL

High demand in urban areas; waitlists possible.

Benefits
In-home care (3-5 hours/day) Adult day services ($65/day) Emergency home response systems ($30/month)

Illinois Respite Program

IL Respite (via NFCSP)

Age Caregiver of someone 60+ (or with dementia)
General Illinois resident.
Income Limits No strict limit; prioritizes low-income.
Asset Limits Not applicable.
IL

Limited slots; urban/rural balance.

Benefits
In-home respite (4-6 hours/day) Adult day care (~$65/day) Short-term facility care (up to 5 days)

Supportive Living Program (SLP)

Illinois Medicaid Supportive Living Program

Age 65+ or 22-64 with disability
General Illinois resident, Medicaid-eligible, needs moderate assistance (not nursing home-level).
Income Limits (2025) ~$2,829/month (300% FBR, individual); QIT allowed.
Asset Limits $2,000 (individual), $3,000 (couple) (excludes home, car).
IL

~200 SLP sites statewide; room/board not covered.

Benefits
Personal care (5-7 hours/day, e.g., bathing, mobility) Meals Housekeeping Medication management Respite (~240 hours/year)

Persons Who Are Elderly Waiver

Illinois Medicaid Elderly Waiver

Age 65+
General Illinois resident, Medicaid-eligible, nursing home-level care need.
Income Limits (2025) ~$2,829/month 300% FBR, individual
Asset Limits $2,000 (individual), $3,000 (couple).
IL

Part of HealthChoice Illinois; consumer-directed options available.

Benefits
Personal care (5-7 hours/day, e.g., dressing, eating) Homemaker Adult day care (~$60/day) Respite (240 hours/year) Home mods ($1,000 avg.)

Medicare Savings Program (MSP)

Illinois Medicare Savings Program

Age 65+ or disabled
General Illinois resident, Medicare Part A/B.
Income Limits (2025) ~$2,510/month (QMB), ~$3,380/month (SLMB), ~$3,598/month (QI)—individual.
Asset Limits $9,430 (individual), $14,130 (couple).
IL

Three tiers; no waitlist.

Benefits
Covers Part B premiums ($174.70/month) Deductibles ($240/year) Copays (~20%)

Optional State Supplementation (OSS)

Illinois Optional State Supplementation

Age 65+ or disabled
General Illinois resident, in approved facility, SSI recipient or low-income.
Income Limits (2025) ~$1,004/month including SSI
Asset Limits $2,000 (individual), $3,000 (couple).
IL

~$50-$500/month based on facility type.

Benefits
Cash (~$50-$500/month) for room/board in personal care homes or SLFs

VA Aid and Attendance (A&A) and Housebound Benefits

Illinois VA Aid and Attendance/Housebound

Age 65+ or disabled veteran/spouse
General Illinois resident, wartime service, need for ADL help (A&A) or homebound.
Income Limits (2025) Net income < ~$1,984/month (veteran with dependent, A&A); pension offsets income.
Asset Limits ~$155,356 net worth limit
IL

High veteran demand in urban/rural areas.

Benefits
Cash (~$1,433-$2,642/month veteran, ~$951-$1,318 spouse) for care costs (e.g., in-home, assisted living)

Frequently Asked Questions about Senior Suites New City

What neighborhood is Senior Suites New City in?

Senior Suites New City is in the Back of the Yards neighborhood.

Is Senior Suites New City in a walkable area?

Senior Suites New City has a walk score of 79. Very walkable. Most errands can be accomplished on foot, and many essentials are within a short walk.

What is the occupancy rate at Senior Suites New City?

Senior Suites New City's occupancy is 92.1%.

Are there photos of Senior Suites New City?

Yes — there are 4 photos of Senior Suites New City in the photo gallery on this page.

What is the phone number of Senior Suites New City?

(773) 523-9333 will put you in contact with the team at Senior Suites New City.

Is Senior Suites New City Medicare or Medicaid certified?

Yes — Senior Suites New City is a CMS-certified provider of Medicare and Medicaid.

Guides for Better Senior Living

Care Cost Calculator: See Prices in Your Area

Nursing Home Data Explorer

Don’t Wait Too Long: 7 Red Flag Signs Your Parent Needs Assisted Living Now

The True Cost of Assisted Living in 2025 – And How Families Are Paying For It

Understanding Senior Living Costs: Pricing Models, Discounts & Financial Assistance