


Compare Assisted Living around Annapolis
The information below is reported by the Maryland Department of Health, Office of Health Care Quality.
| Ginger Cove | AL HC IL MC NH SNF | Annapolis (River Crescent Drive) | 96
Facility
96
MD AVG
43
Rank
#136 / 690 | No |
51
Facility
51
MD AVG
43
Rank
#413 / 985 | 1 Bed / 2 Bed | 42
Facility
42
MD AVG
21
Rank
#8 / 210 |
40% Male Residents — State Benchmarked 40% of residents are male, compared to the Maryland average of 31%. A relatively balanced gender mix for assisted living, where facilities typically skew heavily female. |
60% Female Residents — State Benchmarked 60% of residents are female, compared to the Maryland average of 69%. Closer to an even gender split than most assisted living facilities, which typically have 65–75% female residents. |
100% White Residents — State Benchmarked 100% of residents are reported as White, compared to the Maryland average of 81%. A higher White share than is typical for assisted living in Maryland in this dataset — compare with peer facilities for local context. |
0% African American Residents — State Benchmarked 0% of residents are reported as African American or Black, compared to the Maryland average of 13%. A lower African American share than is typical in Maryland; local markets still vary widely. |
0% Other Ethnicity Residents — State Benchmarked 0% of residents fall into categories other than White or African American (combined), compared to the Maryland average of 6%. This column aggregates Hispanic, Asian, multiracial, and any other labeled groups that are not classified as White or African American. | - |
13% Residents Age 75–84 — State Benchmarked 13% of residents are 75–84, compared to the Maryland average of 31%. Below the state norm — the resident mix may skew either younger or older than this typical middle bracket. |
64% Residents Age 85–94 — State Benchmarked 64% of residents are 85–94, compared to the Maryland average of 44%. A high concentration of very elderly residents signals a higher-acuity facility with experience caring for advanced age-related needs. |
22% Residents Age 95+ — State Benchmarked 22% of residents are 95 or older, compared to the Maryland average of 16%. A high proportion of the oldest-old suggests strong end-of-life care experience and very-high-acuity capabilities. |
| Baywoods of Annapolis | AL IL MC | Annapolis (Bay Front Drive) | - | Yes |
28
Facility
28
MD AVG
43
Rank
#659 / 985 | 1 Bed / 2 Bed | 17
Facility
17
MD AVG
21
Rank
#121 / 210 | - | - | - | - | - | - | - | - | - |
| Sunrise of Annapolis | AL HOS MC | Annapolis | 106
Facility
106
MD AVG
43
Rank
#102 / 690 | Yes |
38
Facility
38
MD AVG
43
Rank
#542 / 985 | Studio / 1 Bed / 2 Bed | 30
Facility
30
MD AVG
21
Rank
#44 / 210 |
31% Male Residents — State Benchmarked 31% of residents are male, compared to the Maryland average of 31%. This facility caters to a majority female resident pool (69% female), consistent with the broader assisted living trend where women significantly outnumber men. |
69% Female Residents — State Benchmarked 69% of residents are female, compared to the Maryland average of 69%. Women comprise the large majority, consistent with national assisted living demographics where women live longer and enter care facilities at higher rates. |
90% White Residents — State Benchmarked 90% of residents are reported as White, compared to the Maryland average of 81%. A higher White share than is typical for assisted living in Maryland in this dataset — compare with peer facilities for local context. |
6% African American Residents — State Benchmarked 6% of residents are reported as African American or Black, compared to the Maryland average of 13%. In line with the Maryland average for African American residents among facilities reporting this breakdown. |
4% Other Ethnicity Residents — State Benchmarked 4% of residents fall into categories other than White or African American (combined), compared to the Maryland average of 6%. This column aggregates Hispanic, Asian, multiracial, and any other labeled groups that are not classified as White or African American. Reported subgroups in this total: American Indian (1%), Hawaiian/Pacific Islander (1%), Hispanic (1%). |
12% Residents Age 65–74 — State Benchmarked 12% of residents are 65–74, compared to the Maryland average of 13%. In line with the statewide profile for this youngest senior bracket in assisted living. |
22% Residents Age 75–84 — State Benchmarked 22% of residents are 75–84, compared to the Maryland average of 31%. Below the state norm — the resident mix may skew either younger or older than this typical middle bracket. |
65% Residents Age 85–94 — State Benchmarked 65% of residents are 85–94, compared to the Maryland average of 44%. A high concentration of very elderly residents signals a higher-acuity facility with experience caring for advanced age-related needs. | - |
| Bay Village of Annapolis | AL MC RC | Annapolis | 88
Facility
88
MD AVG
43
Rank
#157 / 690 | Yes |
75
Facility
75
MD AVG
43
Rank
#131 / 985 | Studio / 1 Bed | 5
Facility
5
MD AVG
21
Rank
#184 / 210 |
32% Male Residents — State Benchmarked 32% of residents are male, compared to the Maryland average of 31%. This facility caters to a majority female resident pool (68% female), consistent with the broader assisted living trend where women significantly outnumber men. |
68% Female Residents — State Benchmarked 68% of residents are female, compared to the Maryland average of 69%. Women comprise the large majority, consistent with national assisted living demographics where women live longer and enter care facilities at higher rates. |
99% White Residents — State Benchmarked 99% of residents are reported as White, compared to the Maryland average of 81%. A higher White share than is typical for assisted living in Maryland in this dataset — compare with peer facilities for local context. |
0% African American Residents — State Benchmarked 0% of residents are reported as African American or Black, compared to the Maryland average of 13%. A lower African American share than is typical in Maryland; local markets still vary widely. |
1% Other Ethnicity Residents — State Benchmarked 1% of residents fall into categories other than White or African American (combined), compared to the Maryland average of 6%. This column aggregates Hispanic, Asian, multiracial, and any other labeled groups that are not classified as White or African American. Reported subgroups in this total: Hispanic (1%). |
14% Residents Age 65–74 — State Benchmarked 14% of residents are 65–74, compared to the Maryland average of 13%. In line with the statewide profile for this youngest senior bracket in assisted living. |
28% Residents Age 75–84 — State Benchmarked 28% of residents are 75–84, compared to the Maryland average of 31%. This is the second most common age bracket in assisted living, representing residents with moderate care needs. |
50% Residents Age 85–94 — State Benchmarked 50% of residents are 85–94, compared to the Maryland average of 44%. A high concentration of very elderly residents signals a higher-acuity facility with experience caring for advanced age-related needs. |
8% Residents Age 95+ — State Benchmarked 8% of residents are 95 or older, compared to the Maryland average of 16%. Most residents here have not yet reached the oldest-old bracket, suggesting a younger overall community. |
| Brightview Annapolis | AL IL MC | Annapolis | 85
Facility
85
MD AVG
43
Rank
#163 / 690 | Yes |
34
Facility
34
MD AVG
43
Rank
#590 / 985 | Studio / 1 Bed / 2 Bed | 8
Facility
8
MD AVG
21
Rank
#164 / 210 |
27% Male Residents — State Benchmarked 27% of residents are male, compared to the Maryland average of 31%. This facility caters to a majority female resident pool (73% female), consistent with the broader assisted living trend where women significantly outnumber men. |
73% Female Residents — State Benchmarked 73% of residents are female, compared to the Maryland average of 69%. Women comprise the large majority, consistent with national assisted living demographics where women live longer and enter care facilities at higher rates. |
97% White Residents — State Benchmarked 97% of residents are reported as White, compared to the Maryland average of 81%. A higher White share than is typical for assisted living in Maryland in this dataset — compare with peer facilities for local context. |
0% African American Residents — State Benchmarked 0% of residents are reported as African American or Black, compared to the Maryland average of 13%. A lower African American share than is typical in Maryland; local markets still vary widely. |
3% Other Ethnicity Residents — State Benchmarked 3% of residents fall into categories other than White or African American (combined), compared to the Maryland average of 6%. This column aggregates Hispanic, Asian, multiracial, and any other labeled groups that are not classified as White or African American. Reported subgroups in this total: Hispanic (3%). |
3% Residents Age 65–74 — State Benchmarked 3% of residents are 65–74, compared to the Maryland average of 13%. Fewer younger seniors suggests the resident population skews older, likely requiring higher acuity care and more hands-on support. |
27% Residents Age 75–84 — State Benchmarked 27% of residents are 75–84, compared to the Maryland average of 31%. This is the second most common age bracket in assisted living, representing residents with moderate care needs. |
59% Residents Age 85–94 — State Benchmarked 59% of residents are 85–94, compared to the Maryland average of 44%. A high concentration of very elderly residents signals a higher-acuity facility with experience caring for advanced age-related needs. |
9% Residents Age 95+ — State Benchmarked 9% of residents are 95 or older, compared to the Maryland average of 16%. Most residents here have not yet reached the oldest-old bracket, suggesting a younger overall community. |
| Brightview South River | AL MC | Edgewater (Lee Airpark Drive) | 100
Facility
100
MD AVG
43
Rank
#114 / 690 | Yes |
49
Facility
49
MD AVG
43
Rank
#431 / 985 | Studio / 1 Bed / 2 Bed | 14
Facility
14
MD AVG
21
Rank
#140 / 210 |
30% Male Residents — State Benchmarked 30% of residents are male, compared to the Maryland average of 31%. This facility caters to a majority female resident pool (70% female), consistent with the broader assisted living trend where women significantly outnumber men. |
70% Female Residents — State Benchmarked 70% of residents are female, compared to the Maryland average of 69%. Women comprise the large majority, consistent with national assisted living demographics where women live longer and enter care facilities at higher rates. |
95% White Residents — State Benchmarked 95% of residents are reported as White, compared to the Maryland average of 81%. A higher White share than is typical for assisted living in Maryland in this dataset — compare with peer facilities for local context. |
1% African American Residents — State Benchmarked 1% of residents are reported as African American or Black, compared to the Maryland average of 13%. A lower African American share than is typical in Maryland; local markets still vary widely. |
4% Other Ethnicity Residents — State Benchmarked 4% of residents fall into categories other than White or African American (combined), compared to the Maryland average of 6%. This column aggregates Hispanic, Asian, multiracial, and any other labeled groups that are not classified as White or African American. Reported subgroups in this total: Hispanic (2%), Mixed Race (1%). |
2% Residents Age 65–74 — State Benchmarked 2% of residents are 65–74, compared to the Maryland average of 13%. Fewer younger seniors suggests the resident population skews older, likely requiring higher acuity care and more hands-on support. |
52% Residents Age 75–84 — State Benchmarked 52% of residents are 75–84, compared to the Maryland average of 31%. A high concentration in this mid-range bracket, where residents typically need moderate support with daily activities. |
37% Residents Age 85–94 — State Benchmarked 37% of residents are 85–94, compared to the Maryland average of 44%. The population here skews younger than the statewide norm, which may indicate a more active, lower-acuity community. |
9% Residents Age 95+ — State Benchmarked 9% of residents are 95 or older, compared to the Maryland average of 16%. Most residents here have not yet reached the oldest-old bracket, suggesting a younger overall community. |
| Celebration Villa of Manresa | AL RC | Annapolis (Arnold) | 86
Facility
86
MD AVG
43
Rank
#162 / 690 | Yes |
2
Facility
2
MD AVG
43
Rank
#940 / 985 | Studio / 1 Bed | 3
Facility
3
MD AVG
21
Rank
#203 / 210 |
35% Male Residents — State Benchmarked 35% of residents are male, compared to the Maryland average of 31%. This facility caters to a majority female resident pool (65% female), consistent with the broader assisted living trend where women significantly outnumber men. |
65% Female Residents — State Benchmarked 65% of residents are female, compared to the Maryland average of 69%. Women comprise the large majority, consistent with national assisted living demographics where women live longer and enter care facilities at higher rates. |
97% White Residents — State Benchmarked 97% of residents are reported as White, compared to the Maryland average of 81%. A higher White share than is typical for assisted living in Maryland in this dataset — compare with peer facilities for local context. |
3% African American Residents — State Benchmarked 3% of residents are reported as African American or Black, compared to the Maryland average of 13%. A lower African American share than is typical in Maryland; local markets still vary widely. |
0% Other Ethnicity Residents — State Benchmarked 0% of residents fall into categories other than White or African American (combined), compared to the Maryland average of 6%. This column aggregates Hispanic, Asian, multiracial, and any other labeled groups that are not classified as White or African American. |
8% Residents Age 65–74 — State Benchmarked 8% of residents are 65–74, compared to the Maryland average of 13%. Fewer younger seniors suggests the resident population skews older, likely requiring higher acuity care and more hands-on support. |
52% Residents Age 75–84 — State Benchmarked 52% of residents are 75–84, compared to the Maryland average of 31%. A high concentration in this mid-range bracket, where residents typically need moderate support with daily activities. |
27% Residents Age 85–94 — State Benchmarked 27% of residents are 85–94, compared to the Maryland average of 44%. The population here skews younger than the statewide norm, which may indicate a more active, lower-acuity community. |
13% Residents Age 95+ — State Benchmarked 13% of residents are 95 or older, compared to the Maryland average of 16%. In line with the statewide profile for the oldest resident bracket. |
| Integracare | AL IL MC RC | Annapolis | - | Yes |
70
Facility
70
MD AVG
43
Rank
#184 / 985 | Studio / 1 Bed / 2 Bed | - | - | - | - | - | - | - | - | - | - |
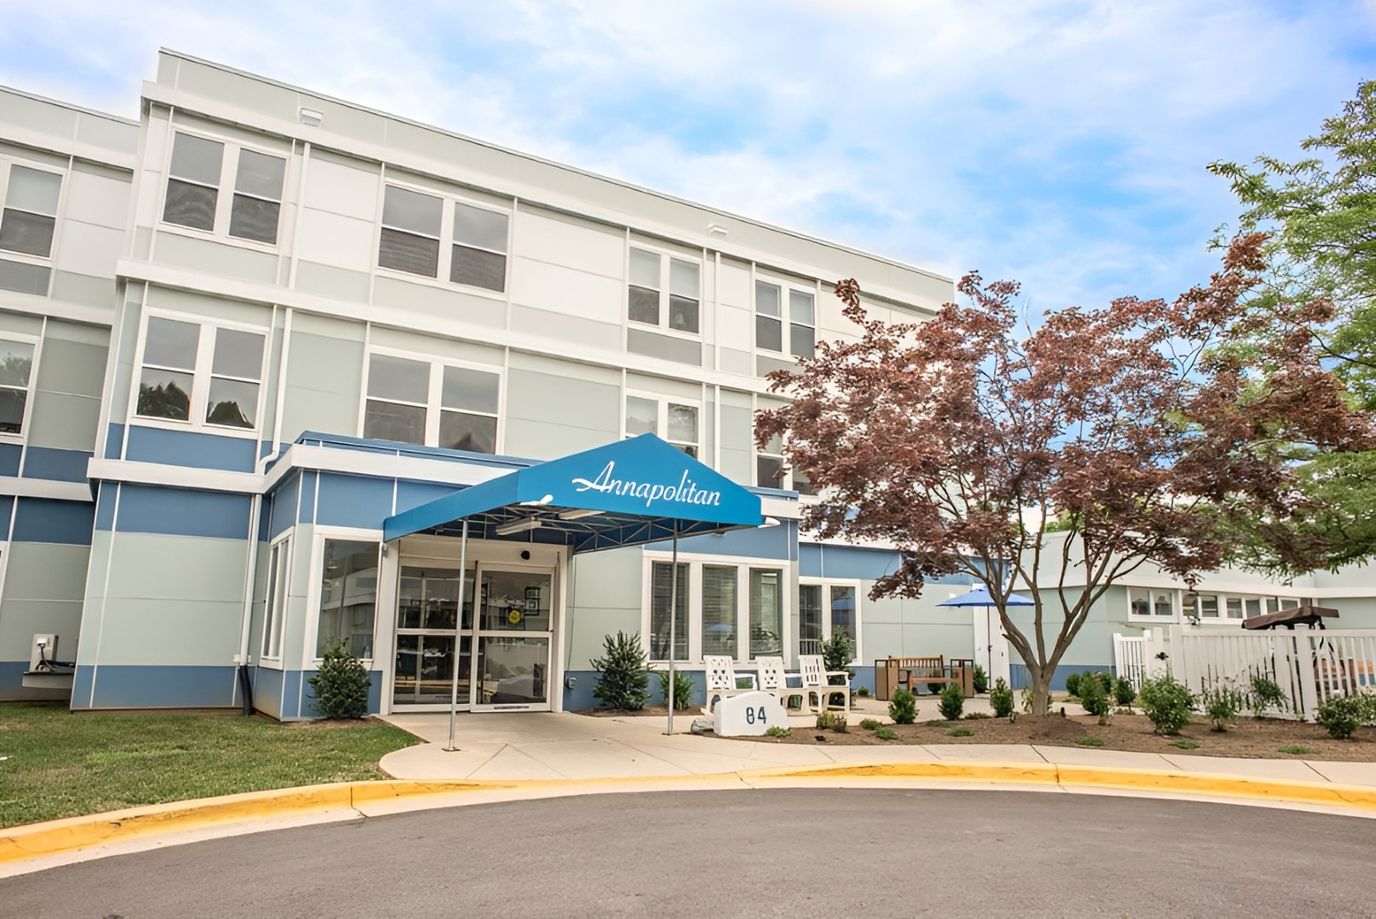
| Annapolitan Assisted Living | AL MC | Annapolis | - | Yes |
31
Facility
31
MD AVG
43
Rank
#620 / 985 | Private Studio / Companion Suites | - | - | - | - | - | - | - | - | - | - |
| Baywoods of Annapolis | AL IL MC | Annapolis | - | No |
25
Facility
25
MD AVG
43
Rank
#684 / 985 | - | - | - | - | - | - | - | - | - | - | - |
| Heart Homes At Bay Ridge | AL MC RC | Annapolis | - | No |
54
Facility
54
MD AVG
43
Rank
#380 / 985 | - | - | - | - | - | - | - | - | - | - | - |
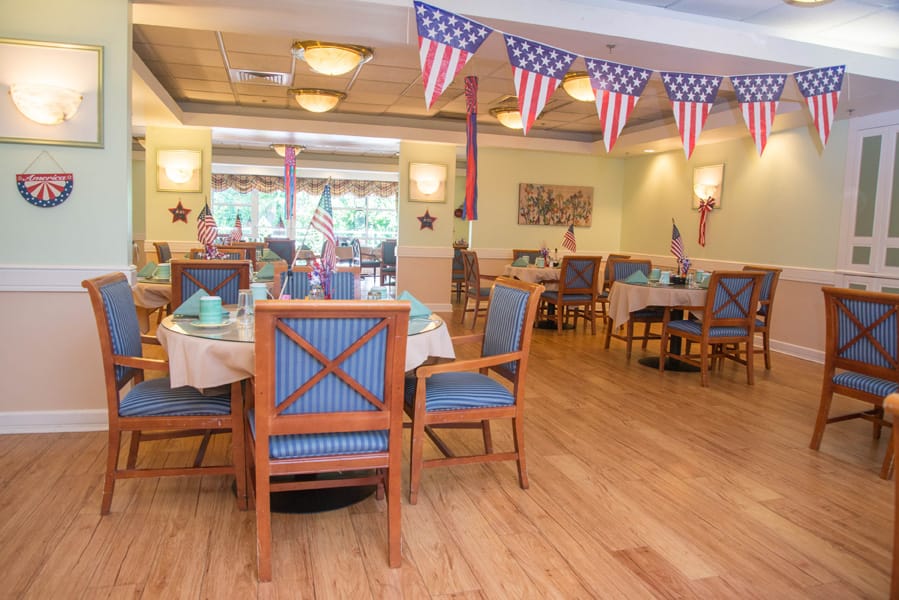
Annapolitan Care Center, Inc. in Annapolis, MD, is an assisted living community that offers personal care, rehabilitation, and respite care. Promoting a home-like and supportive environment, the community ensures older adults are well-cared for. With chef-prepared dining, daily housekeeping, and laundry, residents can maintain their independence. Along with licensed professional nurses, personalized care plans are also provided to meet residents’ unique needs and preferences.
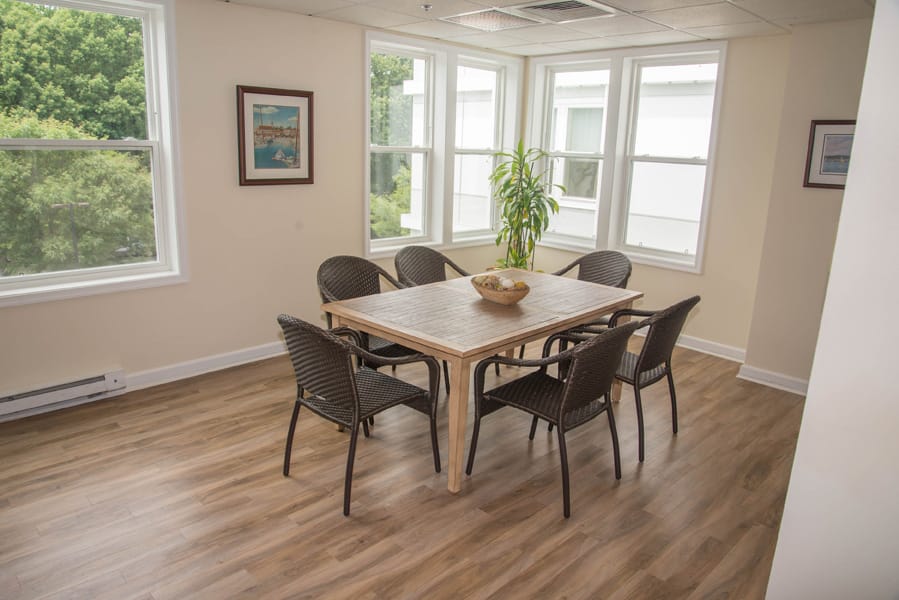
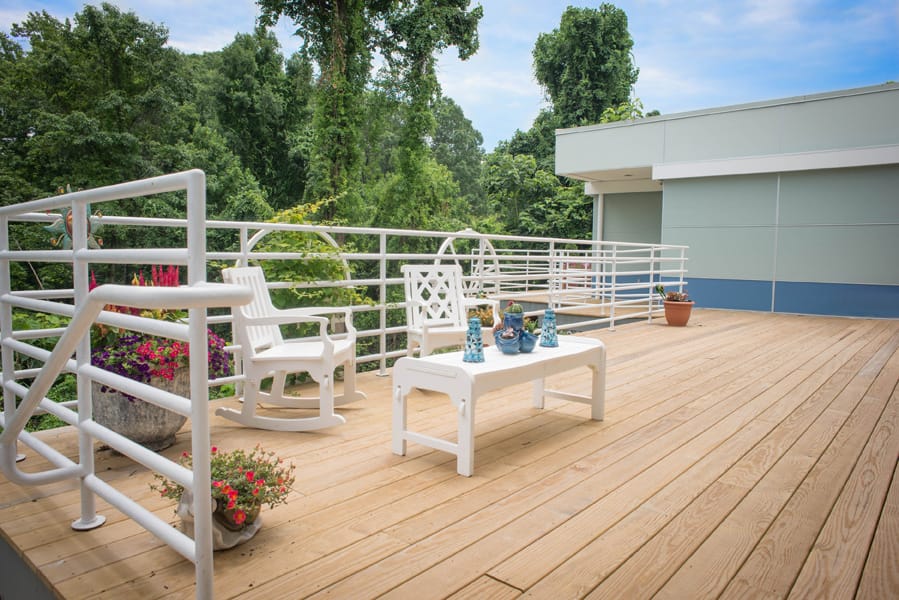
Educational programs, social events, and recreational activities help residents maintain their holistic well-being and stay active. With accessible rooms, a library, a walking garden, and a spacious recreation room, residents can rest and move around comfortably. Set along Blue Star Memorial Highway in Annapolis, the community guarantees accessibility and convenience. Providing exceptional standards of care for older adults’ welfare, this assisted living community is a great choice for senior living in Maryland.
Baywood of Annapolis has a solid reputation for offering assisted living and memory care services. The nurturing environment empowers and enhances the quality of life for residents by providing tailored care to each unique individual. The results-driven community follows a resident-centered approach to holistic wellness for seniors. Baywoods of Annapolis is a pleasant, home-like environment where residents can boost their vibrant social life.
Lifelong learning through engaging and enriching activities is one of the learning features they want to keep alive in the community. All-inclusive amenities and services include a library, recreational center, and an elegant dining room; with services such as housekeeping and linen, transportation, daily activities, and programs.
Overview of Heart Homes at Bay Ridge

Heart Homes at Bay Ridge is one of the trusted assisted living homes in the city. They understand that an enriching senior living experience begins with the right lifestyle that reinvents the meaning of senior care. The assisted living community assures that all of its residents to still live freely on their own terms while receiving the necessary support.
Heart Homes at Bay Ridge strive to meet and satisfy the needs of each individual. The home offers a list of services that include 24-hour nursing supervision, transportation, housekeeping, medication management, recreational activities, single floor with handicap accessibility, and cozy outdoor and indoor common areas.
Ranking Methodology
How we rank these assisted living communities
Every community above is evaluated across six weighted categories using public data including state inspection records, review platforms, BBB profiles, and operator-published materials.
Weighting overview
- 35%Resident Experience
- 25%Regulatory
- 15%Visual Media
- 10%Website
- 10%Stability
- 5%Environment
01
Resident & Family Experience 35%
The single largest share of every ranking. Aggregated review sentiment and volume from major platforms — the closest signal to real resident experience.
- Includes
- Review Sentiment
- Review Volume
02
Regulatory & Safety Record 25%
State inspection records, citations, and complaint visits. We weight per-inspection rates more heavily than raw counts.
- Includes
- State Inspections
- Citations/Inspection
- % Inspections w/ Citations
- Complaint Visits
- Accreditations
- BBB Rating
03
Visual Media & Transparency 15%
Communities that publish high-quality visuals give families a real preview. No photos or tours = a negative transparency signal.
- Includes
- Video Tours
- Virtual Walkthroughs
- Photo Quantity
- Photo Quality
04
Website & Operator Transparency 10%
Site quality and whether the operator publishes basic accountability information — staff names, contact details, ownership.
- Includes
- Website Content
- Mobile Usability
- Staff Info Available
- Owner Info Available
05
Community Stability 10%
Operational signals indicating whether a community is well-run and meeting demand.
- Includes
- Occupancy Rate
- Bed Options
06
Environment & Pricing 5%
Walkability and pricing transparency. Walk Score is weighted higher for Independent Living than for Memory Care, where most residents do not leave unaccompanied.
- Includes
- Walk Score
- Pricing Transparency
Who we are
Your Senior Care Partner, Every Step of the Way
We help families find affordable senior communities and unlock same day discounts, Medicaid, and Medicare options tailored to your needs.
Contact us Today
Frequently Asked Questions about Assisted Living in Annapolis, MD
What is the average cost of assisted living in Annapolis, MD?
The average monthly cost of assisted living in Annapolis, MD is approximately $6,300. Actual rates vary by community, level of care, and floorplan.
What is the price range for assisted living in Annapolis, MD?
Assisted living in Annapolis, MD typically ranges from $5,800–$8,400 per month, depending on the community, room type, and care needs.
What is the typical staff-to-resident ratio at assisted living facilities in Annapolis, MD?
Assisted living facilities in Annapolis, MD typically operate with a staff-to-resident ratio in the range of 1:6 to 1:12.
What's the difference between assisted living and memory care in Maryland?
Assisted living in Maryland supports residents with daily activities (bathing, dressing, medication management) while preserving independence. Memory care is a specialized form of assisted living for residents living with Alzheimer's or dementia, and adds 24/7 secured environments, dementia-trained staff, and structured routines designed to reduce confusion and wandering.
What's the difference between assisted living and a nursing home in Maryland?
Assisted living in Maryland is a residential model focused on housing, hospitality, and help with daily activities. Nursing homes (skilled nursing facilities) provide 24/7 medical care from licensed nurses for residents with significant health needs, and are regulated more strictly under both state and federal CMS rules.
Does Maryland Medicaid cover assisted living?
Maryland Medicaid does not directly pay room-and-board for assisted living, but most states (including Maryland) offer Home and Community-Based Services (HCBS) waivers that can offset the cost of care services delivered inside a licensed community. Eligibility, waitlists, and covered services vary — check directly with the state Medicaid agency.
What is assisted living?
Assisted living combines private or semi-private apartments with help on activities of daily living (meals, bathing, dressing, medication management) and a social calendar — for residents who need some support but do not need 24/7 medical care.
Updated on
