


Compare Assisted Living around Silver Spring
Info below is compiled from the MD Dept. of Health (OHCQ), senior community websites & trusted data sources such as Walk Score & BBB.
Communities are listed from highest to lowest based on our ranking methodology.
| Bedford Court, a CCRC | AL HOS IL MC NH RC SNF | Silver Spring (International Drive) | 76
Facility
76
MD AVG
42
Rank
#174 / 685 | Yes |
64
Facility
64
MD AVG
43
Rank
#261 / 985 | Studio / 1 Bed | 34
Facility
34
MD AVG
21
Rank
#22 / 210 |
15% Male Residents — State Benchmarked 15% of residents are male, compared to the Maryland average of 31%. This facility caters to a majority female resident pool (85% female), consistent with the broader assisted living trend where women significantly outnumber men. |
85% Female Residents — State Benchmarked 85% of residents are female, compared to the Maryland average of 69%. Women comprise the large majority, consistent with national assisted living demographics where women live longer and enter care facilities at higher rates. |
95% White Residents — State Benchmarked 95% of residents are reported as White, compared to the Maryland average of 81%. A higher White share than is typical for assisted living in Maryland in this dataset — compare with peer facilities for local context. |
3% African American Residents — State Benchmarked 3% of residents are reported as African American or Black, compared to the Maryland average of 13%. A lower African American share than is typical in Maryland; local markets still vary widely. |
2% Other Ethnicity Residents — State Benchmarked 2% of residents fall into categories other than White or African American (combined), compared to the Maryland average of 6%. This column aggregates Hispanic, Asian, multiracial, and any other labeled groups that are not classified as White or African American. Reported subgroups in this total: Asian (2%). |
2% Residents Age 65–74 — State Benchmarked 2% of residents are 65–74, compared to the Maryland average of 13%. Fewer younger seniors suggests the resident population skews older, likely requiring higher acuity care and more hands-on support. |
8% Residents Age 75–84 — State Benchmarked 8% of residents are 75–84, compared to the Maryland average of 31%. Below the state norm — the resident mix may skew either younger or older than this typical middle bracket. |
65% Residents Age 85–94 — State Benchmarked 65% of residents are 85–94, compared to the Maryland average of 44%. A high concentration of very elderly residents signals a higher-acuity facility with experience caring for advanced age-related needs. |
26% Residents Age 95+ — State Benchmarked 26% of residents are 95 or older, compared to the Maryland average of 16%. A high proportion of the oldest-old suggests strong end-of-life care experience and very-high-acuity capabilities. |
| Bedford Court | AL HOS IL MC NH RC SNF | Silver Spring (International Drive) | 76
Facility
76
MD AVG
42
Rank
#174 / 685 | Yes |
66
Facility
66
MD AVG
43
Rank
#240 / 985 | Studio / 1 Bed / 2 Bed | 34
Facility
34
MD AVG
21
Rank
#22 / 210 |
15% Male Residents — State Benchmarked 15% of residents are male, compared to the Maryland average of 31%. This facility caters to a majority female resident pool (85% female), consistent with the broader assisted living trend where women significantly outnumber men. |
85% Female Residents — State Benchmarked 85% of residents are female, compared to the Maryland average of 69%. Women comprise the large majority, consistent with national assisted living demographics where women live longer and enter care facilities at higher rates. |
95% White Residents — State Benchmarked 95% of residents are reported as White, compared to the Maryland average of 81%. A higher White share than is typical for assisted living in Maryland in this dataset — compare with peer facilities for local context. |
3% African American Residents — State Benchmarked 3% of residents are reported as African American or Black, compared to the Maryland average of 13%. A lower African American share than is typical in Maryland; local markets still vary widely. |
2% Other Ethnicity Residents — State Benchmarked 2% of residents fall into categories other than White or African American (combined), compared to the Maryland average of 6%. This column aggregates Hispanic, Asian, multiracial, and any other labeled groups that are not classified as White or African American. Reported subgroups in this total: Asian (2%). |
2% Residents Age 65–74 — State Benchmarked 2% of residents are 65–74, compared to the Maryland average of 13%. Fewer younger seniors suggests the resident population skews older, likely requiring higher acuity care and more hands-on support. |
8% Residents Age 75–84 — State Benchmarked 8% of residents are 75–84, compared to the Maryland average of 31%. Below the state norm — the resident mix may skew either younger or older than this typical middle bracket. |
65% Residents Age 85–94 — State Benchmarked 65% of residents are 85–94, compared to the Maryland average of 44%. A high concentration of very elderly residents signals a higher-acuity facility with experience caring for advanced age-related needs. |
26% Residents Age 95+ — State Benchmarked 26% of residents are 95 or older, compared to the Maryland average of 16%. A high proportion of the oldest-old suggests strong end-of-life care experience and very-high-acuity capabilities. |
| Riderwood Village | AL IL MC | Silver Spring | 275
Facility
275
MD AVG
42
Rank
#3 / 685 | Yes |
33
Facility
33
MD AVG
43
Rank
#597 / 985 | - | 23
Facility
23
MD AVG
21
Rank
#101 / 210 |
29% Male Residents — State Benchmarked 29% of residents are male, compared to the Maryland average of 31%. This facility caters to a majority female resident pool (71% female), consistent with the broader assisted living trend where women significantly outnumber men. |
71% Female Residents — State Benchmarked 71% of residents are female, compared to the Maryland average of 69%. Women comprise the large majority, consistent with national assisted living demographics where women live longer and enter care facilities at higher rates. |
89% White Residents — State Benchmarked 89% of residents are reported as White, compared to the Maryland average of 81%. Close to the average for this category among assisted living facilities in Maryland with reported race/ethnicity data. |
7% African American Residents — State Benchmarked 7% of residents are reported as African American or Black, compared to the Maryland average of 13%. In line with the Maryland average for African American residents among facilities reporting this breakdown. |
4% Other Ethnicity Residents — State Benchmarked 4% of residents fall into categories other than White or African American (combined), compared to the Maryland average of 6%. This column aggregates Hispanic, Asian, multiracial, and any other labeled groups that are not classified as White or African American. Reported subgroups in this total: Asian (3%), Hispanic (0%). |
2% Residents Age 65–74 — State Benchmarked 2% of residents are 65–74, compared to the Maryland average of 13%. Fewer younger seniors suggests the resident population skews older, likely requiring higher acuity care and more hands-on support. |
23% Residents Age 75–84 — State Benchmarked 23% of residents are 75–84, compared to the Maryland average of 31%. Below the state norm — the resident mix may skew either younger or older than this typical middle bracket. |
52% Residents Age 85–94 — State Benchmarked 52% of residents are 85–94, compared to the Maryland average of 44%. A high concentration of very elderly residents signals a higher-acuity facility with experience caring for advanced age-related needs. |
23% Residents Age 95+ — State Benchmarked 23% of residents are 95 or older, compared to the Maryland average of 16%. A high proportion of the oldest-old suggests strong end-of-life care experience and very-high-acuity capabilities. |
| Sunrise of Chevy Chase | AL MC | Silver Spring (Rock Creek Gardens) | 196
Facility
196
MD AVG
42
Rank
#10 / 685 | No |
71
Facility
71
MD AVG
43
Rank
#175 / 985 | Studio / 1 Bed / 2 Bed | 8
Facility
8
MD AVG
21
Rank
#164 / 210 |
58% Male Residents — State Benchmarked 58% of residents are male, compared to the Maryland average of 31%. An unusually high male share for assisted living, where most facilities skew heavily female. |
42% Female Residents — State Benchmarked 42% of residents are female, compared to the Maryland average of 69%. An unusually low female share — most assisted living facilities have 65–75% female residents. |
69% White Residents — State Benchmarked 69% of residents are reported as White, compared to the Maryland average of 81%. A lower White share than the Maryland average — the community may draw a more diverse resident mix relative to other facilities in Maryland. |
28% African American Residents — State Benchmarked 28% of residents are reported as African American or Black, compared to the Maryland average of 13%. A higher African American share than the typical Maryland average — useful context when comparing cultural fit and community composition. |
3% Other Ethnicity Residents — State Benchmarked 3% of residents fall into categories other than White or African American (combined), compared to the Maryland average of 6%. This column aggregates Hispanic, Asian, multiracial, and any other labeled groups that are not classified as White or African American. Reported subgroups in this total: Hispanic (2%), Asian (1%). |
12% Residents Age 65–74 — State Benchmarked 12% of residents are 65–74, compared to the Maryland average of 13%. In line with the statewide profile for this youngest senior bracket in assisted living. |
39% Residents Age 75–84 — State Benchmarked 39% of residents are 75–84, compared to the Maryland average of 31%. A high concentration in this mid-range bracket, where residents typically need moderate support with daily activities. |
42% Residents Age 85–94 — State Benchmarked 42% of residents are 85–94, compared to the Maryland average of 44%. This is typically the most common age bracket in assisted living — this facility is in line with the statewide norm. |
6% Residents Age 95+ — State Benchmarked 6% of residents are 95 or older, compared to the Maryland average of 16%. Most residents here have not yet reached the oldest-old bracket, suggesting a younger overall community. |
| The Terraces at Westminster | AL MC RC | Westminster (Washington Heights) | 75
Facility
75
MD AVG
42
Rank
#176 / 685 | No |
76
Facility
76
MD AVG
43
Rank
#118 / 985 | - | 27
Facility
27
MD AVG
21
Rank
#62 / 210 |
22% Male Residents — State Benchmarked 22% of residents are male, compared to the Maryland average of 31%. This facility caters to a majority female resident pool (78% female), consistent with the broader assisted living trend where women significantly outnumber men. |
78% Female Residents — State Benchmarked 78% of residents are female, compared to the Maryland average of 69%. Women comprise the large majority, consistent with national assisted living demographics where women live longer and enter care facilities at higher rates. |
98% White Residents — State Benchmarked 98% of residents are reported as White, compared to the Maryland average of 81%. A higher White share than is typical for assisted living in Maryland in this dataset — compare with peer facilities for local context. |
2% African American Residents — State Benchmarked 2% of residents are reported as African American or Black, compared to the Maryland average of 13%. A lower African American share than is typical in Maryland; local markets still vary widely. |
0% Other Ethnicity Residents — State Benchmarked 0% of residents fall into categories other than White or African American (combined), compared to the Maryland average of 6%. This column aggregates Hispanic, Asian, multiracial, and any other labeled groups that are not classified as White or African American. |
22% Residents Age 65–74 — State Benchmarked 22% of residents are 65–74, compared to the Maryland average of 13%. A higher share of younger seniors often signals a more independent, active resident community with lower acuity care needs. |
46% Residents Age 75–84 — State Benchmarked 46% of residents are 75–84, compared to the Maryland average of 31%. A high concentration in this mid-range bracket, where residents typically need moderate support with daily activities. |
25% Residents Age 85–94 — State Benchmarked 25% of residents are 85–94, compared to the Maryland average of 44%. The population here skews younger than the statewide norm, which may indicate a more active, lower-acuity community. |
6% Residents Age 95+ — State Benchmarked 6% of residents are 95 or older, compared to the Maryland average of 16%. Most residents here have not yet reached the oldest-old bracket, suggesting a younger overall community. |
| Sunrise of Silver Spring | AL HOS MC RC | Silver Spring (New Hampshire Avenue) | 84
Facility
84
MD AVG
42
Rank
#160 / 685 | Yes |
40
Facility
40
MD AVG
43
Rank
#523 / 985 | Studio / 1 Bed / 2 Bed | 24
Facility
24
MD AVG
21
Rank
#93 / 210 |
31% Male Residents — State Benchmarked 31% of residents are male, compared to the Maryland average of 31%. This facility caters to a majority female resident pool (69% female), consistent with the broader assisted living trend where women significantly outnumber men. |
69% Female Residents — State Benchmarked 69% of residents are female, compared to the Maryland average of 69%. Women comprise the large majority, consistent with national assisted living demographics where women live longer and enter care facilities at higher rates. |
53% White Residents — State Benchmarked 53% of residents are reported as White, compared to the Maryland average of 81%. A lower White share than the Maryland average — the community may draw a more diverse resident mix relative to other facilities in Maryland. |
39% African American Residents — State Benchmarked 39% of residents are reported as African American or Black, compared to the Maryland average of 13%. A higher African American share than the typical Maryland average — useful context when comparing cultural fit and community composition. |
9% Other Ethnicity Residents — State Benchmarked 9% of residents fall into categories other than White or African American (combined), compared to the Maryland average of 6%. This column aggregates Hispanic, Asian, multiracial, and any other labeled groups that are not classified as White or African American. Reported subgroups in this total: Asian (4%), Hawaiian/Pacific Islander (3%), Hispanic (1%). |
4% Residents Age 65–74 — State Benchmarked 4% of residents are 65–74, compared to the Maryland average of 13%. Fewer younger seniors suggests the resident population skews older, likely requiring higher acuity care and more hands-on support. |
43% Residents Age 75–84 — State Benchmarked 43% of residents are 75–84, compared to the Maryland average of 31%. A high concentration in this mid-range bracket, where residents typically need moderate support with daily activities. |
37% Residents Age 85–94 — State Benchmarked 37% of residents are 85–94, compared to the Maryland average of 44%. The population here skews younger than the statewide norm, which may indicate a more active, lower-acuity community. |
14% Residents Age 95+ — State Benchmarked 14% of residents are 95 or older, compared to the Maryland average of 16%. In line with the statewide profile for the oldest resident bracket. |
| Seaton Silver Spring | AL IL | Silver Spring (Homecrest Road) | 55
Facility
55
MD AVG
42
Rank
#206 / 685 | Yes |
33
Facility
33
MD AVG
43
Rank
#597 / 985 | 1 Bed / 2 Bed | 36
Facility
36
MD AVG
21
Rank
#16 / 210 |
15% Male Residents — State Benchmarked 15% of residents are male, compared to the Maryland average of 31%. This facility caters to a majority female resident pool (85% female), consistent with the broader assisted living trend where women significantly outnumber men. |
85% Female Residents — State Benchmarked 85% of residents are female, compared to the Maryland average of 69%. Women comprise the large majority, consistent with national assisted living demographics where women live longer and enter care facilities at higher rates. |
79% White Residents — State Benchmarked 79% of residents are reported as White, compared to the Maryland average of 81%. Close to the average for this category among assisted living facilities in Maryland with reported race/ethnicity data. |
21% African American Residents — State Benchmarked 21% of residents are reported as African American or Black, compared to the Maryland average of 13%. A higher African American share than the typical Maryland average — useful context when comparing cultural fit and community composition. |
0% Other Ethnicity Residents — State Benchmarked 0% of residents fall into categories other than White or African American (combined), compared to the Maryland average of 6%. This column aggregates Hispanic, Asian, multiracial, and any other labeled groups that are not classified as White or African American. |
9% Residents Age 65–74 — State Benchmarked 9% of residents are 65–74, compared to the Maryland average of 13%. Fewer younger seniors suggests the resident population skews older, likely requiring higher acuity care and more hands-on support. |
21% Residents Age 75–84 — State Benchmarked 21% of residents are 75–84, compared to the Maryland average of 31%. Below the state norm — the resident mix may skew either younger or older than this typical middle bracket. |
38% Residents Age 85–94 — State Benchmarked 38% of residents are 85–94, compared to the Maryland average of 44%. The population here skews younger than the statewide norm, which may indicate a more active, lower-acuity community. |
32% Residents Age 95+ — State Benchmarked 32% of residents are 95 or older, compared to the Maryland average of 16%. A high proportion of the oldest-old suggests strong end-of-life care experience and very-high-acuity capabilities. |
| Brightview Crofton Riverwalk | AL IL MC | Crofton | 92
Facility
92
MD AVG
42
Rank
#146 / 685 | Yes |
45
Facility
45
MD AVG
43
Rank
#475 / 985 | Studio / 1 Bed / 2 Bed | 6
Facility
6
MD AVG
21
Rank
#178 / 210 |
27% Male Residents — State Benchmarked 27% of residents are male, compared to the Maryland average of 31%. This facility caters to a majority female resident pool (73% female), consistent with the broader assisted living trend where women significantly outnumber men. |
73% Female Residents — State Benchmarked 73% of residents are female, compared to the Maryland average of 69%. Women comprise the large majority, consistent with national assisted living demographics where women live longer and enter care facilities at higher rates. |
0% White Residents — State Benchmarked 0% of residents are reported as White, compared to the Maryland average of 81%. A lower White share than the Maryland average — the community may draw a more diverse resident mix relative to other facilities in Maryland. |
0% African American Residents — State Benchmarked 0% of residents are reported as African American or Black, compared to the Maryland average of 13%. A lower African American share than is typical in Maryland; local markets still vary widely. |
100% Other Ethnicity Residents — State Benchmarked 100% of residents fall into categories other than White or African American (combined), compared to the Maryland average of 6%. This column aggregates Hispanic, Asian, multiracial, and any other labeled groups that are not classified as White or African American. Reported subgroups in this total: Other (100%). | - | - | - | - |
| Grace House | AL HOS PC | Silver Spring | 32
Facility
32
MD AVG
42
Rank
#236 / 685 | No |
25
Facility
25
MD AVG
43
Rank
#684 / 985 | Studio / 1 Bed | 19
Facility
19
MD AVG
21
Rank
#117 / 210 |
29% Male Residents — State Benchmarked 29% of residents are male, compared to the Maryland average of 31%. This facility caters to a majority female resident pool (71% female), consistent with the broader assisted living trend where women significantly outnumber men. |
71% Female Residents — State Benchmarked 71% of residents are female, compared to the Maryland average of 69%. Women comprise the large majority, consistent with national assisted living demographics where women live longer and enter care facilities at higher rates. |
74% White Residents — State Benchmarked 74% of residents are reported as White, compared to the Maryland average of 81%. Close to the average for this category among assisted living facilities in Maryland with reported race/ethnicity data. |
23% African American Residents — State Benchmarked 23% of residents are reported as African American or Black, compared to the Maryland average of 13%. A higher African American share than the typical Maryland average — useful context when comparing cultural fit and community composition. |
3% Other Ethnicity Residents — State Benchmarked 3% of residents fall into categories other than White or African American (combined), compared to the Maryland average of 6%. This column aggregates Hispanic, Asian, multiracial, and any other labeled groups that are not classified as White or African American. Reported subgroups in this total: Hispanic (3%). |
6% Residents Age 65–74 — State Benchmarked 6% of residents are 65–74, compared to the Maryland average of 13%. Fewer younger seniors suggests the resident population skews older, likely requiring higher acuity care and more hands-on support. |
26% Residents Age 75–84 — State Benchmarked 26% of residents are 75–84, compared to the Maryland average of 31%. Below the state norm — the resident mix may skew either younger or older than this typical middle bracket. |
32% Residents Age 85–94 — State Benchmarked 32% of residents are 85–94, compared to the Maryland average of 44%. The population here skews younger than the statewide norm, which may indicate a more active, lower-acuity community. |
35% Residents Age 95+ — State Benchmarked 35% of residents are 95 or older, compared to the Maryland average of 16%. A high proportion of the oldest-old suggests strong end-of-life care experience and very-high-acuity capabilities. |
| Kensington Park | AL IL MC | Kensington (Littledale Road) | - | Yes |
49
Facility
49
MD AVG
43
Rank
#431 / 985 | Private Rooms / Semi-Private Rooms | - | - | - | - | - | - | - | - | - | - |
| Royals Assisted Living, LLC | AL | Silver Spring | - | No |
50
Facility
50
MD AVG
43
Rank
#419 / 985 | Private / Shared Rooms | - | - | - | - | - | - | - | - | - | - |
| Nu-Life Assisted Living at 13201 Partridge Dr. | AL HOS RESC RC | Silver Spring | - | No |
47
Facility
47
MD AVG
43
Rank
#459 / 985 | Private Rooms | - | - | - | - | - | - | - | - | - | - |
| Good Samaritan Assisted Living | AL HC HOS MC RC | Silver Spring (Sligo Woods) | - | No |
41
Facility
41
MD AVG
43
Rank
#508 / 985 | Private Rooms / Semi-Private Rooms | - | - | - | - | - | - | - | - | - | - |
| J’Rose Assisted Living | AL | Silver Spring (Franklin Knolls) | 8
Facility
8
MD AVG
42
Rank
#301 / 685 | No |
23
Facility
23
MD AVG
43
Rank
#704 / 985 | - | - | - | - | - | - | - | - | - | - | - |
| Victory Forest | AL IL | Silver Spring (Forest Glen) | - | Yes |
33
Facility
33
MD AVG
43
Rank
#597 / 985 | 1 Bed | - | - | - | - | - | - | - | - | - | - |
Rows per page:

View all Nearby Homes
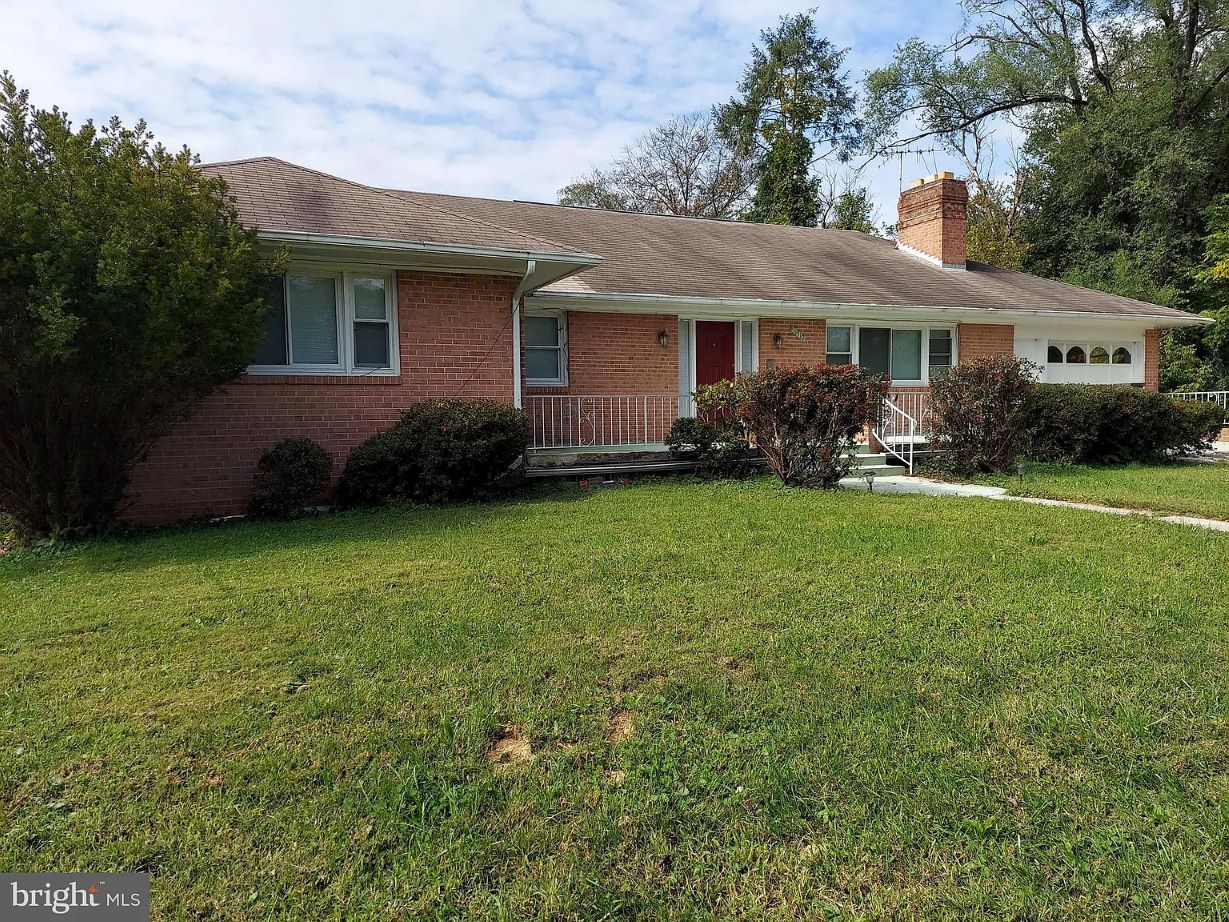
Enjoy a blissful retirement at Heritage Care Assisted Living Services Inc., a welcoming community in Silver Spring, MD, offering assisted living. With its cozy and nurturing environment, the community can accommodate up to six residents and provide the highest quality of care tailored to their unique needs around the clock. Residents can also keep their peace of mind, as housekeeping, laundry, and linens are taken care of.
With plenty of recreational activities and wellness opportunities, residents can spend their days as they please. Residents also enjoy mealtimes on their terms with delightful and healthy dining options that cater to their dietary needs and preferences. Transportation services are also available for convenience and safety. The community’s exceptional services and well-maintained amenities create the ideal setting for residents to make the most of their best years.
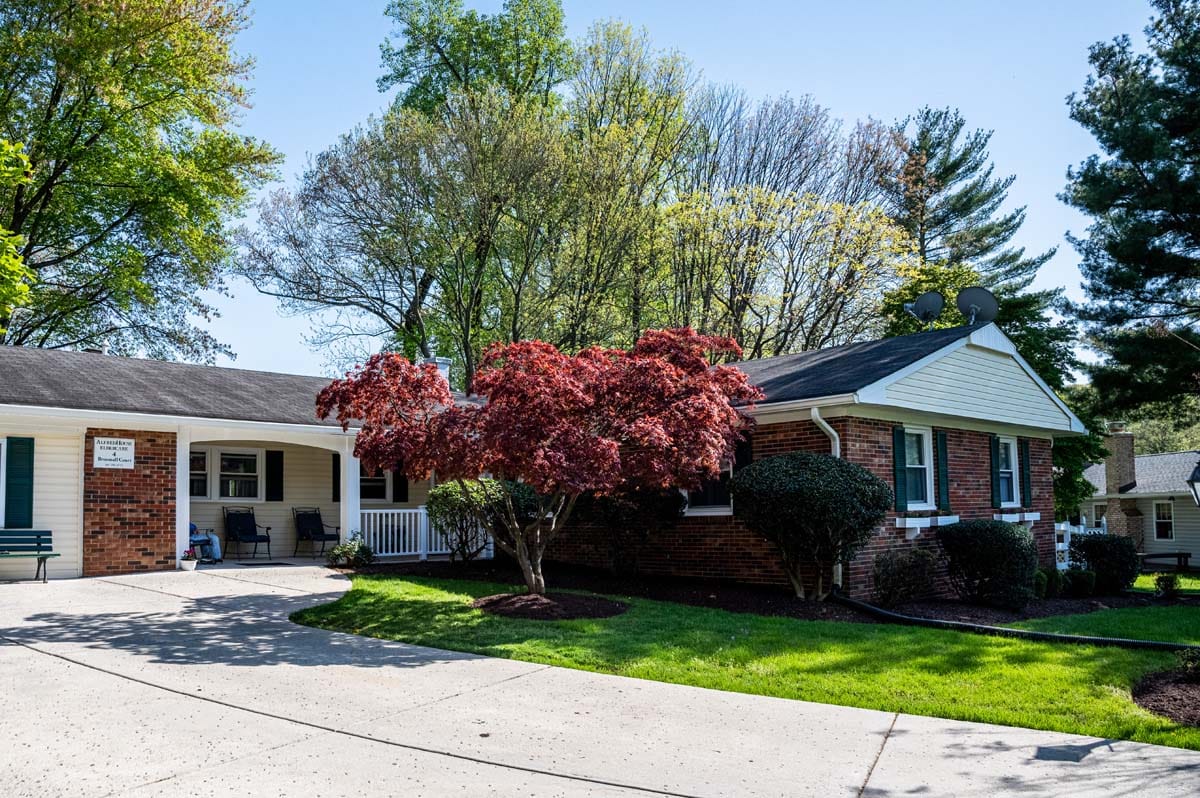
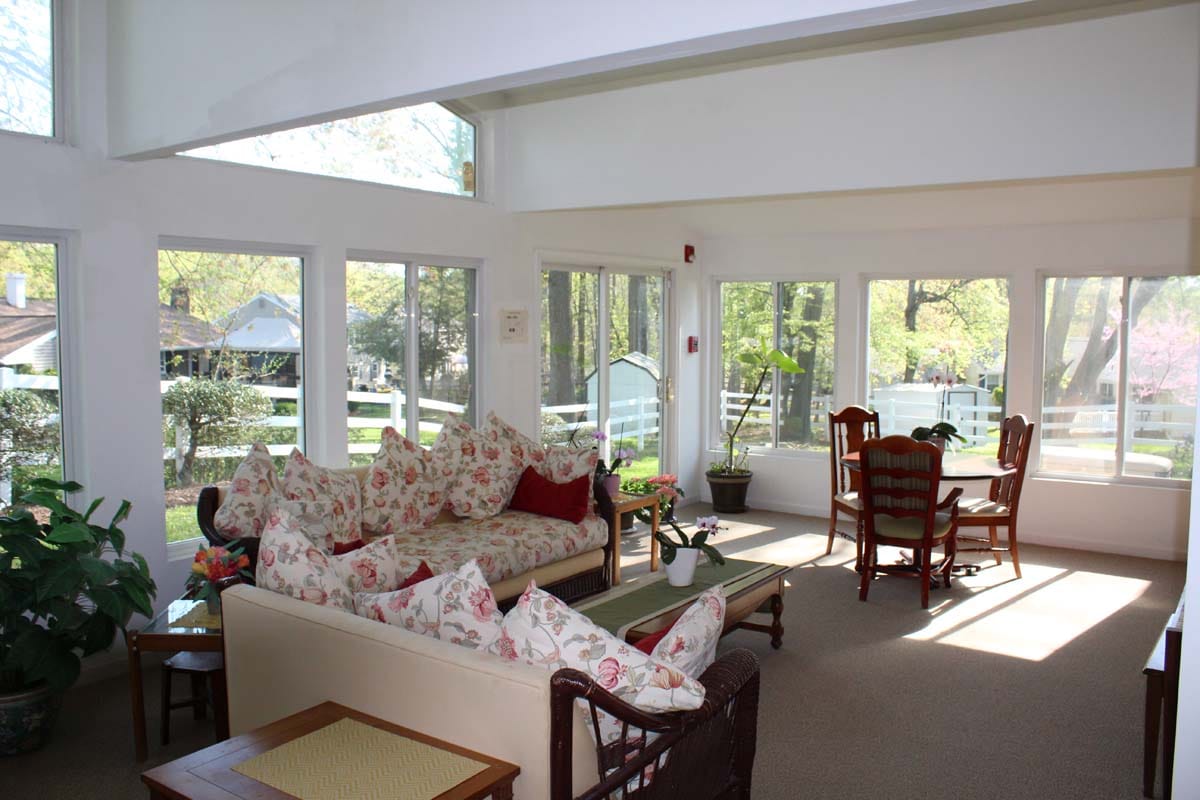
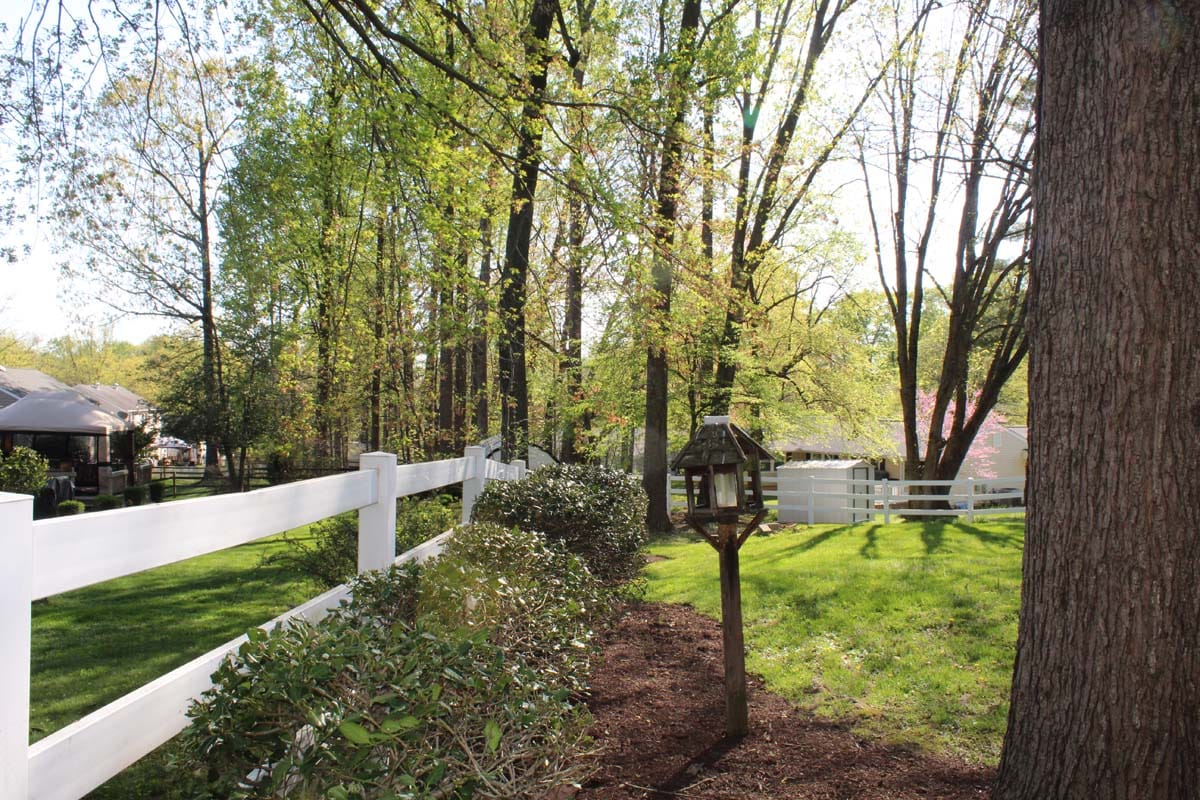
Nestled in a lovely suburban neighborhood of Silver Spring, MD, AlfredHouse II is an idyllic senior living community that offers assisted living, memory care, personal care, and respite care. This 8-bedroom community features 1:4 caregiver ratio and attentive individualized care, making it an ideal place for successfully aging in place. With access to on-site specialized therapies, BCAT certified memory care, mobility care, hospice care, and other care services, residents are guaranteed to receive the care they need to continue living the lifestyle they want.
The community makes sure residents live an inspiring and lively lifestyle by providing them with carefully curated daily activities and various fitness programs. Residents are also given access to emotional and behavioral support should they need it in the future. With a 24-hour care team and security, residents are guaranteed a safe living environment.
Live well and age well with Sunny Side Manor Communities III, a charming senior living community in Silver Spring, MD that offers assisted living services. The community offers 24-hour care and assistance within a safe and supportive environment, giving residents peace of mind. Access to services like assistance with daily living activities, medication management, and personal care are offered to help residents maintain a healthy lifestyle.
At Sunny Side Manor Communities III, meals are served daily with accommodations for special diets and nutritional needs. Vibrant and interesting activities are regularly held to keep residents entertained and happy. Residents also benefit from having access to transportation, housekeeping, and linen services that make their retirement easy and worry-free.
Surrounded by convenient local amenities including Bel Pre Healthcare Center in Silver Spring, MD, Caring Well at Blazer Lane is an astounding community that offers assisted living. With its quaint and specially designed spaces, the community strives to accommodate up to five residents. A compassionate and highly trained team also cares for residents’ personal needs and other household responsibilities to ensure a maintenance-free lifestyle.
Empowering residents to remain socially engaged and active, the community conducts fun activities and engaging programs tailored to their leisure and wellness. Here, special diets are also accommodated with delightful and healthy meals for a satisfactory dining experience. Incontinence care, medication administration, and transportation services are provided for comfort and convenience. The community is a great choice for those who need assistance to live their day-to-day activities in retirement with its dedicated care and friendly environment.
Overview of Assisted Living of Rockville V


Live a worry-free retirement with Assisted Living of Silver Spring V, located in the beautiful setting of Lawnsberry Terrace, Silver Spring, MD, offering assisted living. The community is dedicated to improving residents’ living experiences, providing them with top-notch care and assistance 24/7. Enjoy the best of your golden years with the community’s warm and inviting environment.
Here, residents are encouraged to live actively and remain socially engaged with fun activities and stimulating programs tailored to their leisure and wellness. Delightful and healthy meals are also served to meet dietary needs and preferences. The community also ensures residents do not miss their medication and health appointments with medication management and transportation services. Spend the best of your later years, receiving the finest care and support like no other.
Apple Blossoms Assisted Living is an intimate community in Silver Spring, MD, designed to provide residents a safe and nurturing environment for assisted living. Their reliable team is always available on-site to help residents with their daily living activities while preserving their level of independence. There are cozy and spacious semi-private and private accommodations for residents to choose from, depending on their preferences and needs for guaranteed comfort and peace of mind.
The community also provides short-term stays for residents with caregivers looking to enjoy a much-deserved break from caregiving. Recreation for all levels of abilities and various interests is also available to ensure residents are able to maintain an active and socially engaged lifestyle. To help them maintain proper nutrition, their team also handles the meal preparation and serves fresh, healthy meals daily. Here, you can live your golden years with ease while being surrounded by genuine and compassionate care.
Montgomery Eldercare at Eastway Drive is an assisted living community Silver Spring, MD, offering personal care, hospice care, and respite care. With a nurturing and welcoming environment, the community ensures older adults can feel at home throughout their stay. Restaurant-style dining, daily housekeeping, laundry, and transportation are among the excellent services provided to enrich residents’ living experiences. The community also strives to get to know residents’ needs and habits to provide the best possible care, helping them maintain their independence.
Bingo, outings, and a dance club provide residents with more opportunities to create meaningful moments and live actively. A courtyaurd and cozy common areas also ensure residents’ peace of mind and safety. Situated in the quiet residential area of Silver Spring, near parks, shops, and restaurants, the community ensures residents have a stress-free retirement. This assisted living community is committed to helping older adults thrive in retirement, making it a trusted option for senior living in Maryland.
Spend your retirement without worries with Necitas Assisted Living, an exceptional residential senior living provider with 4 locations across Silver Spring, MD, that provides assisted living and personal care services. With a team of highly skilled and reliable professionals providing the highest quality care and support around the clock, seniors and their families can rest assured their every need and aspiration is well-cared for. The communities strive to understand each resident to ensure they are provided with the assistance that best matches them.
Play card games with fellow residents and join exercises to keep fit with a wide array of fun programs and enjoyable activities conducted for seniors’ enjoyment and wellness. With the mundane chores and household duties handled by Necitas Assisted Living, residents have more time to seek new interests and rediscover old hobbies. Enjoy delectable and nutritious meals that satisfy dietary needs and tastes. Live your best life enveloped by a warm and welcoming community and wonderful amenities in Necitas Assisted Living.
Sunny Side Manor Communities II is an assisted living community in Silver Spring, MD, offering personal care. With a comfortable, home-like setting, the community ensures older adults experience the utmost comfort and safety. Residents can also maintain their independence with exceptional services, including housekeeping, nutritious meals, and recreational activities. The community also works closely with residents to provide the best possible care for their unique needs and habits.
Games, social events, and fitness programs ensure residents can explore hobbies and have fun. Residents can also rest and move around comfortably in cozy communal areas and spacious rooms. With a seamless combination of urban convenience and suburban charm, residents have quick access to necessities and leisure. This assisted living community is a great choice for senior living in Maryland, especially with its commitment to helping older adults thrive in their later years.
Live blissfully at Evergreen Eldercare, an outstanding community in Silver Spring, MD, offering assisted living. Residents can ease their worries with a compassionate and well-trained team, providing exceptional care for their daily living activities 24/7. Featuring purposely built and secure accommodations, the community guarantees the utmost comfort and safety.
A variety of engaging activities and exciting events are conducted, encouraging residents to live actively and maintain social connections. Delicious and well-balanced meals are also served according to residents’ tastes and nutritional needs. The community is ideal for those seeking comfort in their golden years, especially with its top-notch services and beautifully maintained amenities.
Ranking Methodology
How we rank these communities
Every community above is evaluated across six weighted categories using public data including state inspection records, review platforms, BBB profiles, and operator-published materials.
Weighting overview
- 35%Resident Experience
- 25%Regulatory
- 15%Visual Media
- 10%Website
- 10%Stability
- 5%Environment
01
Resident & Family Experience 35%
The single largest share of every ranking. Aggregated review sentiment and volume from major platforms — the closest signal to real resident experience.
- Includes
- Review Sentiment
- Review Volume
02
Regulatory & Safety Record 25%
State inspection records, citations, and complaint visits. We weight per-inspection rates more heavily than raw counts.
- Includes
- State Inspections
- Citations/Inspection
- % Inspections w/ Citations
- Complaint Visits
- Accreditations
- BBB Rating
03
Visual Media & Transparency 15%
Communities that publish high-quality visuals give families a real preview. No photos or tours = a negative transparency signal.
- Includes
- Video Tours
- Virtual Walkthroughs
- Photo Quantity
- Photo Quality
04
Website & Operator Transparency 10%
Site quality and whether the operator publishes basic accountability information — staff names, contact details, ownership.
- Includes
- Website Content
- Mobile Usability
- Staff Info Available
- Owner Info Available
05
Community Stability 10%
Operational signals indicating whether a community is well-run and meeting demand.
- Includes
- Occupancy Rate
- Bed Options
06
Environment & Pricing 5%
Walkability and pricing transparency. Walk Score is weighted higher for Independent Living than for Memory Care, where most residents do not leave unaccompanied.
- Includes
- Walk Score
- Pricing Transparency
Who we are
Your Senior Care Partner, Every Step of the Way
We help families find affordable senior communities and unlock same day discounts, Medicaid, and Medicare options tailored to your needs.
Contact us Today
Frequently Asked Questions about Assisted Living in Silver Spring, MD
What is the average cost of assisted living in Silver Spring, MD?
The average monthly cost of assisted living in Silver Spring, MD is approximately $6,000. Actual rates vary by community, level of care, and floorplan.
What is the price range for assisted living in Silver Spring, MD?
Assisted living in Silver Spring, MD typically ranges from $5,500–$8,100 per month, depending on the community, room type, and care needs.
What is the typical staff-to-resident ratio at assisted living facilities in Silver Spring, MD?
Assisted living facilities in Silver Spring, MD typically operate with a staff-to-resident ratio in the range of 1:6 to 1:12.
What's the difference between assisted living and memory care in Maryland?
Assisted living in Maryland supports residents with daily activities (bathing, dressing, medication management) while preserving independence. Memory care is a specialized form of assisted living for residents living with Alzheimer's or dementia, and adds 24/7 secured environments, dementia-trained staff, and structured routines designed to reduce confusion and wandering.
What's the difference between assisted living and a nursing home in Maryland?
Assisted living in Maryland is a residential model focused on housing, hospitality, and help with daily activities. Nursing homes (skilled nursing facilities) provide 24/7 medical care from licensed nurses for residents with significant health needs, and are regulated more strictly under both state and federal CMS rules.
Does Maryland Medicaid cover assisted living?
Maryland Medicaid does not directly pay room-and-board for assisted living, but most states (including Maryland) offer Home and Community-Based Services (HCBS) waivers that can offset the cost of care services delivered inside a licensed community. Eligibility, waitlists, and covered services vary — check directly with the state Medicaid agency.
What is assisted living?
Assisted living combines private or semi-private apartments with help on activities of daily living (meals, bathing, dressing, medication management) and a social calendar — for residents who need some support but do not need 24/7 medical care.
Updated on
