


Compare Assisted Living around Silver Spring
Info below is compiled from the MD Dept. of Health (OHCQ), senior community websites & trusted data sources such as Walk Score & BBB.
Communities are listed from highest to lowest based on our ranking methodology.
| Bedford Court, a CCRC | AL HOS IL MC NH RC SNF | Silver Spring (International Drive) | 76
Facility
76
MD AVG
42
Rank
#174 / 685 | Yes |
64
Facility
64
MD AVG
43
Rank
#261 / 985 | Studio / 1 Bed | 34
Facility
34
MD AVG
21
Rank
#22 / 210 |
15% Male Residents — State Benchmarked 15% of residents are male, compared to the Maryland average of 31%. This facility caters to a majority female resident pool (85% female), consistent with the broader assisted living trend where women significantly outnumber men. |
85% Female Residents — State Benchmarked 85% of residents are female, compared to the Maryland average of 69%. Women comprise the large majority, consistent with national assisted living demographics where women live longer and enter care facilities at higher rates. |
95% White Residents — State Benchmarked 95% of residents are reported as White, compared to the Maryland average of 81%. A higher White share than is typical for assisted living in Maryland in this dataset — compare with peer facilities for local context. |
3% African American Residents — State Benchmarked 3% of residents are reported as African American or Black, compared to the Maryland average of 13%. A lower African American share than is typical in Maryland; local markets still vary widely. |
2% Other Ethnicity Residents — State Benchmarked 2% of residents fall into categories other than White or African American (combined), compared to the Maryland average of 6%. This column aggregates Hispanic, Asian, multiracial, and any other labeled groups that are not classified as White or African American. Reported subgroups in this total: Asian (2%). |
2% Residents Age 65–74 — State Benchmarked 2% of residents are 65–74, compared to the Maryland average of 13%. Fewer younger seniors suggests the resident population skews older, likely requiring higher acuity care and more hands-on support. |
8% Residents Age 75–84 — State Benchmarked 8% of residents are 75–84, compared to the Maryland average of 31%. Below the state norm — the resident mix may skew either younger or older than this typical middle bracket. |
65% Residents Age 85–94 — State Benchmarked 65% of residents are 85–94, compared to the Maryland average of 44%. A high concentration of very elderly residents signals a higher-acuity facility with experience caring for advanced age-related needs. |
26% Residents Age 95+ — State Benchmarked 26% of residents are 95 or older, compared to the Maryland average of 16%. A high proportion of the oldest-old suggests strong end-of-life care experience and very-high-acuity capabilities. |
| Bedford Court | AL HOS IL MC NH RC SNF | Silver Spring (International Drive) | 76
Facility
76
MD AVG
42
Rank
#174 / 685 | Yes |
66
Facility
66
MD AVG
43
Rank
#240 / 985 | Studio / 1 Bed / 2 Bed | 34
Facility
34
MD AVG
21
Rank
#22 / 210 |
15% Male Residents — State Benchmarked 15% of residents are male, compared to the Maryland average of 31%. This facility caters to a majority female resident pool (85% female), consistent with the broader assisted living trend where women significantly outnumber men. |
85% Female Residents — State Benchmarked 85% of residents are female, compared to the Maryland average of 69%. Women comprise the large majority, consistent with national assisted living demographics where women live longer and enter care facilities at higher rates. |
95% White Residents — State Benchmarked 95% of residents are reported as White, compared to the Maryland average of 81%. A higher White share than is typical for assisted living in Maryland in this dataset — compare with peer facilities for local context. |
3% African American Residents — State Benchmarked 3% of residents are reported as African American or Black, compared to the Maryland average of 13%. A lower African American share than is typical in Maryland; local markets still vary widely. |
2% Other Ethnicity Residents — State Benchmarked 2% of residents fall into categories other than White or African American (combined), compared to the Maryland average of 6%. This column aggregates Hispanic, Asian, multiracial, and any other labeled groups that are not classified as White or African American. Reported subgroups in this total: Asian (2%). |
2% Residents Age 65–74 — State Benchmarked 2% of residents are 65–74, compared to the Maryland average of 13%. Fewer younger seniors suggests the resident population skews older, likely requiring higher acuity care and more hands-on support. |
8% Residents Age 75–84 — State Benchmarked 8% of residents are 75–84, compared to the Maryland average of 31%. Below the state norm — the resident mix may skew either younger or older than this typical middle bracket. |
65% Residents Age 85–94 — State Benchmarked 65% of residents are 85–94, compared to the Maryland average of 44%. A high concentration of very elderly residents signals a higher-acuity facility with experience caring for advanced age-related needs. |
26% Residents Age 95+ — State Benchmarked 26% of residents are 95 or older, compared to the Maryland average of 16%. A high proportion of the oldest-old suggests strong end-of-life care experience and very-high-acuity capabilities. |
| Riderwood Village | AL IL MC | Silver Spring | 275
Facility
275
MD AVG
42
Rank
#3 / 685 | Yes |
33
Facility
33
MD AVG
43
Rank
#597 / 985 | - | 23
Facility
23
MD AVG
21
Rank
#101 / 210 |
29% Male Residents — State Benchmarked 29% of residents are male, compared to the Maryland average of 31%. This facility caters to a majority female resident pool (71% female), consistent with the broader assisted living trend where women significantly outnumber men. |
71% Female Residents — State Benchmarked 71% of residents are female, compared to the Maryland average of 69%. Women comprise the large majority, consistent with national assisted living demographics where women live longer and enter care facilities at higher rates. |
89% White Residents — State Benchmarked 89% of residents are reported as White, compared to the Maryland average of 81%. Close to the average for this category among assisted living facilities in Maryland with reported race/ethnicity data. |
7% African American Residents — State Benchmarked 7% of residents are reported as African American or Black, compared to the Maryland average of 13%. In line with the Maryland average for African American residents among facilities reporting this breakdown. |
4% Other Ethnicity Residents — State Benchmarked 4% of residents fall into categories other than White or African American (combined), compared to the Maryland average of 6%. This column aggregates Hispanic, Asian, multiracial, and any other labeled groups that are not classified as White or African American. Reported subgroups in this total: Asian (3%), Hispanic (0%). |
2% Residents Age 65–74 — State Benchmarked 2% of residents are 65–74, compared to the Maryland average of 13%. Fewer younger seniors suggests the resident population skews older, likely requiring higher acuity care and more hands-on support. |
23% Residents Age 75–84 — State Benchmarked 23% of residents are 75–84, compared to the Maryland average of 31%. Below the state norm — the resident mix may skew either younger or older than this typical middle bracket. |
52% Residents Age 85–94 — State Benchmarked 52% of residents are 85–94, compared to the Maryland average of 44%. A high concentration of very elderly residents signals a higher-acuity facility with experience caring for advanced age-related needs. |
23% Residents Age 95+ — State Benchmarked 23% of residents are 95 or older, compared to the Maryland average of 16%. A high proportion of the oldest-old suggests strong end-of-life care experience and very-high-acuity capabilities. |
| Sunrise of Chevy Chase | AL MC | Silver Spring (Rock Creek Gardens) | 196
Facility
196
MD AVG
42
Rank
#10 / 685 | No |
71
Facility
71
MD AVG
43
Rank
#175 / 985 | Studio / 1 Bed / 2 Bed | 8
Facility
8
MD AVG
21
Rank
#164 / 210 |
58% Male Residents — State Benchmarked 58% of residents are male, compared to the Maryland average of 31%. An unusually high male share for assisted living, where most facilities skew heavily female. |
42% Female Residents — State Benchmarked 42% of residents are female, compared to the Maryland average of 69%. An unusually low female share — most assisted living facilities have 65–75% female residents. |
69% White Residents — State Benchmarked 69% of residents are reported as White, compared to the Maryland average of 81%. A lower White share than the Maryland average — the community may draw a more diverse resident mix relative to other facilities in Maryland. |
28% African American Residents — State Benchmarked 28% of residents are reported as African American or Black, compared to the Maryland average of 13%. A higher African American share than the typical Maryland average — useful context when comparing cultural fit and community composition. |
3% Other Ethnicity Residents — State Benchmarked 3% of residents fall into categories other than White or African American (combined), compared to the Maryland average of 6%. This column aggregates Hispanic, Asian, multiracial, and any other labeled groups that are not classified as White or African American. Reported subgroups in this total: Hispanic (2%), Asian (1%). |
12% Residents Age 65–74 — State Benchmarked 12% of residents are 65–74, compared to the Maryland average of 13%. In line with the statewide profile for this youngest senior bracket in assisted living. |
39% Residents Age 75–84 — State Benchmarked 39% of residents are 75–84, compared to the Maryland average of 31%. A high concentration in this mid-range bracket, where residents typically need moderate support with daily activities. |
42% Residents Age 85–94 — State Benchmarked 42% of residents are 85–94, compared to the Maryland average of 44%. This is typically the most common age bracket in assisted living — this facility is in line with the statewide norm. |
6% Residents Age 95+ — State Benchmarked 6% of residents are 95 or older, compared to the Maryland average of 16%. Most residents here have not yet reached the oldest-old bracket, suggesting a younger overall community. |
| The Terraces at Westminster | AL MC RC | Westminster (Washington Heights) | 75
Facility
75
MD AVG
42
Rank
#176 / 685 | No |
76
Facility
76
MD AVG
43
Rank
#118 / 985 | - | 27
Facility
27
MD AVG
21
Rank
#62 / 210 |
22% Male Residents — State Benchmarked 22% of residents are male, compared to the Maryland average of 31%. This facility caters to a majority female resident pool (78% female), consistent with the broader assisted living trend where women significantly outnumber men. |
78% Female Residents — State Benchmarked 78% of residents are female, compared to the Maryland average of 69%. Women comprise the large majority, consistent with national assisted living demographics where women live longer and enter care facilities at higher rates. |
98% White Residents — State Benchmarked 98% of residents are reported as White, compared to the Maryland average of 81%. A higher White share than is typical for assisted living in Maryland in this dataset — compare with peer facilities for local context. |
2% African American Residents — State Benchmarked 2% of residents are reported as African American or Black, compared to the Maryland average of 13%. A lower African American share than is typical in Maryland; local markets still vary widely. |
0% Other Ethnicity Residents — State Benchmarked 0% of residents fall into categories other than White or African American (combined), compared to the Maryland average of 6%. This column aggregates Hispanic, Asian, multiracial, and any other labeled groups that are not classified as White or African American. |
22% Residents Age 65–74 — State Benchmarked 22% of residents are 65–74, compared to the Maryland average of 13%. A higher share of younger seniors often signals a more independent, active resident community with lower acuity care needs. |
46% Residents Age 75–84 — State Benchmarked 46% of residents are 75–84, compared to the Maryland average of 31%. A high concentration in this mid-range bracket, where residents typically need moderate support with daily activities. |
25% Residents Age 85–94 — State Benchmarked 25% of residents are 85–94, compared to the Maryland average of 44%. The population here skews younger than the statewide norm, which may indicate a more active, lower-acuity community. |
6% Residents Age 95+ — State Benchmarked 6% of residents are 95 or older, compared to the Maryland average of 16%. Most residents here have not yet reached the oldest-old bracket, suggesting a younger overall community. |
| Sunrise of Silver Spring | AL HOS MC RC | Silver Spring (New Hampshire Avenue) | 84
Facility
84
MD AVG
42
Rank
#160 / 685 | Yes |
40
Facility
40
MD AVG
43
Rank
#523 / 985 | Studio / 1 Bed / 2 Bed | 24
Facility
24
MD AVG
21
Rank
#93 / 210 |
31% Male Residents — State Benchmarked 31% of residents are male, compared to the Maryland average of 31%. This facility caters to a majority female resident pool (69% female), consistent with the broader assisted living trend where women significantly outnumber men. |
69% Female Residents — State Benchmarked 69% of residents are female, compared to the Maryland average of 69%. Women comprise the large majority, consistent with national assisted living demographics where women live longer and enter care facilities at higher rates. |
53% White Residents — State Benchmarked 53% of residents are reported as White, compared to the Maryland average of 81%. A lower White share than the Maryland average — the community may draw a more diverse resident mix relative to other facilities in Maryland. |
39% African American Residents — State Benchmarked 39% of residents are reported as African American or Black, compared to the Maryland average of 13%. A higher African American share than the typical Maryland average — useful context when comparing cultural fit and community composition. |
9% Other Ethnicity Residents — State Benchmarked 9% of residents fall into categories other than White or African American (combined), compared to the Maryland average of 6%. This column aggregates Hispanic, Asian, multiracial, and any other labeled groups that are not classified as White or African American. Reported subgroups in this total: Asian (4%), Hawaiian/Pacific Islander (3%), Hispanic (1%). |
4% Residents Age 65–74 — State Benchmarked 4% of residents are 65–74, compared to the Maryland average of 13%. Fewer younger seniors suggests the resident population skews older, likely requiring higher acuity care and more hands-on support. |
43% Residents Age 75–84 — State Benchmarked 43% of residents are 75–84, compared to the Maryland average of 31%. A high concentration in this mid-range bracket, where residents typically need moderate support with daily activities. |
37% Residents Age 85–94 — State Benchmarked 37% of residents are 85–94, compared to the Maryland average of 44%. The population here skews younger than the statewide norm, which may indicate a more active, lower-acuity community. |
14% Residents Age 95+ — State Benchmarked 14% of residents are 95 or older, compared to the Maryland average of 16%. In line with the statewide profile for the oldest resident bracket. |
| Seaton Silver Spring | AL IL | Silver Spring (Homecrest Road) | 55
Facility
55
MD AVG
42
Rank
#206 / 685 | Yes |
33
Facility
33
MD AVG
43
Rank
#597 / 985 | 1 Bed / 2 Bed | 36
Facility
36
MD AVG
21
Rank
#16 / 210 |
15% Male Residents — State Benchmarked 15% of residents are male, compared to the Maryland average of 31%. This facility caters to a majority female resident pool (85% female), consistent with the broader assisted living trend where women significantly outnumber men. |
85% Female Residents — State Benchmarked 85% of residents are female, compared to the Maryland average of 69%. Women comprise the large majority, consistent with national assisted living demographics where women live longer and enter care facilities at higher rates. |
79% White Residents — State Benchmarked 79% of residents are reported as White, compared to the Maryland average of 81%. Close to the average for this category among assisted living facilities in Maryland with reported race/ethnicity data. |
21% African American Residents — State Benchmarked 21% of residents are reported as African American or Black, compared to the Maryland average of 13%. A higher African American share than the typical Maryland average — useful context when comparing cultural fit and community composition. |
0% Other Ethnicity Residents — State Benchmarked 0% of residents fall into categories other than White or African American (combined), compared to the Maryland average of 6%. This column aggregates Hispanic, Asian, multiracial, and any other labeled groups that are not classified as White or African American. |
9% Residents Age 65–74 — State Benchmarked 9% of residents are 65–74, compared to the Maryland average of 13%. Fewer younger seniors suggests the resident population skews older, likely requiring higher acuity care and more hands-on support. |
21% Residents Age 75–84 — State Benchmarked 21% of residents are 75–84, compared to the Maryland average of 31%. Below the state norm — the resident mix may skew either younger or older than this typical middle bracket. |
38% Residents Age 85–94 — State Benchmarked 38% of residents are 85–94, compared to the Maryland average of 44%. The population here skews younger than the statewide norm, which may indicate a more active, lower-acuity community. |
32% Residents Age 95+ — State Benchmarked 32% of residents are 95 or older, compared to the Maryland average of 16%. A high proportion of the oldest-old suggests strong end-of-life care experience and very-high-acuity capabilities. |
| Brightview Crofton Riverwalk | AL IL MC | Crofton | 92
Facility
92
MD AVG
42
Rank
#146 / 685 | Yes |
45
Facility
45
MD AVG
43
Rank
#475 / 985 | Studio / 1 Bed / 2 Bed | 6
Facility
6
MD AVG
21
Rank
#178 / 210 |
27% Male Residents — State Benchmarked 27% of residents are male, compared to the Maryland average of 31%. This facility caters to a majority female resident pool (73% female), consistent with the broader assisted living trend where women significantly outnumber men. |
73% Female Residents — State Benchmarked 73% of residents are female, compared to the Maryland average of 69%. Women comprise the large majority, consistent with national assisted living demographics where women live longer and enter care facilities at higher rates. |
0% White Residents — State Benchmarked 0% of residents are reported as White, compared to the Maryland average of 81%. A lower White share than the Maryland average — the community may draw a more diverse resident mix relative to other facilities in Maryland. |
0% African American Residents — State Benchmarked 0% of residents are reported as African American or Black, compared to the Maryland average of 13%. A lower African American share than is typical in Maryland; local markets still vary widely. |
100% Other Ethnicity Residents — State Benchmarked 100% of residents fall into categories other than White or African American (combined), compared to the Maryland average of 6%. This column aggregates Hispanic, Asian, multiracial, and any other labeled groups that are not classified as White or African American. Reported subgroups in this total: Other (100%). | - | - | - | - |
| Grace House | AL HOS PC | Silver Spring | 32
Facility
32
MD AVG
42
Rank
#236 / 685 | No |
25
Facility
25
MD AVG
43
Rank
#684 / 985 | Studio / 1 Bed | 19
Facility
19
MD AVG
21
Rank
#117 / 210 |
29% Male Residents — State Benchmarked 29% of residents are male, compared to the Maryland average of 31%. This facility caters to a majority female resident pool (71% female), consistent with the broader assisted living trend where women significantly outnumber men. |
71% Female Residents — State Benchmarked 71% of residents are female, compared to the Maryland average of 69%. Women comprise the large majority, consistent with national assisted living demographics where women live longer and enter care facilities at higher rates. |
74% White Residents — State Benchmarked 74% of residents are reported as White, compared to the Maryland average of 81%. Close to the average for this category among assisted living facilities in Maryland with reported race/ethnicity data. |
23% African American Residents — State Benchmarked 23% of residents are reported as African American or Black, compared to the Maryland average of 13%. A higher African American share than the typical Maryland average — useful context when comparing cultural fit and community composition. |
3% Other Ethnicity Residents — State Benchmarked 3% of residents fall into categories other than White or African American (combined), compared to the Maryland average of 6%. This column aggregates Hispanic, Asian, multiracial, and any other labeled groups that are not classified as White or African American. Reported subgroups in this total: Hispanic (3%). |
6% Residents Age 65–74 — State Benchmarked 6% of residents are 65–74, compared to the Maryland average of 13%. Fewer younger seniors suggests the resident population skews older, likely requiring higher acuity care and more hands-on support. |
26% Residents Age 75–84 — State Benchmarked 26% of residents are 75–84, compared to the Maryland average of 31%. Below the state norm — the resident mix may skew either younger or older than this typical middle bracket. |
32% Residents Age 85–94 — State Benchmarked 32% of residents are 85–94, compared to the Maryland average of 44%. The population here skews younger than the statewide norm, which may indicate a more active, lower-acuity community. |
35% Residents Age 95+ — State Benchmarked 35% of residents are 95 or older, compared to the Maryland average of 16%. A high proportion of the oldest-old suggests strong end-of-life care experience and very-high-acuity capabilities. |
| Kensington Park | AL IL MC | Kensington (Littledale Road) | - | Yes |
49
Facility
49
MD AVG
43
Rank
#431 / 985 | Private Rooms / Semi-Private Rooms | - | - | - | - | - | - | - | - | - | - |
| Royals Assisted Living, LLC | AL | Silver Spring | - | No |
50
Facility
50
MD AVG
43
Rank
#419 / 985 | Private / Shared Rooms | - | - | - | - | - | - | - | - | - | - |
| Nu-Life Assisted Living at 13201 Partridge Dr. | AL HOS RESC RC | Silver Spring | - | No |
47
Facility
47
MD AVG
43
Rank
#459 / 985 | Private Rooms | - | - | - | - | - | - | - | - | - | - |
| Good Samaritan Assisted Living | AL HC HOS MC RC | Silver Spring (Sligo Woods) | - | No |
41
Facility
41
MD AVG
43
Rank
#508 / 985 | Private Rooms / Semi-Private Rooms | - | - | - | - | - | - | - | - | - | - |
| J’Rose Assisted Living | AL | Silver Spring (Franklin Knolls) | 8
Facility
8
MD AVG
42
Rank
#301 / 685 | No |
23
Facility
23
MD AVG
43
Rank
#704 / 985 | - | - | - | - | - | - | - | - | - | - | - |
| Victory Forest | AL IL | Silver Spring (Forest Glen) | - | Yes |
33
Facility
33
MD AVG
43
Rank
#597 / 985 | 1 Bed | - | - | - | - | - | - | - | - | - | - |
Rows per page:

View all Nearby Homes
Caring Well at Aquarius sits in Silver Spring, Maryland, and holds just five beds. That is small. The home is a single story, and every resident gets a private room, so the day-to-day feel is closer to a family house than a big campus. Getting around the area takes a car in most cases; the Walk Score here is 8, and the streets nearby are not built for walking to errands.
A nurse owns and runs the place, and RNs are on duty around the clock. Staff handle personal care, medical needs, and hospice care right on site. Physical, occupational, and speech therapy are also part of the routine. Residents who need diabetic care or help with incontinence get that support in-house too, so they are not sent elsewhere for basic medical needs.
Meals are cooked from scratch, and staff take care of the laundry and the cleaning. Residents can also get beauty services and rides when they need to leave the property. There is a regular mix of social time, group activities, and exercise sessions built into most days. Staff also manage medications and help residents through physical rehab work.
This is a home built for a small group, not a large one. A family weighing a big community against something quieter and more personal will find this leans hard toward the second option: five beds, a nurse close at hand, and daily life that runs on a small, steady rhythm.
Set in the peaceful neighborhood of New Hampshire Avenue, Silver Spring, MD is the extraordinary senior living community of Aspire Wellness Touch Care that offers assisted living, respite and long-term care, physical disability support, and dementia care. With its commitment to delivering top-tier care and support, the community ensures seniors’ needs and aspirations are well-cared for through personalized care plans. Aspire Wellness Touch Care promises individuals from all walks of life the finest experience within its cozy and welcoming spaces.
Learn something new and gain meaningful experiences with a knowledgeable and friendly team that accompanies seniors as they make the most out of their day. Mingle with friends and live happily with enjoyable events conducted all year round. Aspire Wellness Touch Care goes above and beyond in providing a safe place for seniors to spend a glorious retirement.
Conveniently located in the serene setting of Silver Spring, MD, Victorian Homes I is an idyllic haven that offers assisted living. Residents can keep their peace of mind and receive the highest quality of care tailored to their unique needs around the clock from a respectful and well-trained team. Cleaning, laundry, and other chores are also taken care of, striving to maintain residents’ independence without hassles.
Fun recreational activities and exciting events are conducted, encouraging older adults to interact with their surroundings and live actively. Delicious and healthy meals are also provided to meet dietary needs and preferences. Medication management is available to ensure residents take their prescriptions on time. With its comprehensive care and extensive amenities, residents can find the care they need to live a worry-free retirement.
Surrounded by convenient local amenities in the thriving Bethpage Lane, Silver Spring, MD, CareVilla Bethpage is a unique community that offers assisted living and memory care. Featuring five cozy and well-designed accommodations alongside top-notch care and assistance from a compassionate and well-trained team, residents’ comfort and convenience are guaranteed. The community also provides a 24/7 call bell system and handles the housekeeping and laundry for residents to enjoy a maintenance-free lifestyle.
Elevate your best years with a well-thought-of calendar of fun activities and engaging programs tailored to your leisure and wellness. Medication management, continence management, diagnosis management, and transfer assistance are also provided to meet residents’ healthcare needs. The community is ideal for those looking for additional support while retaining their independence in retirement with its dedicated care and quaint setting.
Enjoy a blissful retirement at Royal Residential Services, a blissful haven in Silver Spring, MD, offering assisted living. With its cozy and nurturing environment, the community strives to provide exceptional care tailored to residents’ unique needs around the clock. Residents can also keep their peace of mind, as housekeeping, laundry, and linens are taken care of.
Residents are encouraged to live actively and make new friends with a thoughtfully curated calendar of engaging activities and enriching programs. Mealtimes foster comfort and satisfy dietary needs with delicious and healthy dining options. Medication management is also available to ensure residents will not miss taking their medicine. The community is a good option for those needing assistance to live a blissful retirement, especially with its top-notch services and state-of-the-art amenities.
Spend your best years at Sylva Villas Assisted Living Facility, a blissful community located in the harmonious neighborhood of Silver Spring, MD, offering assisted living. A compassionate and highly trained team provides the highest quality of care tailored to residents’ unique needs 24/7. Purposely built and secure accommodations are also provided in a nurturing and friendly environment, ensuring residents can feel at ease during their stay.
Residents are encouraged to live actively and explore new hobbies with a well-thought-out slate of engaging activities and enriching programs. Delicious and healthy dining options are also served to satisfy residents’ nutritional needs and tastes. The community is a great option for those needing assistance to live comfortably in retirement, especially with its dedicated services and nurturing environment.
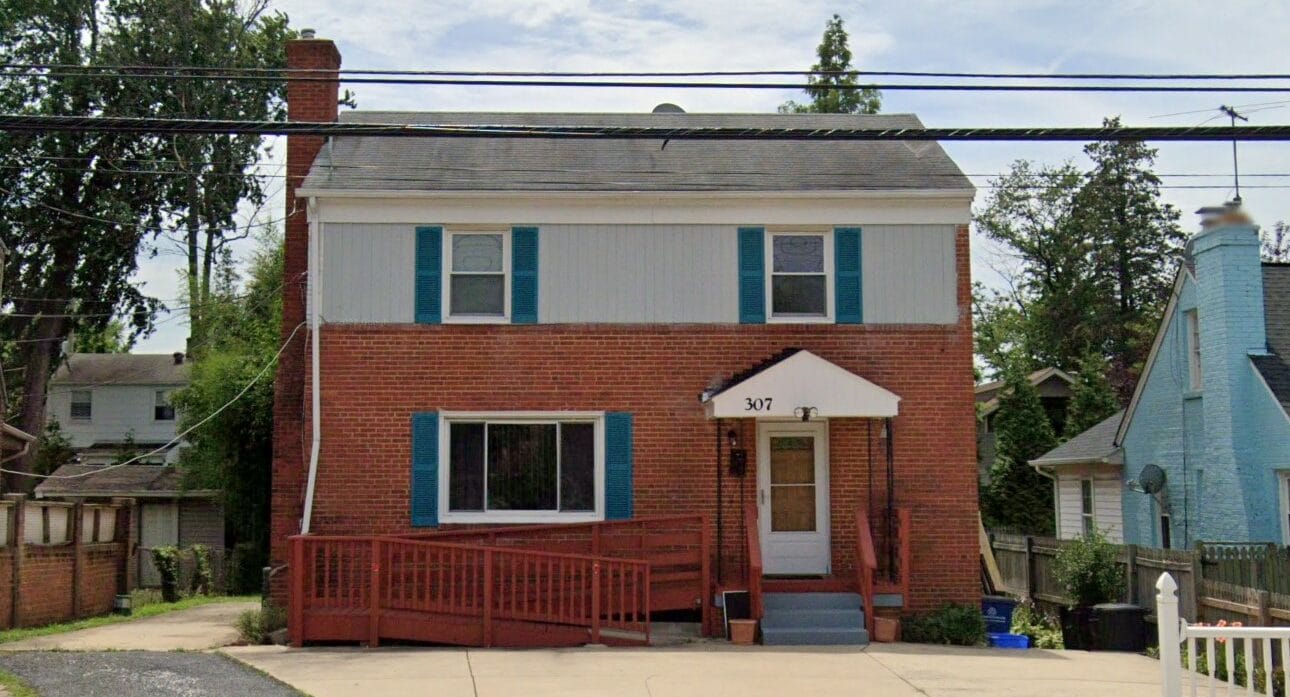
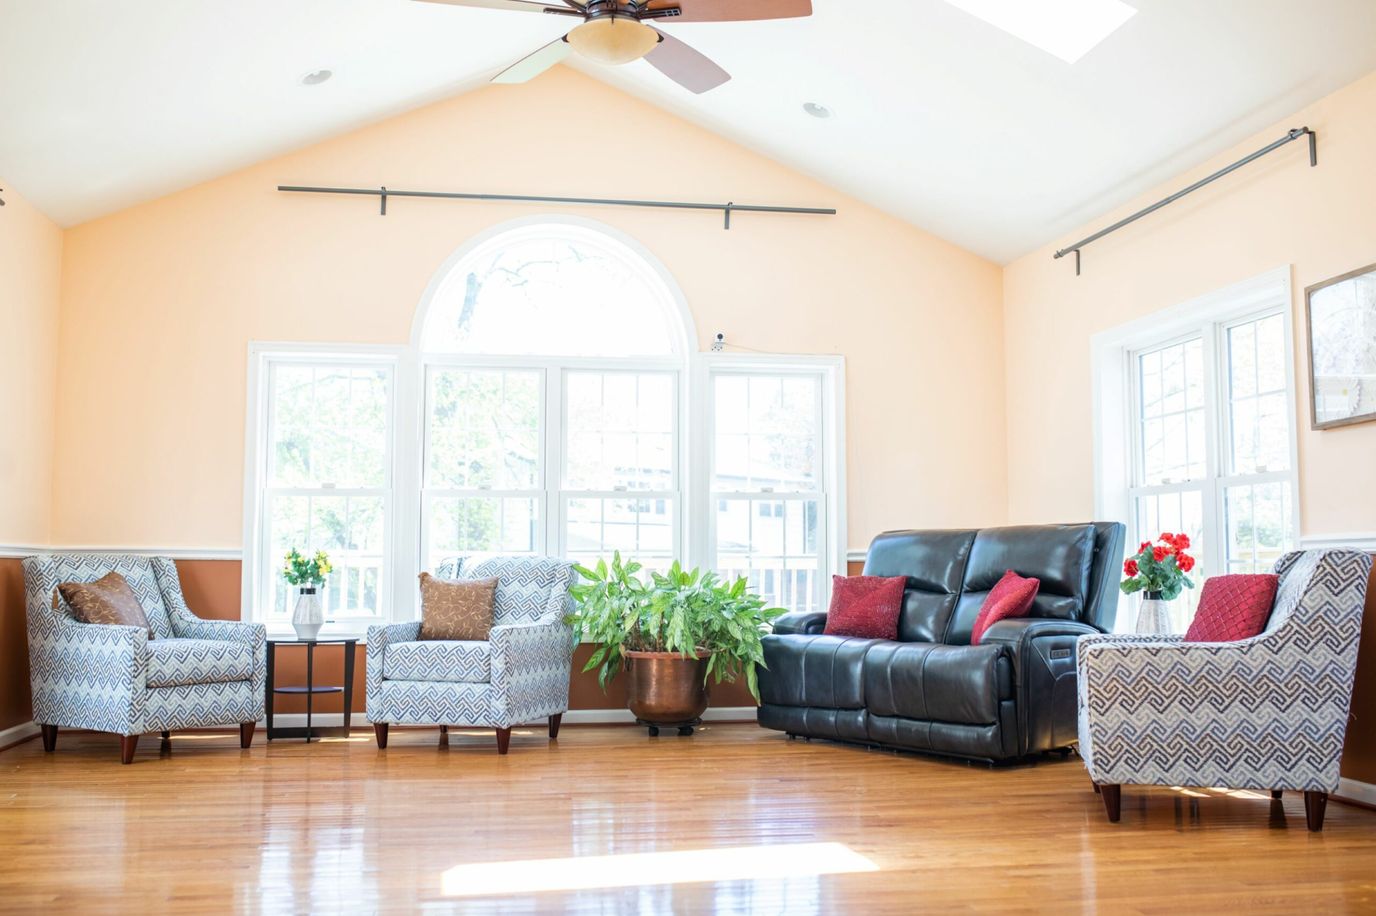
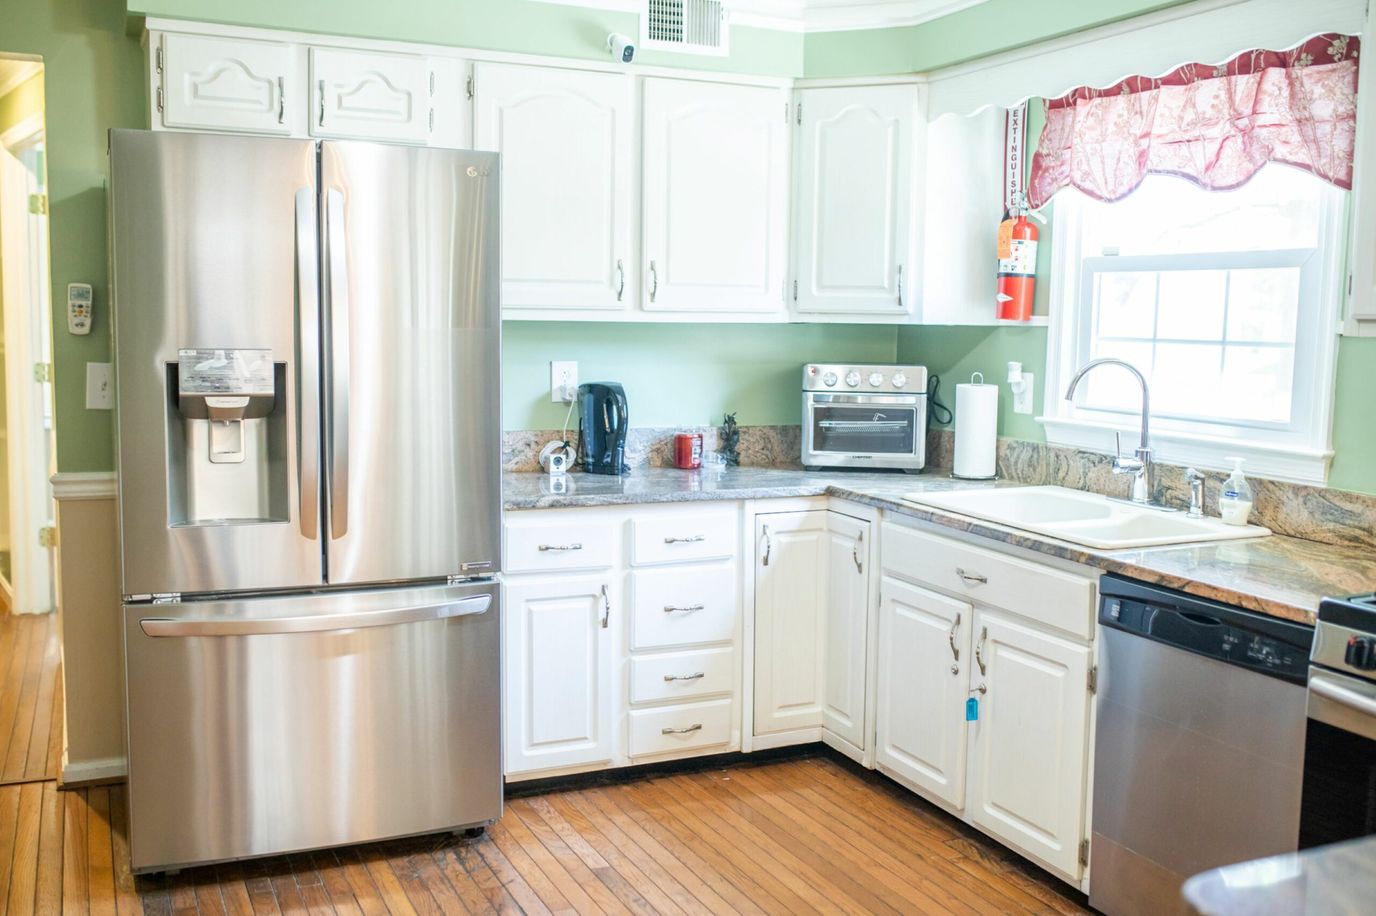
GoodHope Gp Assisted Living is a home healthcare provider in Silver Spring Maryland, offering in-home services and assistance with daily living activities. Committed to older adults’ comfort and welfare, the agency strives to maintain accessibility and convenience. With medication administration, transportaion, and healthcare coordination, older adults experience a maintenance-free lifestyle. The agency also strives to provide the best possible care for older adults’ indepdence through individualized care plans.
Activities and light exercises provide residents with more opportunities to explore hobbies and stay active. For older adults’ safety, the agency ensures their living spaces are clean and well-maintained. Set in Winchester, the agency ensures older adults receive the right care for their unique needs. This home care provider is a good choice for senior care in Maryland, especially with its comprehensive care options.
Conveniently set along University Boulevard East, Silver Spring, MD, Jeya’s Assisted Living is an outstanding community that offers assisted living. With its quaint and welcoming setting, the community strives to accommodate up to eight residents and provide them with the highest quality of care and assistance for the utmost comfort and convenience they deserve. Incontinence care and non-ambulatory care is also offered for residents’ non-medical needs.
Encouraging residents to remain socially engaged and activities, stimulating programs and enriching activities are conducted tailored to their leisure and wellness. Here, residents have hassle-free dining with delightful and healthy meals catering to their dietary needs. Transportation services are also provided whenever needed. Spend your golden years experiencing the highest quality of life with the community’s top-notch services and cozy amenities.
Overview of Nu-Life Assisted Living at 12502 Davan Drive


Dedicated to delivering exceptional care with a personal touch to the community of Silver Spring, MD, Nu-Life Assisted Living in Davan Drive is an inviting senior living community that offers comprehensive assisted living services. Here, residents are guaranteed to receive the care that works best for them with evidence-based care plans tailored to their very needs and care goals. A devoted team of caregivers work hard in delivering excellent care and supportive services, such as assistance with daily living activities, therapy services, medication assistance, and other specialized services.
A vibrant living experience is just right outside the doorstep, with a broad range of recreational and cultural programs held by the community, keeping residents engaged, stimulated, and active. The community’s prime location also offers easy access to various attractions, transportation, shopping, and other entertainment and leisure spots for a more fulfilling living experience. Here, the community handles most of the mundane tasks, so residents can freely enjoy their retirement life.
Live without worries in retirement at La Familia Assisted Living Inc III, an idyllic community in Silver Springs, MD, offering assisted living. A kind and highly trained team provides exceptional care tailored to their unique needs around the clock. Purposely built and secure accommodations are also provided, ensuring residents are comfortable and safe.
Residents will not run out of things to do for leisure and wellness with a jam-packed calendar of engaging activities and enriching programs. Mealtimes also foster comfort with delicious and well-balanced dining options that cater to their dietary needs and preferences. The community is ideal for those needing assistance to live comfortably in their golden years, especially with its supportive and welcoming environment.
Ranking Methodology
How we rank these communities
Every community above is evaluated across six weighted categories using public data including state inspection records, review platforms, BBB profiles, and operator-published materials.
Weighting overview
- 35%Resident Experience
- 25%Regulatory
- 15%Visual Media
- 10%Website
- 10%Stability
- 5%Environment
01
Resident & Family Experience 35%
The single largest share of every ranking. Aggregated review sentiment and volume from major platforms — the closest signal to real resident experience.
- Includes
- Review Sentiment
- Review Volume
02
Regulatory & Safety Record 25%
State inspection records, citations, and complaint visits. We weight per-inspection rates more heavily than raw counts.
- Includes
- State Inspections
- Citations/Inspection
- % Inspections w/ Citations
- Complaint Visits
- Accreditations
- BBB Rating
03
Visual Media & Transparency 15%
Communities that publish high-quality visuals give families a real preview. No photos or tours = a negative transparency signal.
- Includes
- Video Tours
- Virtual Walkthroughs
- Photo Quantity
- Photo Quality
04
Website & Operator Transparency 10%
Site quality and whether the operator publishes basic accountability information — staff names, contact details, ownership.
- Includes
- Website Content
- Mobile Usability
- Staff Info Available
- Owner Info Available
05
Community Stability 10%
Operational signals indicating whether a community is well-run and meeting demand.
- Includes
- Occupancy Rate
- Bed Options
06
Environment & Pricing 5%
Walkability and pricing transparency. Walk Score is weighted higher for Independent Living than for Memory Care, where most residents do not leave unaccompanied.
- Includes
- Walk Score
- Pricing Transparency
Who we are
Your Senior Care Partner, Every Step of the Way
We help families find affordable senior communities and unlock same day discounts, Medicaid, and Medicare options tailored to your needs.
Contact us Today
Frequently Asked Questions about Assisted Living in Silver Spring, MD
What is the average cost of assisted living in Silver Spring, MD?
The average monthly cost of assisted living in Silver Spring, MD is approximately $6,000. Actual rates vary by community, level of care, and floorplan.
What is the price range for assisted living in Silver Spring, MD?
Assisted living in Silver Spring, MD typically ranges from $5,500–$8,100 per month, depending on the community, room type, and care needs.
What is the typical staff-to-resident ratio at assisted living facilities in Silver Spring, MD?
Assisted living facilities in Silver Spring, MD typically operate with a staff-to-resident ratio in the range of 1:6 to 1:12.
What's the difference between assisted living and memory care in Maryland?
Assisted living in Maryland supports residents with daily activities (bathing, dressing, medication management) while preserving independence. Memory care is a specialized form of assisted living for residents living with Alzheimer's or dementia, and adds 24/7 secured environments, dementia-trained staff, and structured routines designed to reduce confusion and wandering.
What's the difference between assisted living and a nursing home in Maryland?
Assisted living in Maryland is a residential model focused on housing, hospitality, and help with daily activities. Nursing homes (skilled nursing facilities) provide 24/7 medical care from licensed nurses for residents with significant health needs, and are regulated more strictly under both state and federal CMS rules.
Does Maryland Medicaid cover assisted living?
Maryland Medicaid does not directly pay room-and-board for assisted living, but most states (including Maryland) offer Home and Community-Based Services (HCBS) waivers that can offset the cost of care services delivered inside a licensed community. Eligibility, waitlists, and covered services vary — check directly with the state Medicaid agency.
What is assisted living?
Assisted living combines private or semi-private apartments with help on activities of daily living (meals, bathing, dressing, medication management) and a social calendar — for residents who need some support but do not need 24/7 medical care.
Updated on
