


Compare Assisted Living around Silver Spring
Info below is compiled from the MD Dept. of Health (OHCQ), senior community websites & trusted data sources such as Walk Score & BBB.
Communities are listed from highest to lowest based on our ranking methodology.
| Bedford Court, a CCRC | AL HOS IL MC NH RC SNF | Silver Spring (International Drive) | 76
Facility
76
MD AVG
42
Rank
#174 / 685 | Yes |
64
Facility
64
MD AVG
43
Rank
#261 / 985 | Studio / 1 Bed | 34
Facility
34
MD AVG
21
Rank
#22 / 210 |
15% Male Residents — State Benchmarked 15% of residents are male, compared to the Maryland average of 31%. This facility caters to a majority female resident pool (85% female), consistent with the broader assisted living trend where women significantly outnumber men. |
85% Female Residents — State Benchmarked 85% of residents are female, compared to the Maryland average of 69%. Women comprise the large majority, consistent with national assisted living demographics where women live longer and enter care facilities at higher rates. |
95% White Residents — State Benchmarked 95% of residents are reported as White, compared to the Maryland average of 81%. A higher White share than is typical for assisted living in Maryland in this dataset — compare with peer facilities for local context. |
3% African American Residents — State Benchmarked 3% of residents are reported as African American or Black, compared to the Maryland average of 13%. A lower African American share than is typical in Maryland; local markets still vary widely. |
2% Other Ethnicity Residents — State Benchmarked 2% of residents fall into categories other than White or African American (combined), compared to the Maryland average of 6%. This column aggregates Hispanic, Asian, multiracial, and any other labeled groups that are not classified as White or African American. Reported subgroups in this total: Asian (2%). |
2% Residents Age 65–74 — State Benchmarked 2% of residents are 65–74, compared to the Maryland average of 13%. Fewer younger seniors suggests the resident population skews older, likely requiring higher acuity care and more hands-on support. |
8% Residents Age 75–84 — State Benchmarked 8% of residents are 75–84, compared to the Maryland average of 31%. Below the state norm — the resident mix may skew either younger or older than this typical middle bracket. |
65% Residents Age 85–94 — State Benchmarked 65% of residents are 85–94, compared to the Maryland average of 44%. A high concentration of very elderly residents signals a higher-acuity facility with experience caring for advanced age-related needs. |
26% Residents Age 95+ — State Benchmarked 26% of residents are 95 or older, compared to the Maryland average of 16%. A high proportion of the oldest-old suggests strong end-of-life care experience and very-high-acuity capabilities. |
| Bedford Court | AL HOS IL MC NH RC SNF | Silver Spring (International Drive) | 76
Facility
76
MD AVG
42
Rank
#174 / 685 | Yes |
66
Facility
66
MD AVG
43
Rank
#240 / 985 | Studio / 1 Bed / 2 Bed | 34
Facility
34
MD AVG
21
Rank
#22 / 210 |
15% Male Residents — State Benchmarked 15% of residents are male, compared to the Maryland average of 31%. This facility caters to a majority female resident pool (85% female), consistent with the broader assisted living trend where women significantly outnumber men. |
85% Female Residents — State Benchmarked 85% of residents are female, compared to the Maryland average of 69%. Women comprise the large majority, consistent with national assisted living demographics where women live longer and enter care facilities at higher rates. |
95% White Residents — State Benchmarked 95% of residents are reported as White, compared to the Maryland average of 81%. A higher White share than is typical for assisted living in Maryland in this dataset — compare with peer facilities for local context. |
3% African American Residents — State Benchmarked 3% of residents are reported as African American or Black, compared to the Maryland average of 13%. A lower African American share than is typical in Maryland; local markets still vary widely. |
2% Other Ethnicity Residents — State Benchmarked 2% of residents fall into categories other than White or African American (combined), compared to the Maryland average of 6%. This column aggregates Hispanic, Asian, multiracial, and any other labeled groups that are not classified as White or African American. Reported subgroups in this total: Asian (2%). |
2% Residents Age 65–74 — State Benchmarked 2% of residents are 65–74, compared to the Maryland average of 13%. Fewer younger seniors suggests the resident population skews older, likely requiring higher acuity care and more hands-on support. |
8% Residents Age 75–84 — State Benchmarked 8% of residents are 75–84, compared to the Maryland average of 31%. Below the state norm — the resident mix may skew either younger or older than this typical middle bracket. |
65% Residents Age 85–94 — State Benchmarked 65% of residents are 85–94, compared to the Maryland average of 44%. A high concentration of very elderly residents signals a higher-acuity facility with experience caring for advanced age-related needs. |
26% Residents Age 95+ — State Benchmarked 26% of residents are 95 or older, compared to the Maryland average of 16%. A high proportion of the oldest-old suggests strong end-of-life care experience and very-high-acuity capabilities. |
| Riderwood Village | AL IL MC | Silver Spring | 275
Facility
275
MD AVG
42
Rank
#3 / 685 | Yes |
33
Facility
33
MD AVG
43
Rank
#597 / 985 | - | 23
Facility
23
MD AVG
21
Rank
#101 / 210 |
29% Male Residents — State Benchmarked 29% of residents are male, compared to the Maryland average of 31%. This facility caters to a majority female resident pool (71% female), consistent with the broader assisted living trend where women significantly outnumber men. |
71% Female Residents — State Benchmarked 71% of residents are female, compared to the Maryland average of 69%. Women comprise the large majority, consistent with national assisted living demographics where women live longer and enter care facilities at higher rates. |
89% White Residents — State Benchmarked 89% of residents are reported as White, compared to the Maryland average of 81%. Close to the average for this category among assisted living facilities in Maryland with reported race/ethnicity data. |
7% African American Residents — State Benchmarked 7% of residents are reported as African American or Black, compared to the Maryland average of 13%. In line with the Maryland average for African American residents among facilities reporting this breakdown. |
4% Other Ethnicity Residents — State Benchmarked 4% of residents fall into categories other than White or African American (combined), compared to the Maryland average of 6%. This column aggregates Hispanic, Asian, multiracial, and any other labeled groups that are not classified as White or African American. Reported subgroups in this total: Asian (3%), Hispanic (0%). |
2% Residents Age 65–74 — State Benchmarked 2% of residents are 65–74, compared to the Maryland average of 13%. Fewer younger seniors suggests the resident population skews older, likely requiring higher acuity care and more hands-on support. |
23% Residents Age 75–84 — State Benchmarked 23% of residents are 75–84, compared to the Maryland average of 31%. Below the state norm — the resident mix may skew either younger or older than this typical middle bracket. |
52% Residents Age 85–94 — State Benchmarked 52% of residents are 85–94, compared to the Maryland average of 44%. A high concentration of very elderly residents signals a higher-acuity facility with experience caring for advanced age-related needs. |
23% Residents Age 95+ — State Benchmarked 23% of residents are 95 or older, compared to the Maryland average of 16%. A high proportion of the oldest-old suggests strong end-of-life care experience and very-high-acuity capabilities. |
| Sunrise of Chevy Chase | AL MC | Silver Spring (Rock Creek Gardens) | 196
Facility
196
MD AVG
42
Rank
#10 / 685 | No |
71
Facility
71
MD AVG
43
Rank
#175 / 985 | Studio / 1 Bed / 2 Bed | 8
Facility
8
MD AVG
21
Rank
#164 / 210 |
58% Male Residents — State Benchmarked 58% of residents are male, compared to the Maryland average of 31%. An unusually high male share for assisted living, where most facilities skew heavily female. |
42% Female Residents — State Benchmarked 42% of residents are female, compared to the Maryland average of 69%. An unusually low female share — most assisted living facilities have 65–75% female residents. |
69% White Residents — State Benchmarked 69% of residents are reported as White, compared to the Maryland average of 81%. A lower White share than the Maryland average — the community may draw a more diverse resident mix relative to other facilities in Maryland. |
28% African American Residents — State Benchmarked 28% of residents are reported as African American or Black, compared to the Maryland average of 13%. A higher African American share than the typical Maryland average — useful context when comparing cultural fit and community composition. |
3% Other Ethnicity Residents — State Benchmarked 3% of residents fall into categories other than White or African American (combined), compared to the Maryland average of 6%. This column aggregates Hispanic, Asian, multiracial, and any other labeled groups that are not classified as White or African American. Reported subgroups in this total: Hispanic (2%), Asian (1%). |
12% Residents Age 65–74 — State Benchmarked 12% of residents are 65–74, compared to the Maryland average of 13%. In line with the statewide profile for this youngest senior bracket in assisted living. |
39% Residents Age 75–84 — State Benchmarked 39% of residents are 75–84, compared to the Maryland average of 31%. A high concentration in this mid-range bracket, where residents typically need moderate support with daily activities. |
42% Residents Age 85–94 — State Benchmarked 42% of residents are 85–94, compared to the Maryland average of 44%. This is typically the most common age bracket in assisted living — this facility is in line with the statewide norm. |
6% Residents Age 95+ — State Benchmarked 6% of residents are 95 or older, compared to the Maryland average of 16%. Most residents here have not yet reached the oldest-old bracket, suggesting a younger overall community. |
| The Terraces at Westminster | AL MC RC | Westminster (Washington Heights) | 75
Facility
75
MD AVG
42
Rank
#176 / 685 | No |
76
Facility
76
MD AVG
43
Rank
#118 / 985 | - | 27
Facility
27
MD AVG
21
Rank
#62 / 210 |
22% Male Residents — State Benchmarked 22% of residents are male, compared to the Maryland average of 31%. This facility caters to a majority female resident pool (78% female), consistent with the broader assisted living trend where women significantly outnumber men. |
78% Female Residents — State Benchmarked 78% of residents are female, compared to the Maryland average of 69%. Women comprise the large majority, consistent with national assisted living demographics where women live longer and enter care facilities at higher rates. |
98% White Residents — State Benchmarked 98% of residents are reported as White, compared to the Maryland average of 81%. A higher White share than is typical for assisted living in Maryland in this dataset — compare with peer facilities for local context. |
2% African American Residents — State Benchmarked 2% of residents are reported as African American or Black, compared to the Maryland average of 13%. A lower African American share than is typical in Maryland; local markets still vary widely. |
0% Other Ethnicity Residents — State Benchmarked 0% of residents fall into categories other than White or African American (combined), compared to the Maryland average of 6%. This column aggregates Hispanic, Asian, multiracial, and any other labeled groups that are not classified as White or African American. |
22% Residents Age 65–74 — State Benchmarked 22% of residents are 65–74, compared to the Maryland average of 13%. A higher share of younger seniors often signals a more independent, active resident community with lower acuity care needs. |
46% Residents Age 75–84 — State Benchmarked 46% of residents are 75–84, compared to the Maryland average of 31%. A high concentration in this mid-range bracket, where residents typically need moderate support with daily activities. |
25% Residents Age 85–94 — State Benchmarked 25% of residents are 85–94, compared to the Maryland average of 44%. The population here skews younger than the statewide norm, which may indicate a more active, lower-acuity community. |
6% Residents Age 95+ — State Benchmarked 6% of residents are 95 or older, compared to the Maryland average of 16%. Most residents here have not yet reached the oldest-old bracket, suggesting a younger overall community. |
| Sunrise of Silver Spring | AL HOS MC RC | Silver Spring (New Hampshire Avenue) | 84
Facility
84
MD AVG
42
Rank
#160 / 685 | Yes |
40
Facility
40
MD AVG
43
Rank
#523 / 985 | Studio / 1 Bed / 2 Bed | 24
Facility
24
MD AVG
21
Rank
#93 / 210 |
31% Male Residents — State Benchmarked 31% of residents are male, compared to the Maryland average of 31%. This facility caters to a majority female resident pool (69% female), consistent with the broader assisted living trend where women significantly outnumber men. |
69% Female Residents — State Benchmarked 69% of residents are female, compared to the Maryland average of 69%. Women comprise the large majority, consistent with national assisted living demographics where women live longer and enter care facilities at higher rates. |
53% White Residents — State Benchmarked 53% of residents are reported as White, compared to the Maryland average of 81%. A lower White share than the Maryland average — the community may draw a more diverse resident mix relative to other facilities in Maryland. |
39% African American Residents — State Benchmarked 39% of residents are reported as African American or Black, compared to the Maryland average of 13%. A higher African American share than the typical Maryland average — useful context when comparing cultural fit and community composition. |
9% Other Ethnicity Residents — State Benchmarked 9% of residents fall into categories other than White or African American (combined), compared to the Maryland average of 6%. This column aggregates Hispanic, Asian, multiracial, and any other labeled groups that are not classified as White or African American. Reported subgroups in this total: Asian (4%), Hawaiian/Pacific Islander (3%), Hispanic (1%). |
4% Residents Age 65–74 — State Benchmarked 4% of residents are 65–74, compared to the Maryland average of 13%. Fewer younger seniors suggests the resident population skews older, likely requiring higher acuity care and more hands-on support. |
43% Residents Age 75–84 — State Benchmarked 43% of residents are 75–84, compared to the Maryland average of 31%. A high concentration in this mid-range bracket, where residents typically need moderate support with daily activities. |
37% Residents Age 85–94 — State Benchmarked 37% of residents are 85–94, compared to the Maryland average of 44%. The population here skews younger than the statewide norm, which may indicate a more active, lower-acuity community. |
14% Residents Age 95+ — State Benchmarked 14% of residents are 95 or older, compared to the Maryland average of 16%. In line with the statewide profile for the oldest resident bracket. |
| Seaton Silver Spring | AL IL | Silver Spring (Homecrest Road) | 55
Facility
55
MD AVG
42
Rank
#206 / 685 | Yes |
33
Facility
33
MD AVG
43
Rank
#597 / 985 | 1 Bed / 2 Bed | 36
Facility
36
MD AVG
21
Rank
#16 / 210 |
15% Male Residents — State Benchmarked 15% of residents are male, compared to the Maryland average of 31%. This facility caters to a majority female resident pool (85% female), consistent with the broader assisted living trend where women significantly outnumber men. |
85% Female Residents — State Benchmarked 85% of residents are female, compared to the Maryland average of 69%. Women comprise the large majority, consistent with national assisted living demographics where women live longer and enter care facilities at higher rates. |
79% White Residents — State Benchmarked 79% of residents are reported as White, compared to the Maryland average of 81%. Close to the average for this category among assisted living facilities in Maryland with reported race/ethnicity data. |
21% African American Residents — State Benchmarked 21% of residents are reported as African American or Black, compared to the Maryland average of 13%. A higher African American share than the typical Maryland average — useful context when comparing cultural fit and community composition. |
0% Other Ethnicity Residents — State Benchmarked 0% of residents fall into categories other than White or African American (combined), compared to the Maryland average of 6%. This column aggregates Hispanic, Asian, multiracial, and any other labeled groups that are not classified as White or African American. |
9% Residents Age 65–74 — State Benchmarked 9% of residents are 65–74, compared to the Maryland average of 13%. Fewer younger seniors suggests the resident population skews older, likely requiring higher acuity care and more hands-on support. |
21% Residents Age 75–84 — State Benchmarked 21% of residents are 75–84, compared to the Maryland average of 31%. Below the state norm — the resident mix may skew either younger or older than this typical middle bracket. |
38% Residents Age 85–94 — State Benchmarked 38% of residents are 85–94, compared to the Maryland average of 44%. The population here skews younger than the statewide norm, which may indicate a more active, lower-acuity community. |
32% Residents Age 95+ — State Benchmarked 32% of residents are 95 or older, compared to the Maryland average of 16%. A high proportion of the oldest-old suggests strong end-of-life care experience and very-high-acuity capabilities. |
| Brightview Crofton Riverwalk | AL IL MC | Crofton | 92
Facility
92
MD AVG
42
Rank
#146 / 685 | Yes |
45
Facility
45
MD AVG
43
Rank
#475 / 985 | Studio / 1 Bed / 2 Bed | 6
Facility
6
MD AVG
21
Rank
#178 / 210 |
27% Male Residents — State Benchmarked 27% of residents are male, compared to the Maryland average of 31%. This facility caters to a majority female resident pool (73% female), consistent with the broader assisted living trend where women significantly outnumber men. |
73% Female Residents — State Benchmarked 73% of residents are female, compared to the Maryland average of 69%. Women comprise the large majority, consistent with national assisted living demographics where women live longer and enter care facilities at higher rates. |
0% White Residents — State Benchmarked 0% of residents are reported as White, compared to the Maryland average of 81%. A lower White share than the Maryland average — the community may draw a more diverse resident mix relative to other facilities in Maryland. |
0% African American Residents — State Benchmarked 0% of residents are reported as African American or Black, compared to the Maryland average of 13%. A lower African American share than is typical in Maryland; local markets still vary widely. |
100% Other Ethnicity Residents — State Benchmarked 100% of residents fall into categories other than White or African American (combined), compared to the Maryland average of 6%. This column aggregates Hispanic, Asian, multiracial, and any other labeled groups that are not classified as White or African American. Reported subgroups in this total: Other (100%). | - | - | - | - |
| Grace House | AL HOS PC | Silver Spring | 32
Facility
32
MD AVG
42
Rank
#236 / 685 | No |
25
Facility
25
MD AVG
43
Rank
#684 / 985 | Studio / 1 Bed | 19
Facility
19
MD AVG
21
Rank
#117 / 210 |
29% Male Residents — State Benchmarked 29% of residents are male, compared to the Maryland average of 31%. This facility caters to a majority female resident pool (71% female), consistent with the broader assisted living trend where women significantly outnumber men. |
71% Female Residents — State Benchmarked 71% of residents are female, compared to the Maryland average of 69%. Women comprise the large majority, consistent with national assisted living demographics where women live longer and enter care facilities at higher rates. |
74% White Residents — State Benchmarked 74% of residents are reported as White, compared to the Maryland average of 81%. Close to the average for this category among assisted living facilities in Maryland with reported race/ethnicity data. |
23% African American Residents — State Benchmarked 23% of residents are reported as African American or Black, compared to the Maryland average of 13%. A higher African American share than the typical Maryland average — useful context when comparing cultural fit and community composition. |
3% Other Ethnicity Residents — State Benchmarked 3% of residents fall into categories other than White or African American (combined), compared to the Maryland average of 6%. This column aggregates Hispanic, Asian, multiracial, and any other labeled groups that are not classified as White or African American. Reported subgroups in this total: Hispanic (3%). |
6% Residents Age 65–74 — State Benchmarked 6% of residents are 65–74, compared to the Maryland average of 13%. Fewer younger seniors suggests the resident population skews older, likely requiring higher acuity care and more hands-on support. |
26% Residents Age 75–84 — State Benchmarked 26% of residents are 75–84, compared to the Maryland average of 31%. Below the state norm — the resident mix may skew either younger or older than this typical middle bracket. |
32% Residents Age 85–94 — State Benchmarked 32% of residents are 85–94, compared to the Maryland average of 44%. The population here skews younger than the statewide norm, which may indicate a more active, lower-acuity community. |
35% Residents Age 95+ — State Benchmarked 35% of residents are 95 or older, compared to the Maryland average of 16%. A high proportion of the oldest-old suggests strong end-of-life care experience and very-high-acuity capabilities. |
| Kensington Park | AL IL MC | Kensington (Littledale Road) | - | Yes |
49
Facility
49
MD AVG
43
Rank
#431 / 985 | Private Rooms / Semi-Private Rooms | - | - | - | - | - | - | - | - | - | - |
| Royals Assisted Living, LLC | AL | Silver Spring | - | No |
50
Facility
50
MD AVG
43
Rank
#419 / 985 | Private / Shared Rooms | - | - | - | - | - | - | - | - | - | - |
| Nu-Life Assisted Living at 13201 Partridge Dr. | AL HOS RESC RC | Silver Spring | - | No |
47
Facility
47
MD AVG
43
Rank
#459 / 985 | Private Rooms | - | - | - | - | - | - | - | - | - | - |
| Good Samaritan Assisted Living | AL HC HOS MC RC | Silver Spring (Sligo Woods) | - | No |
41
Facility
41
MD AVG
43
Rank
#508 / 985 | Private Rooms / Semi-Private Rooms | - | - | - | - | - | - | - | - | - | - |
| J’Rose Assisted Living | AL | Silver Spring (Franklin Knolls) | 8
Facility
8
MD AVG
42
Rank
#301 / 685 | No |
23
Facility
23
MD AVG
43
Rank
#704 / 985 | - | - | - | - | - | - | - | - | - | - | - |
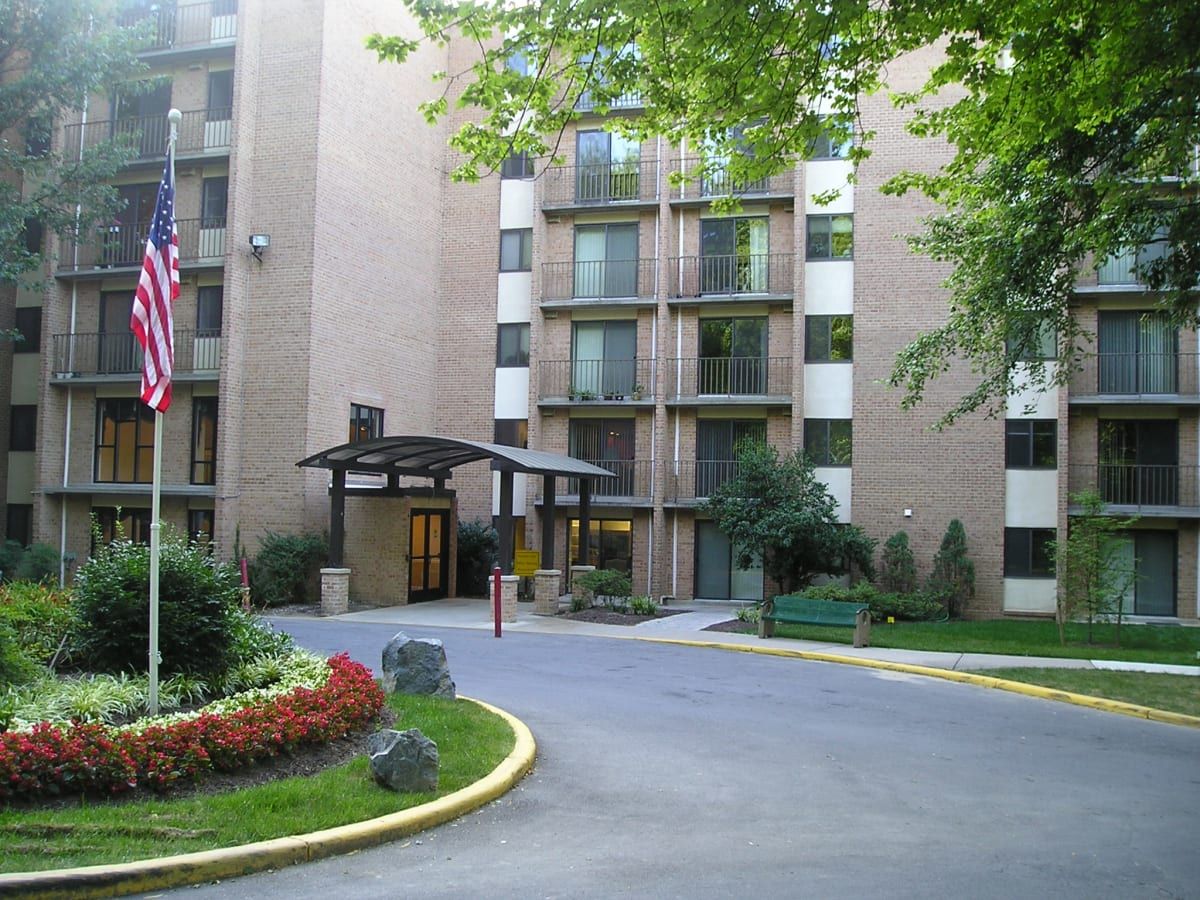
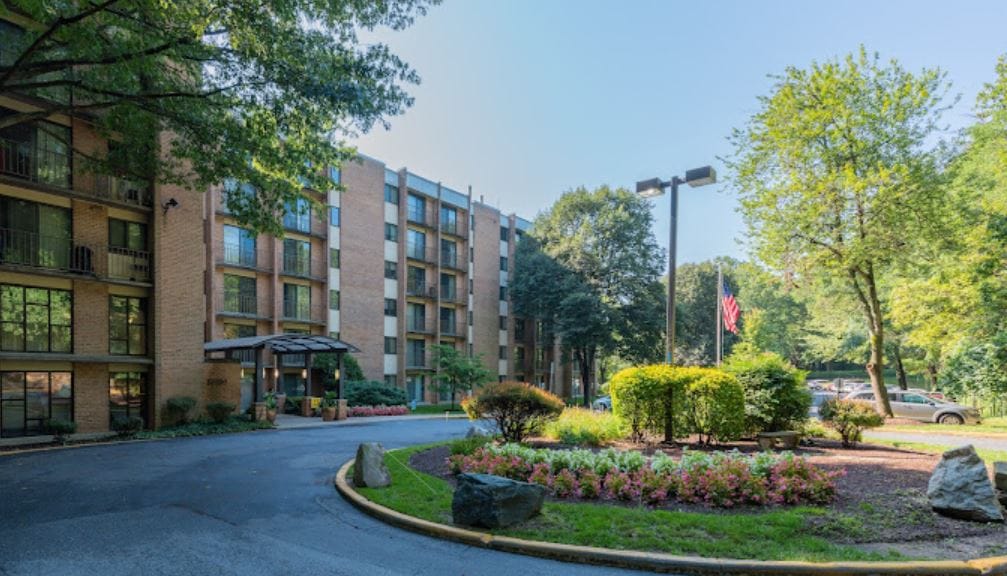
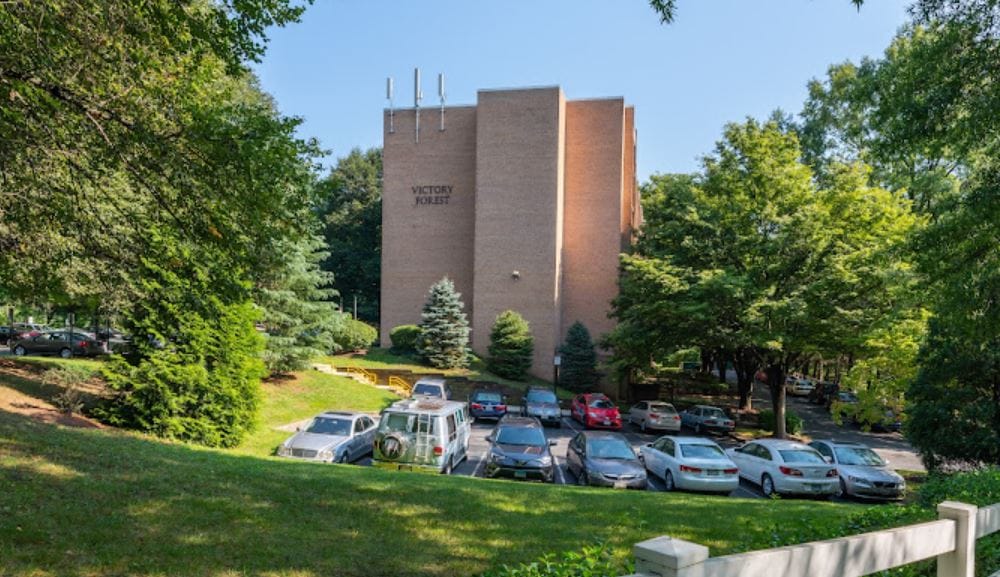
| Victory Forest | AL IL | Silver Spring (Forest Glen) | - | Yes |
33
Facility
33
MD AVG
43
Rank
#597 / 985 | 1 Bed | - | - | - | - | - | - | - | - | - | - |
Rows per page:

View all Nearby Homes
Make every moment of your best years count at Dulce Hogar, a welcoming haven in Silver Spring, MD, offering assisted living. Residents can ease their worries with a compassionate and well-trained team helping with their daily living activities and personal needs around the clock. The community also offers specially designed and secure accommodations, ensuring residents are comfortable and safe.
Enriching recreational activities and fun programs are conducted, encouraging residents to live actively and make new friends. Mealtimes promote social interactions with delicious and healthy dining options that cater to their dietary needs and preferences. Medication management and incontinence care are also available for comfort and convenience. The community is a great option for those seeking a worry-free retirement with exceptional services and well-maintained amenities.
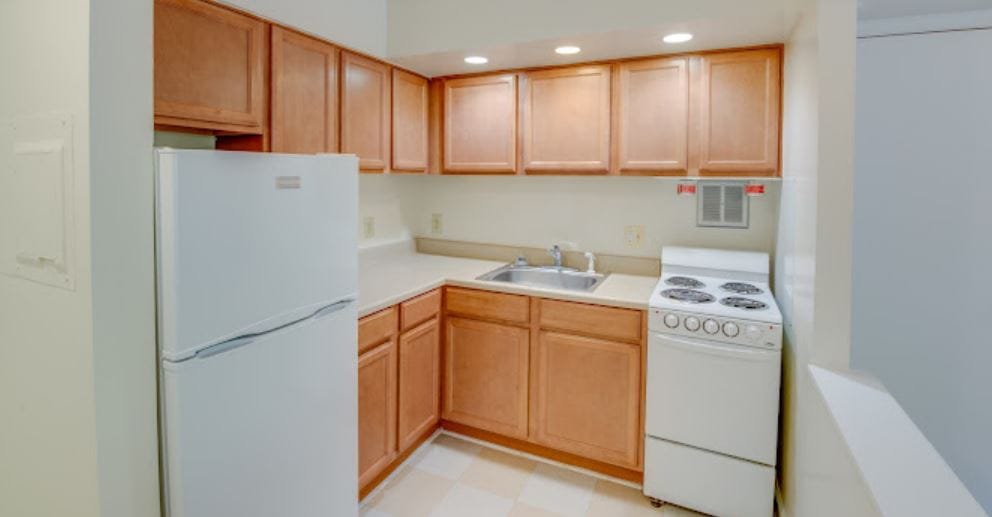
Victory Forest sits in the Forest Glen section of Silver Spring, Maryland, at 10000 Brunswick Ave. It’s a mid-rise building built around one-bedroom apartments, running 525 to 550 square feet, and residency starts at age 62. The neighborhood carries a Walk Score of 33. That’s “somewhat walkable” territory: a handful of errands are doable on foot, but most residents and visiting family will want a car.
Two things stand out on the amenity side: transportation services and fitness and recreation offerings. Beyond that, pets are welcome here, which matters for residents unwilling to leave a companion behind. Between the apartment size and the age threshold, Victory Forest reads as a fit for independent-minded older adults who want their own compact living space in a residential Silver Spring pocket, without needing everything within walking distance.
Spend your golden years doing what you love with Agape Living Assisted Living, a prominent senior living community located in the serene Cresthaven Drive, Silver Spring, MD, that specializes in assisted living. The community goes above and beyond to provide the right care for seniors’ various needs with different levels of care and assistance. Agape Living Assisted Living also offers medication management and memory care to ensure residents are well-cared for.
Understanding seniors at a deeper level allows the community to provide them with a care plan that best matches their needs and aspirations. Moreover, residents may explore new interests and relive old hobbies with a robust calendar of activities and programs. Agape Living Assisted Living promotes a lively and inviting environment for seniors to live without worries and make a more meaningful retirement.
Based in Silver Spring, MD, Sunny Side Manor Communities I is a budget-friendly yet excellent senior living community, offering assisted living. The community is known for its warm and supportive environment with a range of living arrangements to cater to residents’ unique needs. Residents can freely choose the degree of care and assistance they’ll receive based on their individual needs and preferences–maintaining their independence and autonomy.
At Sunny Side Manor Communities I, residents enjoy a maintenance-free lifestyle with more time for the community’s fitness activities, social events, and planned day trips. Meals are prepared using fresh and organic ingredients with accommodations for special dietary needs. Conveniences like scheduled transportation and concierge services are also offered to make residents’ lives as comfortable as possible.
Seek exceptional care in Royal Healthcare Services, an idyllic community in Silver Spring, MD, offering assisted living. With a compassionate and well-trained team, residents can rest assured of receiving personalized care tailored to their unique needs 24/7. The community also helps with housekeeping and other chores, so residents can feel at ease during their stay.
Prioritizing residents’ holistic wellness, a variety of fun activities and enriching programs are conducted based on their interests and capabilities. Mealtimes are also something to look forward to, with delicious and healthy dining options that cater to their dietary needs and preferences. Medication management is available to ensure residents take their medicine on time. The community is a good option for those looking to live comfortably in retirement, especially with its supportive and nurturing environment.
Make every moment of your golden years memorable with Jk House of Grace, a blissful retreat nestled between Leisure World Golf Club and Argyle Country Club in Silver Spring, MD, offering memory care. The community also offers hospice care, palliative care, respite care, podiatry care, and colostomy care for residents’ ever-changing needs. With a high caregiver ratio, residents can rest assured of receiving the utmost care and attention for their memory-related needs around the clock. As a family-operated community, the community strives to understand residents’ needs for better care and comfort.
A full calendar of well-thought-out activities and engaging programs is also conducted so that residents can remain active and socially engaged. Here, residents have the finest dining experience with delicious and healthy home-cooked meals that satisfy their dietary needs and preferences. Pet therapy and transportation services are also provided to enhance residents’ living condition. The community is ideal for those who need additional care for residents to live their golden years with ease.
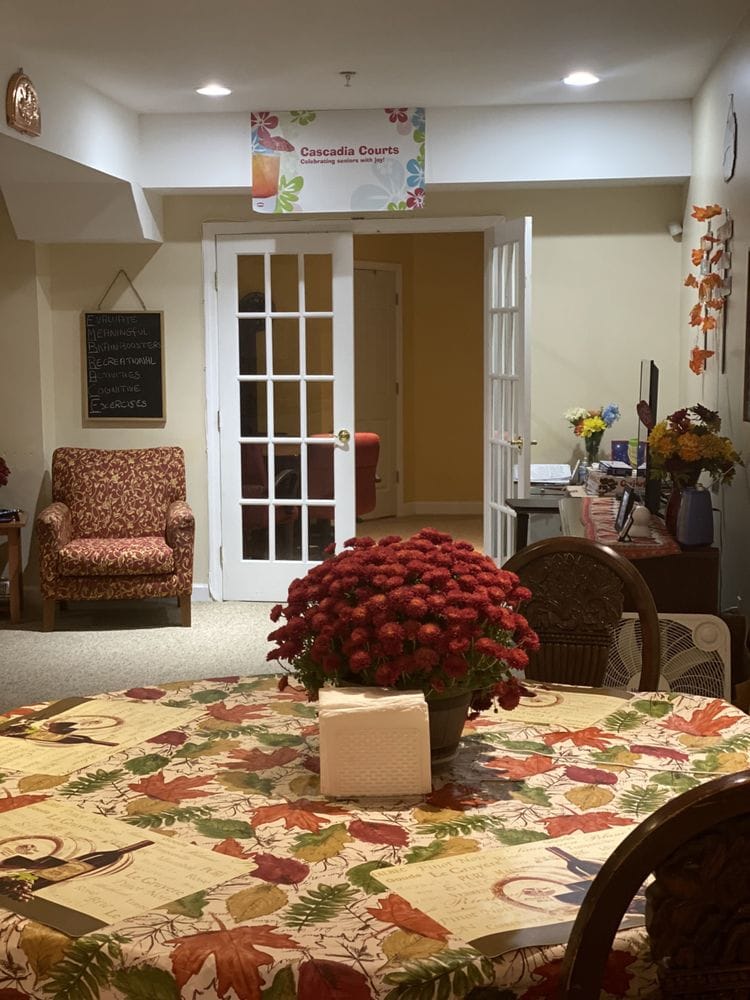
Experience a worry-free retirement at Cascadia Courts II, an astounding retreat in Silver Spring, MD, offering assisted living. Residents do not have to worry about their daily living activities and personal needs with a kind and highly trained team available 24/7. With its nurturing and welcoming environment, residents are guaranteed the utmost comfort and safety during their stay.
Encouraging residents to live actively and have fun, a well-thought-out calendar of engaging activities and enriching programs is conducted. Catering to residents’ dietary needs and preferences, delicious and well-balanced meals are served. With its state-of-the-art amenities and exceptional services, the community makes an enticing option for residents to thrive in their golden years.
Overview of Serene Haven Care & Assisted Living


Located in Silver Spring, Maryland, Serene Haven Care & Assisted Living is a warm and cozy 5-bed assisted living home. This facility is dedicated to providing residents with a loving, secure, and homelike environment. They aim to ensure seniors and their loved ones receive the highest quality care and service. Senior residents also find spacious, tastefully decorated rooms and inviting public areas, creating a comfortable and welcoming atmosphere.
At Serene Haven, the dedicated team empowers residents to maintain their independence while offering compassionate support. The management team, led by Elsie Geffrard (RN, MSN, Delegating Nurse), Nathalie Felix (RN, BSN, Delegating Nurse), and Giles Charleston (Assisted Living Manager), brings decades of clinical and operational experience to ensure excellent care and service delivery. With seasoned nurses like Elsie and Nathalie, who have extensive experience in bedside and hospital care, community health, case management, and patient home care, complemented by Giles’ operational management expertise, Serene Haven Care & Assisted Living provides a haven where seniors can thrive and find comfort in their golden years.
CareVilla Blue Spruce is a one-of-a-kind community located near serene parks in Blue Spruce Lane, Silver Spring, MD, offering assisted living, memory care, palliative care, and short-term care. Dedicated to improving residents’ quality of life, the community promotes a cozy and quaint setting with five beds and top-notch care and assistance around the clock. Here, residents keep their peace of mind with the community’s specially designed amenities and friendly environment.
Fun activities and engaging programs are also conducted for residents to remain active and well-connected. Housekeeping, laundry services, and meal preparation are provided to ensure residents enjoy a maintenance-free lifestyle. The community also offers medication management, continence management, and diagnosis management for residents’ healthcare needs. Spend your golden years receiving the utmost care and support you deserve with the community’s genuine care and stress-free spaces.
Set near Highway 495 on Cresthaven Drive, Silver Spring, MD, Apple Blossoms Assisted Living II is a dedicated haven that provides assisted living, respite care, and adult day services. The community strives to meet residents’ every need with onsite physicians and a certified care team delivering top-tier care and support around the clock. With its cozy and quaint setting, the community cares for up to five residents and provides them with care plans tailored to their health and wellness.
Recreational activities and planned trips are conducted to keep residents active and well-connected. The community also provides specialized memory care programs, medication administration, and mobile dental services for comfort and convenience. Promoting a home-like environment, residents are empowered to live their lives to the fullest surrounded by relaxing spaces.
Ranking Methodology
How we rank these communities
Every community above is evaluated across six weighted categories using public data including state inspection records, review platforms, BBB profiles, and operator-published materials.
Weighting overview
- 35%Resident Experience
- 25%Regulatory
- 15%Visual Media
- 10%Website
- 10%Stability
- 5%Environment
01
Resident & Family Experience 35%
The single largest share of every ranking. Aggregated review sentiment and volume from major platforms — the closest signal to real resident experience.
- Includes
- Review Sentiment
- Review Volume
02
Regulatory & Safety Record 25%
State inspection records, citations, and complaint visits. We weight per-inspection rates more heavily than raw counts.
- Includes
- State Inspections
- Citations/Inspection
- % Inspections w/ Citations
- Complaint Visits
- Accreditations
- BBB Rating
03
Visual Media & Transparency 15%
Communities that publish high-quality visuals give families a real preview. No photos or tours = a negative transparency signal.
- Includes
- Video Tours
- Virtual Walkthroughs
- Photo Quantity
- Photo Quality
04
Website & Operator Transparency 10%
Site quality and whether the operator publishes basic accountability information — staff names, contact details, ownership.
- Includes
- Website Content
- Mobile Usability
- Staff Info Available
- Owner Info Available
05
Community Stability 10%
Operational signals indicating whether a community is well-run and meeting demand.
- Includes
- Occupancy Rate
- Bed Options
06
Environment & Pricing 5%
Walkability and pricing transparency. Walk Score is weighted higher for Independent Living than for Memory Care, where most residents do not leave unaccompanied.
- Includes
- Walk Score
- Pricing Transparency
Who we are
Your Senior Care Partner, Every Step of the Way
We help families find affordable senior communities and unlock same day discounts, Medicaid, and Medicare options tailored to your needs.
Contact us Today
Frequently Asked Questions about Assisted Living in Silver Spring, MD
What is the average cost of assisted living in Silver Spring, MD?
The average monthly cost of assisted living in Silver Spring, MD is approximately $6,000. Actual rates vary by community, level of care, and floorplan.
What is the price range for assisted living in Silver Spring, MD?
Assisted living in Silver Spring, MD typically ranges from $5,500–$8,100 per month, depending on the community, room type, and care needs.
What is the typical staff-to-resident ratio at assisted living facilities in Silver Spring, MD?
Assisted living facilities in Silver Spring, MD typically operate with a staff-to-resident ratio in the range of 1:6 to 1:12.
What's the difference between assisted living and memory care in Maryland?
Assisted living in Maryland supports residents with daily activities (bathing, dressing, medication management) while preserving independence. Memory care is a specialized form of assisted living for residents living with Alzheimer's or dementia, and adds 24/7 secured environments, dementia-trained staff, and structured routines designed to reduce confusion and wandering.
What's the difference between assisted living and a nursing home in Maryland?
Assisted living in Maryland is a residential model focused on housing, hospitality, and help with daily activities. Nursing homes (skilled nursing facilities) provide 24/7 medical care from licensed nurses for residents with significant health needs, and are regulated more strictly under both state and federal CMS rules.
Does Maryland Medicaid cover assisted living?
Maryland Medicaid does not directly pay room-and-board for assisted living, but most states (including Maryland) offer Home and Community-Based Services (HCBS) waivers that can offset the cost of care services delivered inside a licensed community. Eligibility, waitlists, and covered services vary — check directly with the state Medicaid agency.
What is assisted living?
Assisted living combines private or semi-private apartments with help on activities of daily living (meals, bathing, dressing, medication management) and a social calendar — for residents who need some support but do not need 24/7 medical care.
Updated on
