Alvarado Care Center
Nursing Home, Respite Care & Nursing Care · Los Angeles, CA
CMS overall rating Info The Overall CMS Rating is scored from 1 to 5 stars and combines results from health inspections, staffing levels, and quality measures. Health inspections carry the most weight. Staffing and quality scores can increase or decrease the final rating based on performance compared to state and national standards.

Alvarado Care Center

Nursing Home, Respite Care & Nursing Care · Los Angeles, CA
CMS overall rating Info The Overall CMS Rating is scored from 1 to 5 stars and combines results from health inspections, staffing levels, and quality measures. Health inspections carry the most weight. Staffing and quality scores can increase or decrease the final rating based on performance compared to state and national standards.
Calculator: See prices in your area
Alvarado Care Center accepts Medicare, Medicaid, and private pay.

Overview of Alvarado Care Center

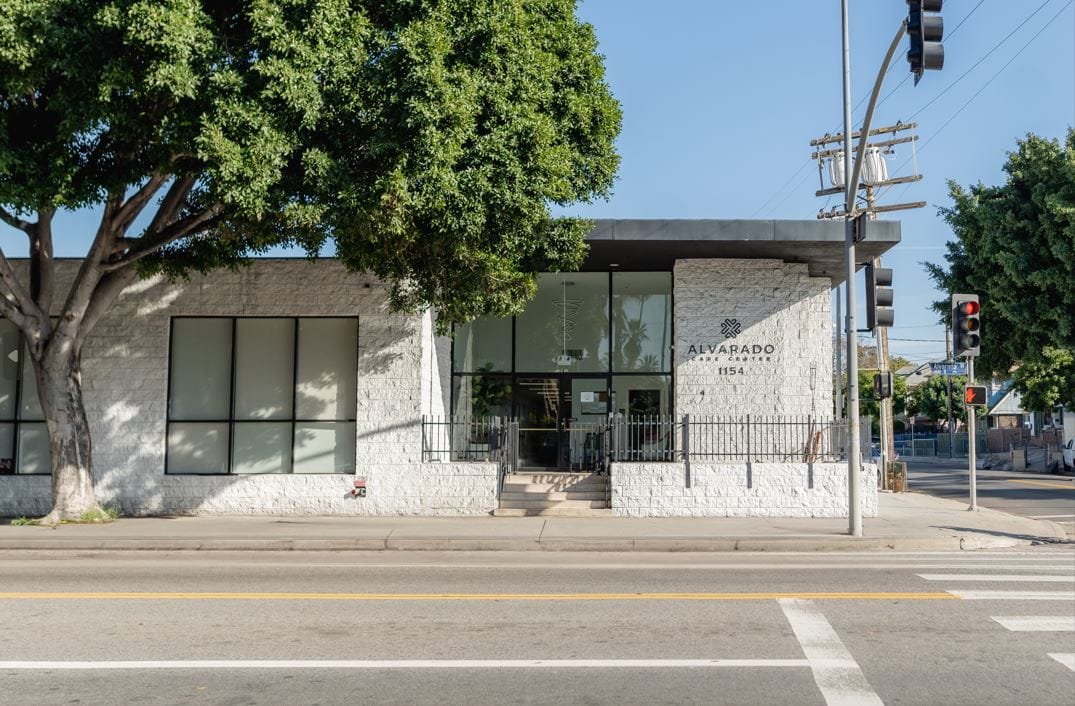
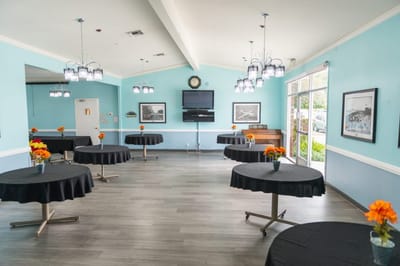
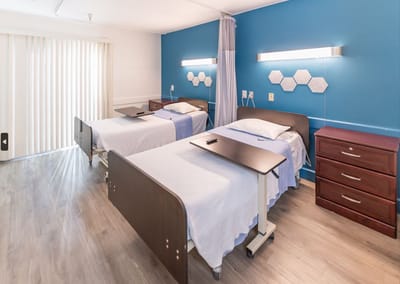
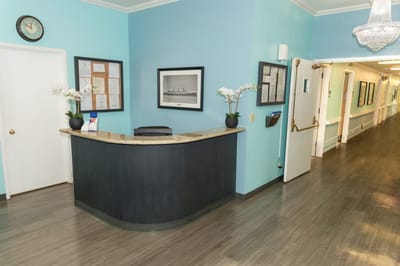
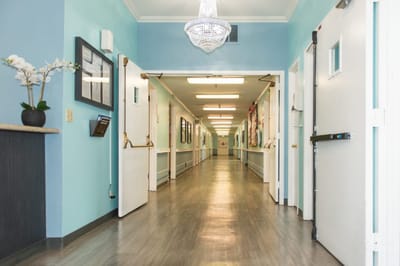
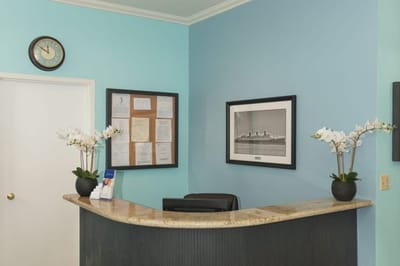
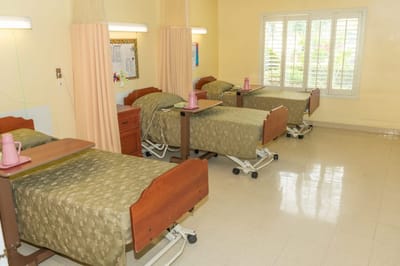
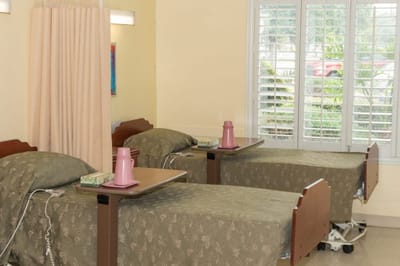
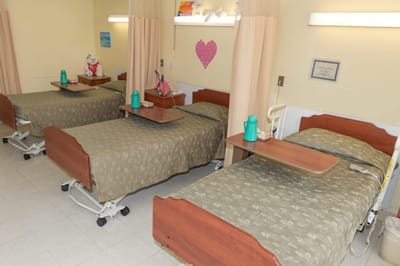
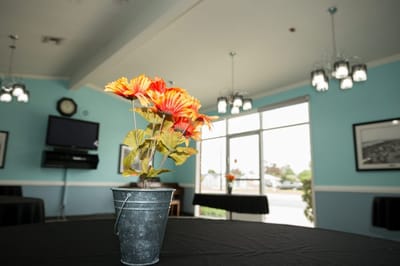
In the heart of Los Angeles, California, Alvarado Care Center emerges as a distinguished nursing and rehabilitation center committed to delivering unparalleled quality care. Their dedication to excellence is evident in the meticulously remodeled patient rooms designed to offer residents an elevated standard of comfort. Whether individuals seek short-term rehabilitation following surgery, fractures, or stroke, or require long-term care, Alvarado Care Center transforms into a second family.

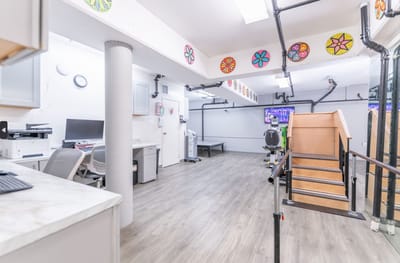
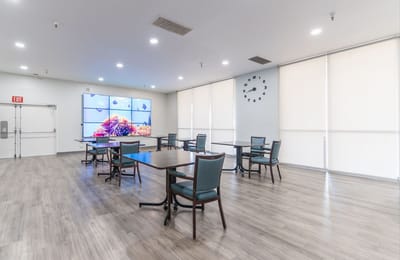
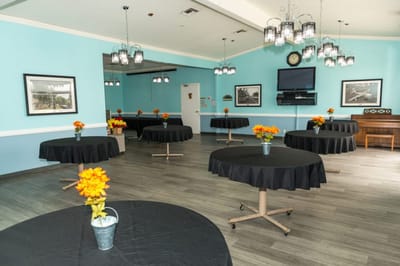
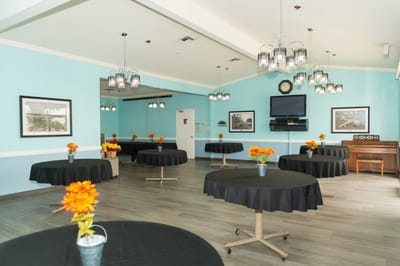
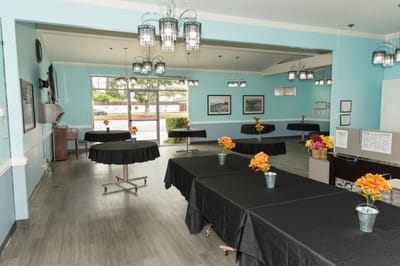
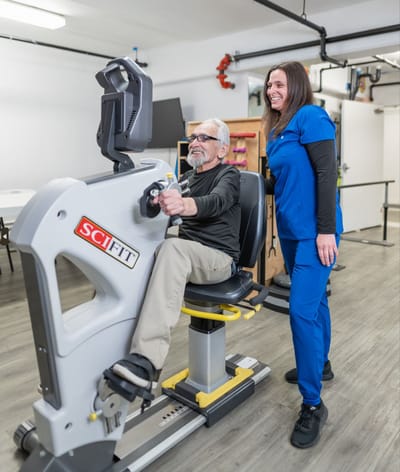
Residents at Alvarado Care Center indulge in delectable meals, engaging daily activities, and the support of an attentive staff prioritizing their overall well-being. At the core of Alvarado Care Center’s commitment is a state-of-the-art rehab room curated to provide residents with the highest level of care through expert-level clinicians and therapists. Alvarado Care Center becomes a haven where healing, comfort, and a sense of community seamlessly converge within its walls.

Quality ratings

Measured by Centers for Medicare & Medicaid Services (CMS)

Overall rating Info The Overall CMS Rating combines results from health inspections, staffing levels and quality measures. Health inspections carry the most weight. Staffing and quality scores can increase or decrease the final rating based on performance compared to state and national standards.
▼ 44.4% Below CA avg. ▼ 44.4% Below CA avg.Click the badge to see the full State ranking.Click here to see the full State ranking.
Health Inspection Info Based on the results of the facility's three most recent standard inspections and any complaint investigations. CMS reviews the number, scope, and severity of deficiencies, with more recent findings weighted more heavily.
▼ 36.5% Below CA avg. ▼ 36.5% Below CA avg.Click the badge to see the full State ranking.Click here to see the full State ranking.
Staffing Info Measures average nursing staff hours per resident per day, including Registered Nurses (RNs) and total nursing staff. Ratings are adjusted based on the level of care residents require and are compared to state and national benchmarks.
▼ 42.0% Below CA avg. ▼ 42.0% Below CA avg.Click the badge to see the full State ranking.Click here to see the full State ranking.
Quality Measures Info Based on clinical and physical health indicators reported to CMS, such as hospital readmissions, falls, pressure ulcers, and improvements in mobility. These measures reflect how well residents' health needs are being managed.
▼ 6.1% Below CA avg. ▼ 6.1% Below CA avg.Click the badge to see the full State ranking.Click here to see the full State ranking.

Staffing hours breakdown

Info Daily nursing hours per resident by staff type, reported to CMS. Higher is generally better — compare this facility to state and national averages to see where staffing stands.

Hours per resident per day — compared to California state averages

Total nursing care / resident Info This home is ranked 328th out of 346 homes in California. Total adjusted nursing hours per resident per day, combining RN, LPN, and aide time. CMS adjusts this for case-mix so facilities can be fairly compared.
3h 12m per day
Rank #328 / 346Nurse hours — State benchmarkedThis home is ranked 328th out of 346 homes in California. Shows adjusted nurse hours per resident per day benchmarked to the California average, with a ranking across 346 California SNFs. More hours mean more direct care. The national average is about 3.5 hrs; below 3.0 is a red flag.Click the rank badge to see the full State ranking.Click here to see the full State ranking.
This facility California avg (4h 23m per day)
vs California avg
-27%

5 of 6 metrics below state avg

Standout metric Physical Therapist is +20% above state avg
Staff typeHours / Day / Residentvs state avg
Registered Nurse (RN) Info RNs hold the highest nursing license and can assess residents, interpret test results, and direct care plans. More RN hours per day often signals stronger clinical oversight and faster response to health changes. 26m per day ▼ 33% State avg: 39m per day · National avg: 41m per day
LPN / LVN Info Licensed Practical Nurses (LPNs) or Licensed Vocational Nurses (LVNs) deliver routine hands-on care — medication administration, wound dressing, and monitoring vital signs. They work under RN supervision and make up a large share of daily bedside care. 1h 0m per day ▼ 18% State avg: 1h 13m per day · National avg: 52m per day
Nurse Aide Info Certified Nurse Aides (CNAs) provide the most direct day-to-day assistance: bathing, dressing, feeding, and mobility. Nurse aide hours are typically the largest staffing category and directly affect residents' quality of life. 2h 28m per day ▼ 6% State avg: 2h 38m per day · National avg: 2h 20m per day
Total Nursing (Weekend) Info Combined nursing hours (RN + LPN + Nurse Aide) per resident per day on weekends. Staffing often drops on weekends — this figure reveals whether the facility maintains adequate coverage outside of weekday hours. 3h 35m per day ▼ 12% State avg: 4h 5m per day · National avg: 3h 26m per day
Physical Therapist Info Hours per resident per day provided by licensed Physical Therapists (PTs) or PT Assistants. PT services help residents recover mobility after injury or illness and are especially important for post-acute (short-stay) rehabilitation. 6m per day ▲ 20% State avg: 5m per day · National avg: 4m per day
RN (Weekend) Info Registered nurse hours specifically on weekends. Facilities sometimes reduce RN presence on Saturdays and Sundays — a low weekend RN figure compared to weekday hours can indicate reduced clinical oversight when most administrative staff are absent. 21m per day ▼ 30% State avg: 30m per day · National avg: 28m per day
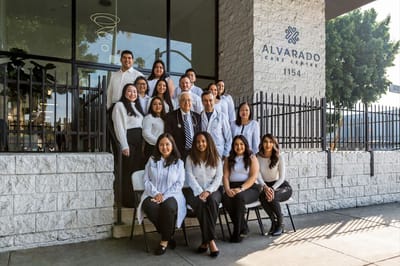
Types of Care at Alvarado Care Center

Nursing Home Respite Care Nursing Care

Capacity and availability

This home usually has limited availability

Occupancy between 85% and 95% suggests balanced demand.

Higher occupancy than the California average: 84.7%
Occupancy rate 91.6% Rank #82 / 351Occupancy rate — State benchmarkedThis home is ranked 82nd out of 351 homes in California. Shows this facility's occupancy rate versus the California average, with its Statewide rank out of 351. Higher occupancy signals strong local demand and financial stability.Click the rank badge to see the full State ranking.Click here to see the full State ranking.
Avg. Length of Stay 194 days
Occupancy rate
91.6% Rank #82 / 351Occupancy rate — State benchmarkedThis home is ranked 82nd out of 351 homes in California. Shows this facility's occupancy rate versus the California average, with its Statewide rank out of 351. Higher occupancy signals strong local demand and financial stability.Click the rank badge to see the full State ranking.Click here to see the full State ranking.
Avg. Length of Stay
194 days
Walk Score
Walk Score: 95 / 100 Rank #16 / 359Walk Score — State benchmarkedThis home is ranked 16th out of 359 homes in California. Shows how walkable this facility's neighborhood is compared to the average Walk Score across California SNFs. Higher scores benefit residents, families, and staff.Click the rank badge to see the full State ranking.Click here to see the full State ranking.
Walker's paradise. Daily errands do not require a car, with many shops and services nearby.
BBB Rating
BBB Rating: A+ (Not Accredited)
An independent rating from the Better Business Bureau based on factors such as complaint history, transparency, and business practices.
How BBB ratings work

About this community

License Details

CMS Certification Number56157

Therapy & Rehabilitation

3 services
Rehabilitation Services
Respite Care
Short-Term Rehab

Staffing & Medical

1 service
24-Hour Staffing

Memory & Specialized Care

1 service
No Alzheimer's certification

Additional Services

1 service
Short Term Rehabilitation

Amenities & Lifestyle

Specific ProgramsSkilled And Restorative Services, Dietary, Hospice, Respite Stays

Dining & Nutrition

Food DescriptionDelicious and nutritious meals prepared by an on-staff nutritionist.

Contact Alvarado Care Center

Inspection History

In California, the Department of Social Services (for assisted living facilities) and the Department of Public Health (for nursing homes) conduct inspections to ensure resident safety and regulatory compliance.

Read the full inspection reports for this facility, including detailed findings and corrective actions.

Show Inspection Reports

Health Inspection History

Inspections Since 2023
Total health inspections 13

California average 12.5


Last Health inspection on Sep 2025

Total health citations
55 Rank #244 / 354Health citations — State benchmarkedThis home is ranked 244th out of 354 homes in California. Shows this facility's total health deficiency citations benchmarked to the California State average, with a ranking across all 354 CA SNFs. Lower citation counts earn a better rank.Click the rank badge to see the full State ranking.Click here to see the full State ranking.

California average 50.2

Citations per inspection
4.23 Rank #182 / 354Citations per inspection — State benchmarkedThis home is ranked 182nd out of 354 homes in California. Shows average deficiency citations per CMS inspection for this facility versus the California mean across 354 SNFs with citation data. Lower is better.Click the rank badge to see the full State ranking.Click here to see the full State ranking.

California average 4.65


Health citations are formal notices following inspections when they fail to comply with safety and care standards.

32 of 55 citations resulted from standard inspections; and 23 of 55 resulted from complaint investigations.

Breakdown of citation severity (last 3 years)
Critical Health citations
1
150% worse than California average

California average: 0.4


Serious Health citations
1 Rank #1 / 156Serious citations (G–I) — State benchmarkedThis home is ranked 1st out of 156 homes in California. Shows G–I scope serious health citations for this facility versus other California SNFs. Lower counts rank better.Click the rank badge to see the full State ranking.Click here to see the full State ranking.
In line with California average

California average: 1

1 critical citation California average: 0.4

1 serious citation California average: 1

53 moderate citations California average: 47.2

0 minor citations California average: 1.5
Citations history (last 3 years)
Quality of Care moderate citation Sep 05, 2025
Corrected

Care Planning moderate citation Sep 05, 2025
Corrected

Care Planning moderate citation Sep 05, 2025
Corrected

Care Planning moderate citation Sep 05, 2025
Corrected

Staffing Data

Reporting period: October 1 – December 31, 2025 (Q4 2025). Source: CMS Payroll-Based Journal report.

Total staff 95
Employees 88
Contractors 7
Staff to resident ratio 1.38:1
1376712% better than California average
California average ratio: 0.00:1 California average ratio: 0.00:1See full California ranking
Avg staff/day 46
Average shift 7.4 hours
0% compared with California average
California average: 7.7 hours California average shift: 7.7 hoursSee full California ranking
Total staff hours (quarter) 31,254

Nursing staff breakdown

Q4 2025 · Oct 1 – Dec 31 More info This data comes from the CMS Payroll-Based Journal report covering October 1 – December 31, 2025.
Registered Nurse

Manages medical care and health needs.

Total count 9
Average shift length Info Average shift length. Calculated as total hours divided by days worked and average staff per day. 7.2 hours

No contractors work on this role.

Licensed Practical Nurse

Assists with medical care and medications.

Total count 16
Average shift length Info Average shift length. Calculated as total hours divided by days worked and average staff per day. 7.9 hours

No contractors work on this role.

Certified Nursing Assistant

Helps with daily care and mobility.

Total count 39
Average shift length Info Average shift length. Calculated as total hours divided by days worked and average staff per day. 7.6 hours

No contractors work on this role.

Contractor staffing

Q4 2025 · Oct 1 – Dec 31 More info This data comes from the CMS Payroll-Based Journal report covering October 1 – December 31, 2025.

Total hours from contractors

1.2%

380 contractor hours this quarter

Other Physician: 3 RN Director of Nursing: 1 Occupational Therapy Aide: 1 Clinical Nurse Specialist: 1 Medical Director: 1

Staff by category

Q4 2025 · Oct 1 – Dec 31 More info This data comes from the CMS Payroll-Based Journal report covering October 1 – December 31, 2025.
Certified Nursing Assistant3903915,63192100%7.6
Licensed Practical Nurse160165,51192100%7.9
Registered Nurse9092,19292100%7.2
Other Dietary Services Staff4041,1258997%7.9
RN Director of Nursing3141,0956672%7.9
Administrator2021,0246470%8
Physical Therapy Aide3038586975%5.1
Physical Therapy Assistant3036226975%5.9
Occupational Therapy Aide1126216773%7.5
Respiratory Therapy Technician3035697379%4.8
Nurse Practitioner1015126470%8
Speech Language Pathologist2025086571%7.8
Qualified Social Worker1014235358%8
Mental Health Service Worker1013905459%7.2
Other Physician033841415%4.7
Clinical Nurse Specialist011591314%4.5
Medical Director0113067%5
39 Certified Nursing Assistant
% of Days 100%
16 Licensed Practical Nurse
% of Days 100%
9 Registered Nurse
% of Days 100%
4 Other Dietary Services Staff
% of Days 97%
4 RN Director of Nursing
% of Days 72%
2 Administrator
% of Days 70%
3 Physical Therapy Aide
% of Days 75%
3 Physical Therapy Assistant
% of Days 75%
2 Occupational Therapy Aide
% of Days 73%
3 Respiratory Therapy Technician
% of Days 79%
1 Nurse Practitioner
% of Days 70%
2 Speech Language Pathologist
% of Days 71%
1 Qualified Social Worker
% of Days 58%
1 Mental Health Service Worker
% of Days 59%
3 Other Physician
% of Days 15%
1 Clinical Nurse Specialist
% of Days 14%
1 Medical Director
% of Days 7%

Penalties and fines

Includes penalties issued in 2024

Federal penalties imposed by CMS for regulatory violations, including civil money penalties (fines) and denials of payment for new Medicare/Medicaid admissions.

Source: CMS Penalties Database (Data as of Jan 2026)

Total fines amount $52K Rank #308 / 354Federal fines — State benchmarkedThis home is ranked 308th out of 354 homes in California. Shows this facility's cumulative CMS federal fine dollars versus the California average among facilities with fines, and where it ranks among 354 skilled nursing facilities in the pool. Lower total dollars mean a better rank.Click the rank badge to see the full State ranking.Click here to see the full State ranking.
In line with California average

California average: $55K

Number of fines 2
15% fewer fines than California average

California average: 2.4

Payment Denials Info Serious action where Medicare and/or Medicaid temporarily stops payments for new residents until issues are fixed. 0
100% fewer payment denials than California average

California average: 0.5

Fines amount comparison
This facility $52K
California average $55K
Penalty History

Penalties are imposed by CMS for violations of federal nursing home regulations.

1 penalty in the past 3 years

Jun 26, 2024 · $41K

Civil Money Penalty Info Fines imposed for noncompliance, which can be assessed per day or per instance of violation. Jun 26, 2024
$41K

Last updated: Jan 2026

Quality of care over time

These measures show how residents usually do over time at this home, based on health outcomes and preventive care.

High-risk clinical events score Info A composite score based on pressure ulcers, falls with injury, weight loss, walking ability decline, and activities of daily living decline. 7.5
13% worse than California average

California average: 6.6

Functional decline score Info A composite score based on activities of daily living decline, walking ability decline, and incontinence. 9.2
19% better than California average

California average: 11.3

Long-stay resident measures
Significantly above average California avg: 4.2 Info CMS star rating based on long-stay quality measure performance. 5 stars = significantly above average, 1 star = significantly below average.
Need for Help with Daily Activities Increased Info Percent of long-stay residents whose need for help with daily activities has increased 14.0%
27% worse than California average

California average: 11.1%

Walking Ability Worsened Info Percent of long-stay residents whose ability to move independently worsened 6.8%
43% better than California average

California average: 12.0%

Low Risk Residents with Bowel/Bladder Incontinence Info Percent of low risk long-stay residents who lose control of their bowels or bladder 6.8%
40% better than California average

California average: 11.3%

Falls with Major Injury Info Percent of long-stay residents experiencing one or more falls with major injury 0.5%
71% better than California average

California average: 1.7%

High Risk Residents with Pressure Ulcers Info Percent of long-stay high risk residents with pressure ulcers 2.6%
48% better than California average

California average: 5.0%

Urinary Tract Infection Info Percent of long-stay residents with a urinary tract infection 0.0%
100% better than California average

California average: 1.2%

Lost Too Much Weight Info Percent of long-stay residents who lose too much weight 13.4%
219% worse than California average

California average: 4.2%

Depressive Symptoms Info Percent of long-stay residents who have depressive symptoms 11.5%
72% worse than California average

California average: 6.7%

Antipsychotic Use Info Percent of long-stay residents who received an antipsychotic medication 46.0%
356% worse than California average

California average: 10.1%

Pneumococcal Vaccine Info Percent of long-stay residents assessed and appropriately given the pneumococcal vaccine 99.0%
In line with California average

California average: 98.5%

Influenza Vaccine Info Percent of long-stay residents assessed and appropriately given the seasonal influenza vaccine 100.0%
In line with California average

California average: 98.2%

Hospitalizations per 1,000 days Info Number of hospitalizations per 1,000 long-stay resident days. 2.08
8% better than California average

California average: 2.25

ED visits per 1,000 days Info Number of outpatient emergency department visits per 1,000 long-stay resident days. 1.47
8% better than California average

California average: 1.59

Short-stay resident measures
Below average California avg: 3.5 Info CMS star rating based on short-stay quality measure performance. 5 stars = much above average, 1 star = much below average.
Pneumococcal Vaccine Info Percent of short-stay residents assessed and appropriately given the pneumococcal vaccine 97.3%
In line with California average

California average: 94.0%

Antipsychotic medication increase Info Percent of short-stay residents who newly received an antipsychotic medication 6.3%
331% worse than California average

California average: 1.5%

Influenza Vaccine Info Percent of short-stay residents assessed and appropriately given the seasonal influenza vaccine 96.5%
In line with California average

California average: 93.2%

Re-hospitalized after SNF stay Info Percentage of short-stay residents who were re-hospitalized after their nursing home admission. 27.3%
18% worse than California average

California average: 23.2%

Emergency department visits Info Percentage of short-stay residents who had an outpatient emergency department visit. 11.5%
In line with California average

California average: 11.2%

Falls with major injury Info Percentage of SNF residents who experience falls with major injury during their stay. 0.0%
100% better than California average

California average: 0.8%

Ability to care for self at discharge Info Percentage of residents at or above expected ability to care for themselves at discharge. 81.7%
52% better than California average

California average: 53.7%

Successful return to home or community Info Rate of successful return to home or community from a skilled nursing facility. 34.3%
32% worse than California average

California average: 50.6%

Breakdown by payment type

Medicare

31% of new residents, usually for short-term rehab.

Typical stay 5 - 6 months

Private pay

9% of new residents, often for short stays.

Typical stay 22 days

Medicaid

60% of new residents, often for long-term daily care.

Typical stay 4 - 5 months

Facility Characteristics

Source: CMS Long-Term Care Facility Characteristics (Data as of Jan 2026)

Total residents 69
Medicare
35
50.7% of residents
Medicaid
34
49.3% of residents
Programs & Services
Residents Group

Residents meet regularly to discuss policies, care quality, and activities

Family Member Group

Family members meet regularly to discuss policies, care quality, and activities

Nurse Aide Training

State-approved Nurse Aide Training and Competency Evaluation Program on-site

Active Family Council

Organized group of family members that meets regularly to discuss facility policies, resident care, and activities.

Active Resident Council

Organized group of residents that meets regularly to discuss facility policies, quality of life, and activities.

Finances and operations

Privately-owned community
Home revenue
$15.4M
Profit
$3.4M
Privately-owned community
Home revenue
$15.4M Rank #200 / 347Revenue — State benchmarkedThis home is ranked 200th out of 347 homes in California. Shows this facility's annual revenue compared to the California SNF average. Higher revenue generally means more resources for staffing and capital — read alongside Payroll %.Click the rank badge to see the full State ranking.Click here to see the full State ranking.
Profit
$3.4M
Payroll costs Info The portion of the home's budget spent on staff, including nurses, caregivers, and other employees who support care and operations. Rank #275 / 347Payroll — State benchmarkedThis home is ranked 275th out of 347 homes in California. Shows total annual staff payroll benchmarked to the California average. Higher payroll investment relative to peers often signals better staffing and less reliance on cheaper contract labor.Click the rank badge to see the full State ranking.Click here to see the full State ranking.
$5.5M
35.5% of revenue Rank #311 / 347Payroll % — State benchmarkedThis home is ranked 311th out of 347 homes in California. Shows payroll as a percentage of revenue versus the California average. Well-run California SNFs typically land around 56–67% — the top third Statewide. Below 25% may signal understaffing or heavy agency use — read with Staffing ratings.Click the rank badge to see the full State ranking.Click here to see the full State ranking.
Other operating costs Info All remaining costs needed to run the home, such as food, utilities, building maintenance, supplies and administrative expenses.
$6.6M
Total costs $12.0M

What does this home offer?

Total residents icon

Total Residents: 72

Building type icon
Building type icon

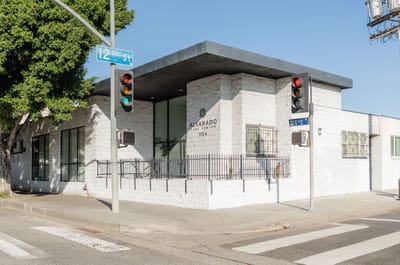
Building Type: Single-story

Who this home usually serves

TYPE OF STAY

Mostly long-term care residents

Most residents stay for extended periods and receive ongoing daily care.

Video

Get to know the community with a high-definition video tour
Video tour: Alvarado Care Center
Watch this video about life at Alvarado Care Center
icon

Places of interest near Alvarado Care Center

Address 3.0 miles from city center Info Estimated distance in miles from Los Angeles's city center to Alvarado Care Center's address, calculated via Google Maps. — 1.01 miles to nearest hospital (PIH Health Good Samaritan Hospital)

Calculate Travel Distance to Alvarado Care Center

Add your location

Address

Financial Assistance for
Nursing Home in California

Alvarado Care Center is located in Los Angeles, California.
Here are the financial assistance programs available to residents in California.

Get Financial aid guidance

Multipurpose Senior Services Program

MSSP (Medi-Cal Waiver)

Age 65+
General California resident, Medi-Cal eligible, nursing home risk.
Income Limits (2025) ~$2,829/month 300% FBR, individual
Asset Limits $2,000 (individual), $3,000 (couple).
CA

County-managed; waitlists possible.

Benefits
In-home support (4-6 hours/day) Respite care (14 days/year) Meals (~$6/meal) Transportation (8 trips/month) Care management

In-Home Supportive Services (IHSS)

California IHSS

Age 65+
General California resident, Medicaid-eligible or low-income.
Income Limits ~$1,732/month individual, Medi-Cal threshold
Asset Limits $2,000 individual
CA

Can hire family as caregivers.

Benefits
Personal care (up to 283 hours/month) Homemaker services Respite (varies)

Multipurpose Senior Services Program (MSSP)

CA MSSP

Age 65+
General California resident, Medi-Cal-eligible, nursing home-eligible but community-capable.
Income Limits ~$2,829/month 300% FBR, individual
Asset Limits $2,000 individual
CA

Available in 38 counties; waitlists common.

Benefits
Case management Respite care (up to 10 days/year) Minor home mods (avg. $500) Adult day care (~$50/day)

Property Tax Postponement Program (PTP)

CA PTP

Age 62+
General California resident, own and live in home, 40% equity.
Income Limits (2025) ~$51,500/year household, adjusted annually
Asset Limits Equity-based; no strict asset cap.
CA

Deferred taxes accrue interest (5% as of 2024); repaid upon sale/death.

Benefits
Property tax deferral (avg. $1,000-$3,000/year, varies by county)

Assisted Living Waiver (ALW)

CA ALW

Age 65+ or disabled
General California resident, Medi-Cal-eligible, nursing home-eligible.
Income Limits ~$2,829/month 300% FBR, individual
Asset Limits $2,000 individual
CA

Available in 15 counties (e.g., LA, Sacramento); waitlists common.

Benefits
Personal care in ALFs (5-7 hours/day) Medication management Social services

California CARES Program

CA CARES

Age
General Caregivers of California residents 60+ needing help with 3+ daily activities; no caregiver age limit.
Income Limits No strict limit; cost-sharing above ~$2,500/month threshold.
Asset Limits Not applicable; need-based.
CA

High demand in urban areas; complements IHSS respite.

Benefits
Respite care (up to 10 days/year) Counseling (4-6 sessions/year) Training (2-3 workshops/year) Supplies (~$200/year)

Compare Nursing Home around Los Angeles

The information below is reported by the California Department of Social Services and Department of Public Health.

4 facilities compared · CMS & CA Dept. of Health data

Filter by care type
Hollenbeck Palms
NH

Nursing Home Licensed facility providing 24/7 skilled nursing care for residents with complex, ongoing medical needs. Staffed by RNs, LPNs, and CNAs. Inspected and star-rated annually by CMS. Accepts Medicare (short-term rehab) and Medicaid (long-term care).

AL

Assisted Living A licensed, long-term care setting for seniors or individuals with disabilities who need help with daily activities — like bathing, dressing, and medication management — but not 24-hour skilled nursing. Offers housing, meals, and around-the-clock support while aiming to maximize resident independence.

IL

Independent Living Lifestyle-focused communities for older adults offering dining, activities, and transportation with minimal personal care. Best for active, independent seniors who want community without medical support.

MC

Memory Care Secured, specialized care for people living with Alzheimer's or dementia. Staff trained in cognitive impairment, with higher staff-to-resident ratios and an environment designed to reduce confusion and wandering risk.

Los Angeles (Central La)185 50.3% -41%4.84 -8%+15%$0396.5156- 62 Casey Adams$25.8M$16.5M63.9%55115
A&A Assisted Living Homes
NH

Nursing Home Licensed facility providing 24/7 skilled nursing care for residents with complex, ongoing medical needs. Staffed by RNs, LPNs, and CNAs. Inspected and star-rated annually by CMS. Accepts Medicare (short-term rehab) and Medicaid (long-term care).

AL

Assisted Living A licensed, long-term care setting for seniors or individuals with disabilities who need help with daily activities — like bathing, dressing, and medication management — but not 24-hour skilled nursing. Offers housing, meals, and around-the-clock support while aiming to maximize resident independence.

HC

Home Care Professional care delivered in the person's own home — from companionship and errands to skilled nursing and therapy. Allows seniors to age in place. Medicare covers skilled home health when medically necessary.

IL

Independent Living Lifestyle-focused communities for older adults offering dining, activities, and transportation with minimal personal care. Best for active, independent seniors who want community without medical support.

Shadow Hills (Sun Valley)6 83.3% -2%4.03 +20%-4%$0287.0-38- 3 Michelle Nydam---555815
Alvarado Care Center
NH

Nursing Home Licensed facility providing 24/7 skilled nursing care for residents with complex, ongoing medical needs. Staffed by RNs, LPNs, and CNAs. Inspected and star-rated annually by CMS. Accepts Medicare (short-term rehab) and Medicaid (long-term care).

Los Angeles (Pico-Union)72 91.6% +8%3.20 +11%-24%$52.5k554.2270A+ 95 Michael Smilow$15.4M$5.5M35.5%56157
Alexandria Care Center
NH

Nursing Home Licensed facility providing 24/7 skilled nursing care for residents with complex, ongoing medical needs. Staffed by RNs, LPNs, and CNAs. Inspected and star-rated annually by CMS. Accepts Medicare (short-term rehab) and Medicaid (long-term care).

AL

Assisted Living A licensed, long-term care setting for seniors or individuals with disabilities who need help with daily activities — like bathing, dressing, and medication management — but not 24-hour skilled nursing. Offers housing, meals, and around-the-clock support while aiming to maximize resident independence.

IL

Independent Living Lifestyle-focused communities for older adults offering dining, activities, and transportation with minimal personal care. Best for active, independent seniors who want community without medical support.

MC

Memory Care Secured, specialized care for people living with Alzheimer's or dementia. Staff trained in cognitive impairment, with higher staff-to-resident ratios and an environment designed to reduce confusion and wandering risk.

Los Angeles (East Hollywood)177 92.7% +9%3.96 +11%-6%$01045.5-161- 92 Magnolia Health Management I LLC$30.1M$11.2M37.2%56113

Frequently Asked Questions about Alvarado Care Center

What neighborhood is Alvarado Care Center in?

Alvarado Care Center is in the Pico-Union neighborhood of Los Angeles.

Is Alvarado Care Center in a walkable area?

Alvarado Care Center has a walk score of 95. Walker's paradise. Daily errands do not require a car, with many shops and services nearby.

What is the occupancy rate at Alvarado Care Center?

Alvarado Care Center's occupancy is 91.6%.

Who is the administrator of Alvarado Care Center?

field_administrator is the administrator of Alvarado Care Center.

Are there photos of Alvarado Care Center?

Yes — there are 16 photos of Alvarado Care Center in the photo gallery on this page.

What is the address of Alvarado Care Center?

Alvarado Care Center is located at 1154 S Alvarado St, Los Angeles, CA 90006, United States.

What is the phone number of Alvarado Care Center?

(213) 385-1715 will put you in contact with the team at Alvarado Care Center.

Guides for Better Senior Living

Care Cost Calculator: See Prices in Your Area

Nursing Home Data Explorer

Don’t Wait Too Long: 7 Red Flag Signs Your Parent Needs Assisted Living Now

The True Cost of Assisted Living in 2025 – And How Families Are Paying For It

Understanding Senior Living Costs: Pricing Models, Discounts & Financial Assistance

Explore Open Rooms
1 Contact details
2 What type of senior care service are you looking for?
3 What budget do you have in mind for senior care?
4 How soon do you need to find care?
5 Additional details

Thank you for your interest!

Our team will be in touch shortly to help with next steps.