


Ameristar Assisted Living, Inc. II
Assisted Living, Home Care & Nursing Care · Bowie, MD


Ameristar Assisted Living, Inc. II
Assisted Living, Home Care & Nursing Care · Bowie, MD
Overview of Ameristar Assisted Living, Inc. II
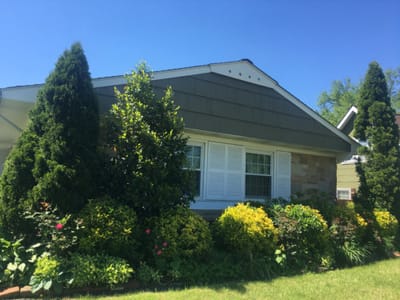
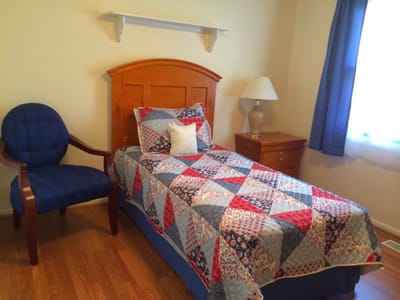
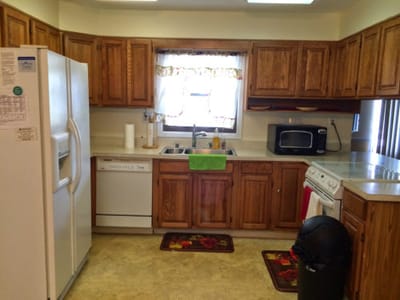
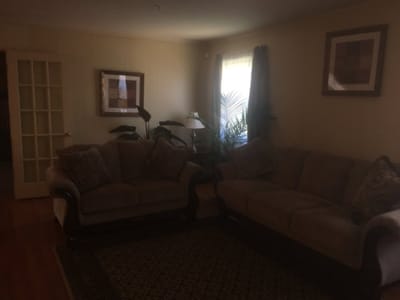
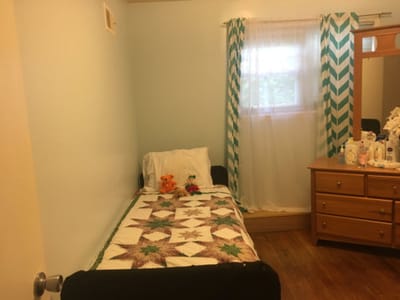
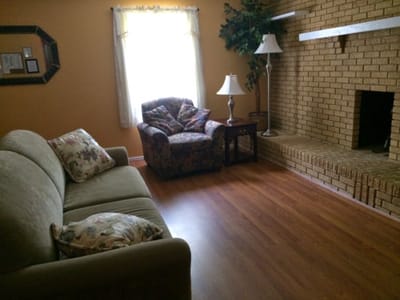
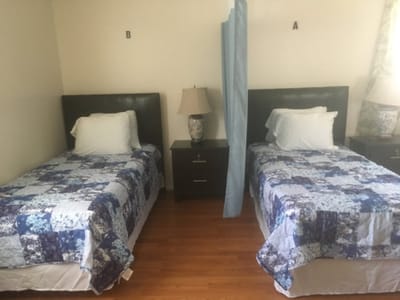
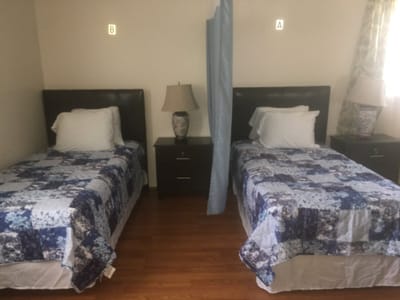
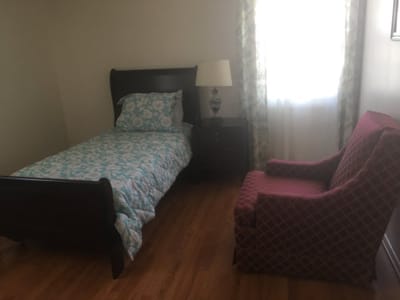
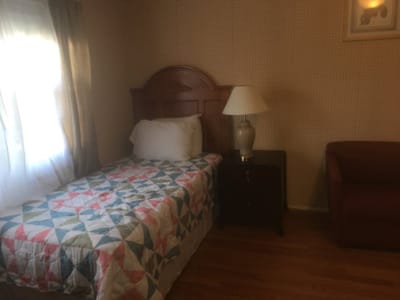
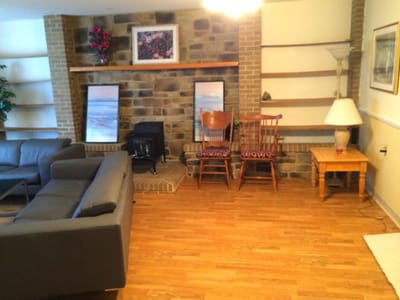
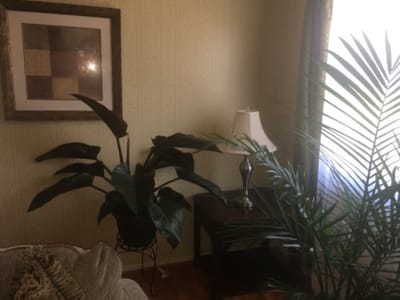
Discover a worry-free lifestyle, free from the stresses of daily living with Ameristar Assisted Living, Inc. II, a charming senior living community in Bowie, MD, offering excellent assisted living services in three different levels. The community ensures residents are well-cared for even as their needs change by offering an array of services, including assistance with daily living activities, nursing care, medication management, as well as care services for residents dealing with dementia and a range of different disabilities and conditions. Most of the tiring chores, such as housekeeping, meal preparation, and laundry are also handled by an attentive team to ensure residents are comfortable.
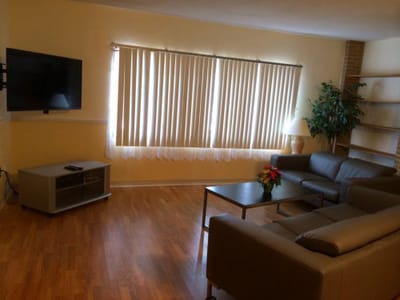
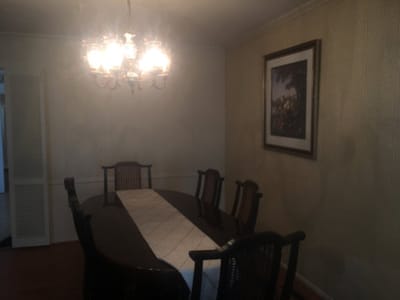
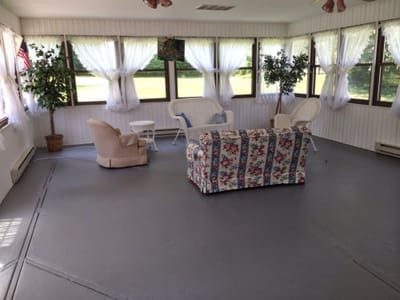
A broad array of social, educational, recreational activities, and exercise programs are offered to encourage residents to participate, connect with other people, and continue their passions and interests for a fulfilling living experience. Residents’ nutritional needs are always monitored to ensure their meals and snacks are made to be both appetizing and nutritionally balanced, as well as catered to satisfy their needs. With comprehensive care services, a dedicated care team, and convenient services, residents here are sure to live a fulfilling and enjoyable life.
5-bed community Rank #436 / 697Bed count — State benchmarkedThis home is ranked 436th out of 697 homes in Maryland. Shows this facility's certified or reported bed count compared to other Maryland facilities. Larger communities may offer more amenities, programs, and on-site services for residents and families.Click the rank badge to see the full State ranking.Click here to see the full State ranking.
A smaller, more intimate setting that may offer a quieter environment and closer staff-resident interactions.
Walk Score: 32 / 100 Rank #609 / 985Walk Score — State benchmarkedThis home is ranked 609th out of 985 homes in Maryland. Shows how walkable this facility's neighborhood is compared to the average Walk Score across Maryland facilities. Higher scores benefit residents, families, and staff.Click the rank badge to see the full State ranking.Click here to see the full State ranking.
Somewhat walkable. A few nearby services may be reachable on foot, but most trips require transportation.
About this community
CountyPrince George's
State License TypesLevels I to III
Secured Perimeter
Emergency SystemsYes
Safety Features24-Hour security and emergency call system
Licensed Nurses/CNAs
Housekeeping
Wellness Program45 Day wellness assessment by licensed nurses, social, educational, recreational activities, plus low-impact & fun exercises program.
Food DescriptionCaregivers prepare healthy, tasty, and well-balanced meals, considering dietary restrictions and personal preferences.
Inspection History
In Maryland, the Department of Health, Office of Health Care Quality is the state agency that conducts unannounced inspections and issues reports for all assisted living and nursing facilities.
Inspection Scorecard
 This scorecard compares key inspection, citation, and complaint metrics at this facility against the Maryland state average. Metrics rated ≥15% worse than average are highlighted in red; those ≥15% better are highlighted in green.
Overall vs. MD average
0 Worse
No metrics in this bucket.
0 Better
No metrics in this bucket.
Citations
| This Facility | MD Average | vs. MD Avg |
|---|---|---|---|
|
Total citations
| 7 | — | — |
Demographics
Resident demographic information for this facility.
Gender
- Female 0%
- Male 0%
What does this home offer?
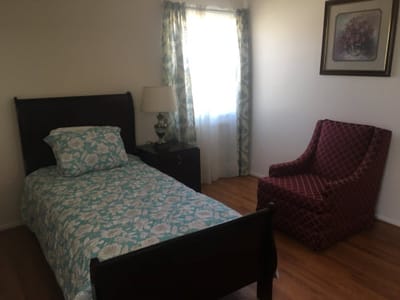
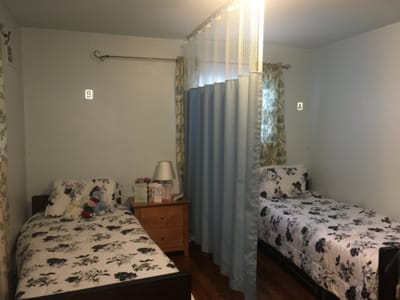
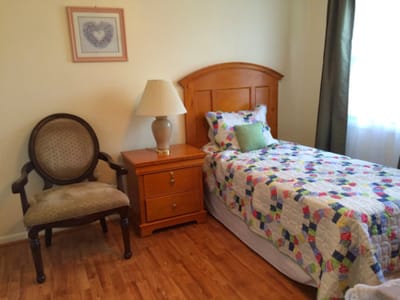
Housing Options: Private Rooms
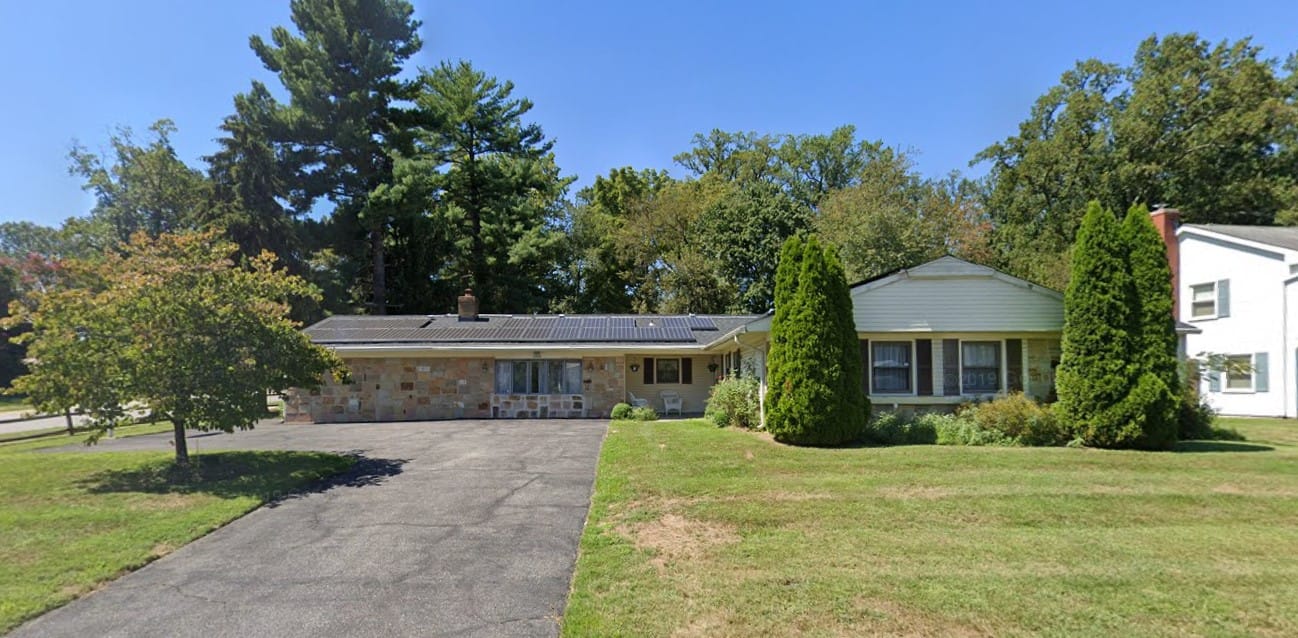
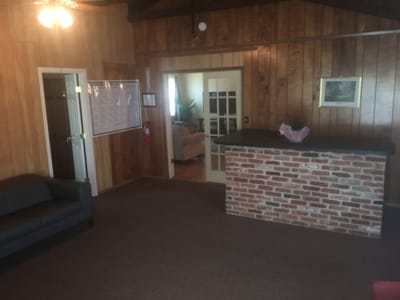
Building Type: Single-story
Places of interest near Ameristar Assisted Living, Inc. II
![]() 4.3 miles from city center
4.3 miles from city center
![]() Estimated distance in miles from Bowie's city center to Ameristar Assisted Living, Inc. II's address, calculated via Google Maps.
Estimated distance in miles from Bowie's city center to Ameristar Assisted Living, Inc. II's address, calculated via Google Maps.
Calculate Travel Distance to Ameristar Assisted Living, Inc. II
Add your location
Financial Assistance for
Assisted Living in Maryland
Ameristar Assisted Living, Inc. II is located in Bowie, Maryland.
Here are the financial assistance programs available to residents in Maryland.
Compare Assisted Living around Bowie
The information below is reported by the Maryland Department of Health, Office of Health Care Quality.
| Tribute at Melford |
AL Assisted Living A licensed, long-term care setting for seniors or individuals with disabilities who need help with daily activities — like bathing, dressing, and medication management — but not 24-hour skilled nursing. Offers housing, meals, and around-the-clock support while aiming to maximize resident independence.
MC Memory Care Secured, specialized care for people living with Alzheimer's or dementia. Staff trained in cognitive impairment, with higher staff-to-resident ratios and an environment designed to reduce confusion and wandering risk. | Bowie (Melford Boulevard) | 140
Facility
140
MD AVG
43
Rank
#52 / 697 | Yes |
17
Facility
17
MD AVG
43
Rank
#766 / 985 | Private Rooms | 5
Facility
5
MD AVG
21
Rank
#182 / 208 | - |
32% Male Residents — State Benchmarked 32% of residents are male, compared to the Maryland average of 31%. This facility caters to a majority female resident pool (68% female), consistent with the broader assisted living trend where women significantly outnumber men. |
68% Female Residents — State Benchmarked 68% of residents are female, compared to the Maryland average of 69%. Women comprise the large majority, consistent with national assisted living demographics where women live longer and enter care facilities at higher rates. |
24% White Residents — State Benchmarked 24% of residents are reported as White, compared to the Maryland average of 81%. A lower White share than the Maryland average — the community may draw a more diverse resident mix relative to other facilities in Maryland. |
58% African American Residents — State Benchmarked 58% of residents are reported as African American or Black, compared to the Maryland average of 13%. A higher African American share than the typical Maryland average — useful context when comparing cultural fit and community composition. |
18% Other Ethnicity Residents — State Benchmarked 18% of residents fall into categories other than White or African American (combined), compared to the Maryland average of 6%. This column aggregates Hispanic, Asian, multiracial, and any other labeled groups that are not classified as White or African American. Reported subgroups in this total: Mixed Race (10%), Asian (4%), Hispanic (4%). |
16% Residents Age 65–74 — State Benchmarked 16% of residents are 65–74, compared to the Maryland average of 13%. In line with the statewide profile for this youngest senior bracket in assisted living. |
26% Residents Age 75–84 — State Benchmarked 26% of residents are 75–84, compared to the Maryland average of 31%. Below the state norm — the resident mix may skew either younger or older than this typical middle bracket. |
36% Residents Age 85–94 — State Benchmarked 36% of residents are 85–94, compared to the Maryland average of 44%. The population here skews younger than the statewide norm, which may indicate a more active, lower-acuity community. |
18% Residents Age 95+ — State Benchmarked 18% of residents are 95 or older, compared to the Maryland average of 16%. In line with the statewide profile for the oldest resident bracket. |
| Brookdale Woodward Estates |
AL Assisted Living A licensed, long-term care setting for seniors or individuals with disabilities who need help with daily activities — like bathing, dressing, and medication management — but not 24-hour skilled nursing. Offers housing, meals, and around-the-clock support while aiming to maximize resident independence. | Bowie (Bowie Town Center) | 100
Facility
100
MD AVG
43
Rank
#117 / 697 | No |
27
Facility
27
MD AVG
43
Rank
#668 / 985 | Private Rooms | 27
Facility
27
MD AVG
21
Rank
#61 / 208 | - |
31% Male Residents — State Benchmarked 31% of residents are male, compared to the Maryland average of 31%. This facility caters to a majority female resident pool (69% female), consistent with the broader assisted living trend where women significantly outnumber men. |
69% Female Residents — State Benchmarked 69% of residents are female, compared to the Maryland average of 69%. Women comprise the large majority, consistent with national assisted living demographics where women live longer and enter care facilities at higher rates. |
29% White Residents — State Benchmarked 29% of residents are reported as White, compared to the Maryland average of 81%. A lower White share than the Maryland average — the community may draw a more diverse resident mix relative to other facilities in Maryland. |
69% African American Residents — State Benchmarked 69% of residents are reported as African American or Black, compared to the Maryland average of 13%. A higher African American share than the typical Maryland average — useful context when comparing cultural fit and community composition. |
2% Other Ethnicity Residents — State Benchmarked 2% of residents fall into categories other than White or African American (combined), compared to the Maryland average of 6%. This column aggregates Hispanic, Asian, multiracial, and any other labeled groups that are not classified as White or African American. Reported subgroups in this total: Asian (2%). |
10% Residents Age 65–74 — State Benchmarked 10% of residents are 65–74, compared to the Maryland average of 13%. Fewer younger seniors suggests the resident population skews older, likely requiring higher acuity care and more hands-on support. |
49% Residents Age 75–84 — State Benchmarked 49% of residents are 75–84, compared to the Maryland average of 31%. A high concentration in this mid-range bracket, where residents typically need moderate support with daily activities. |
33% Residents Age 85–94 — State Benchmarked 33% of residents are 85–94, compared to the Maryland average of 44%. The population here skews younger than the statewide norm, which may indicate a more active, lower-acuity community. |
6% Residents Age 95+ — State Benchmarked 6% of residents are 95 or older, compared to the Maryland average of 16%. Most residents here have not yet reached the oldest-old bracket, suggesting a younger overall community. |
| Arbor Terrace at Waugh Chapel |
AL Assisted Living A licensed, long-term care setting for seniors or individuals with disabilities who need help with daily activities — like bathing, dressing, and medication management — but not 24-hour skilled nursing. Offers housing, meals, and around-the-clock support while aiming to maximize resident independence.
MC Memory Care Secured, specialized care for people living with Alzheimer's or dementia. Staff trained in cognitive impairment, with higher staff-to-resident ratios and an environment designed to reduce confusion and wandering risk. | Gambrills (Waugh Chapel Towne Centre) | 96
Facility
96
MD AVG
43
Rank
#140 / 697 | No |
47
Facility
47
MD AVG
43
Rank
#459 / 985 | Private Rooms | 4
Facility
4
MD AVG
21
Rank
#191 / 208 | A+ |
30% Male Residents — State Benchmarked 30% of residents are male, compared to the Maryland average of 31%. This facility caters to a majority female resident pool (70% female), consistent with the broader assisted living trend where women significantly outnumber men. |
70% Female Residents — State Benchmarked 70% of residents are female, compared to the Maryland average of 69%. Women comprise the large majority, consistent with national assisted living demographics where women live longer and enter care facilities at higher rates. |
86% White Residents — State Benchmarked 86% of residents are reported as White, compared to the Maryland average of 81%. Close to the average for this category among assisted living facilities in Maryland with reported race/ethnicity data. |
12% African American Residents — State Benchmarked 12% of residents are reported as African American or Black, compared to the Maryland average of 13%. In line with the Maryland average for African American residents among facilities reporting this breakdown. |
3% Other Ethnicity Residents — State Benchmarked 3% of residents fall into categories other than White or African American (combined), compared to the Maryland average of 6%. This column aggregates Hispanic, Asian, multiracial, and any other labeled groups that are not classified as White or African American. Reported subgroups in this total: Asian (1%), Hawaiian/Pacific Islander (1%). |
10% Residents Age 65–74 — State Benchmarked 10% of residents are 65–74, compared to the Maryland average of 13%. Fewer younger seniors suggests the resident population skews older, likely requiring higher acuity care and more hands-on support. |
43% Residents Age 75–84 — State Benchmarked 43% of residents are 75–84, compared to the Maryland average of 31%. A high concentration in this mid-range bracket, where residents typically need moderate support with daily activities. |
39% Residents Age 85–94 — State Benchmarked 39% of residents are 85–94, compared to the Maryland average of 44%. This is typically the most common age bracket in assisted living — this facility is in line with the statewide norm. |
8% Residents Age 95+ — State Benchmarked 8% of residents are 95 or older, compared to the Maryland average of 16%. Most residents here have not yet reached the oldest-old bracket, suggesting a younger overall community. |
| Charter Senior Living of Bowie |
AL Assisted Living A licensed, long-term care setting for seniors or individuals with disabilities who need help with daily activities — like bathing, dressing, and medication management — but not 24-hour skilled nursing. Offers housing, meals, and around-the-clock support while aiming to maximize resident independence.
MC Memory Care Secured, specialized care for people living with Alzheimer's or dementia. Staff trained in cognitive impairment, with higher staff-to-resident ratios and an environment designed to reduce confusion and wandering risk. | Bowie (Laurel Bowie Road) | 52
Facility
52
MD AVG
43
Rank
#221 / 697 | No |
30
Facility
30
MD AVG
43
Rank
#627 / 985 | Private Rooms | 26
Facility
26
MD AVG
21
Rank
#77 / 208 | - |
21% Male Residents — State Benchmarked 21% of residents are male, compared to the Maryland average of 31%. This facility caters to a majority female resident pool (79% female), consistent with the broader assisted living trend where women significantly outnumber men. |
79% Female Residents — State Benchmarked 79% of residents are female, compared to the Maryland average of 69%. Women comprise the large majority, consistent with national assisted living demographics where women live longer and enter care facilities at higher rates. |
52% White Residents — State Benchmarked 52% of residents are reported as White, compared to the Maryland average of 81%. A lower White share than the Maryland average — the community may draw a more diverse resident mix relative to other facilities in Maryland. |
46% African American Residents — State Benchmarked 46% of residents are reported as African American or Black, compared to the Maryland average of 13%. A higher African American share than the typical Maryland average — useful context when comparing cultural fit and community composition. |
2% Other Ethnicity Residents — State Benchmarked 2% of residents fall into categories other than White or African American (combined), compared to the Maryland average of 6%. This column aggregates Hispanic, Asian, multiracial, and any other labeled groups that are not classified as White or African American. Reported subgroups in this total: American Indian (2%). | - | - |
83% Residents Age 85–94 — State Benchmarked 83% of residents are 85–94, compared to the Maryland average of 44%. A high concentration of very elderly residents signals a higher-acuity facility with experience caring for advanced age-related needs. |
17% Residents Age 95+ — State Benchmarked 17% of residents are 95 or older, compared to the Maryland average of 16%. In line with the statewide profile for the oldest resident bracket. |
| Ameristar Assisted Living, Inc. II |
AL Assisted Living A licensed, long-term care setting for seniors or individuals with disabilities who need help with daily activities — like bathing, dressing, and medication management — but not 24-hour skilled nursing. Offers housing, meals, and around-the-clock support while aiming to maximize resident independence.
HC Home Care Professional care delivered in the person's own home — from companionship and errands to skilled nursing and therapy. Allows seniors to age in place. Medicare covers skilled home health when medically necessary.
NC Nursing Care | Bowie | 5
Facility
5
MD AVG
43
Rank
#436 / 697 | No |
32
Facility
32
MD AVG
43
Rank
#609 / 985 | Private Rooms | - | - |
0% Male Residents — State Benchmarked 0% of residents are male, compared to the Maryland average of 31%. This facility caters to a majority female resident pool (100% female), consistent with the broader assisted living trend where women significantly outnumber men. |
0% Female Residents — State Benchmarked 0% of residents are female, compared to the Maryland average of 69%. An unusually low female share — most assisted living facilities have 65–75% female residents. | - | - | - | - | - | - | - |
More homes from the same operator
Operated by
Ameristar Assisted Living
Frequently Asked Questions about Ameristar Assisted Living, Inc. II
Is Ameristar Assisted Living, Inc. II in a walkable area?
Ameristar Assisted Living, Inc. II has a walk score of 32. Somewhat walkable. A few nearby services may be reachable on foot, but most trips require transportation.
How many beds does Ameristar Assisted Living, Inc. II have?
Ameristar Assisted Living, Inc. II has 5 beds.
Has Ameristar Assisted Living, Inc. II had any recent deficiencies or citations?
Ameristar Assisted Living, Inc. II has had 7 recently reported deficiencies.
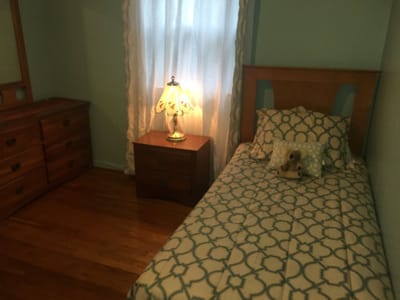
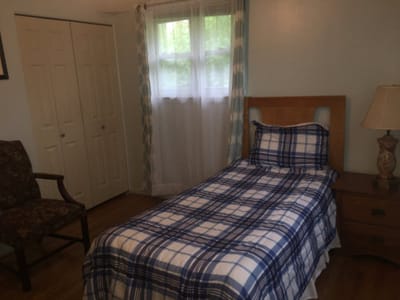
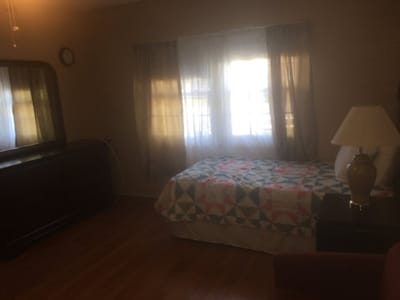
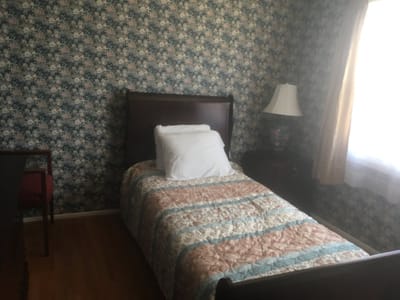
Are there photos of Ameristar Assisted Living, Inc. II?
Yes — there are 62 photos of Ameristar Assisted Living, Inc. II in the photo gallery on this page.
What is the address of Ameristar Assisted Living, Inc. II?
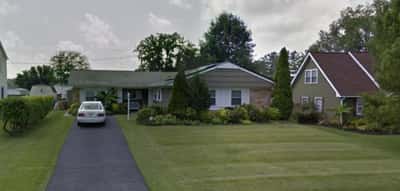
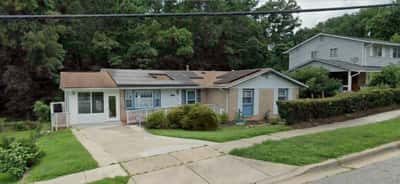
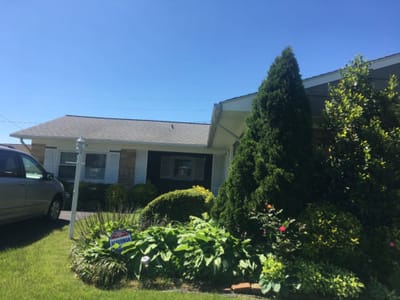
Ameristar Assisted Living, Inc. II is located at 2900 Tarragon Ln, Bowie, MD 20715, USA.
What is the phone number of Ameristar Assisted Living, Inc. II?
(301) 464-8069 will put you in contact with the team at Ameristar Assisted Living, Inc. II.
What county is Ameristar Assisted Living, Inc. II located in?
Ameristar Assisted Living, Inc. II is in Prince George's County.
Guides for Better Senior Living
Care Cost Calculator: See Prices in Your Area
Nursing Home Data Explorer
Don’t Wait Too Long: 7 Red Flag Signs Your Parent Needs Assisted Living Now
The True Cost of Assisted Living in 2025 – And How Families Are Paying For It
Understanding Senior Living Costs: Pricing Models, Discounts & Financial Assistance
Contact Us

Updated on
Feedback
Write a review for Ameristar Assisted Living, Inc. II
Rate your overall experience with this community
Explore Open Rooms
1
Contact details
2
What type of senior care service are you looking for?
3
What budget do you have in mind for senior care?
4
How soon do you need to find care?
5
Additional details
Thank you for your interest!
Our team will be in touch shortly to help with next steps.
Need Help?
Let us help you or a loved one find the perfect senior home.
