


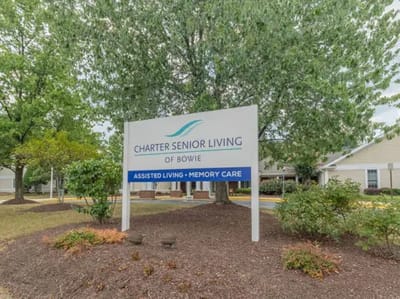
Charter Senior Living of Bowie
Assisted Living & Memory Care · Bowie, MD

Charter Senior Living of Bowie
Assisted Living & Memory Care · Bowie, MD
Overview of Charter Senior Living of Bowie
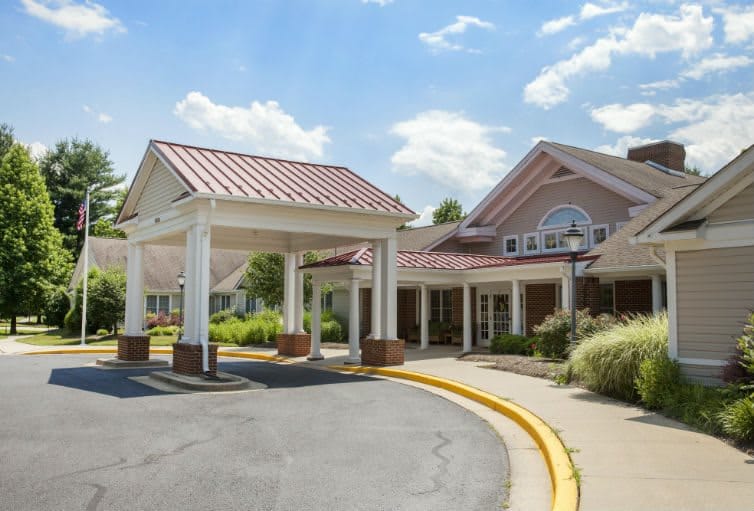
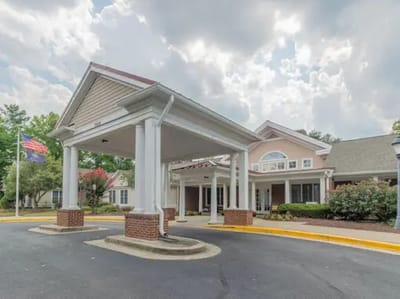
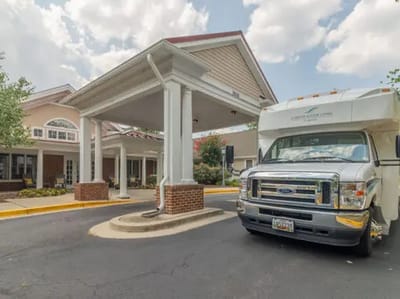
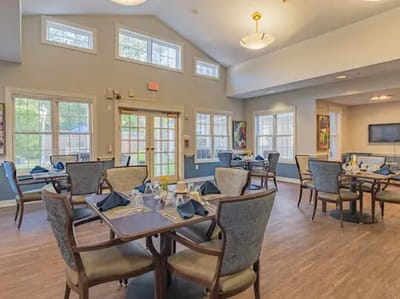
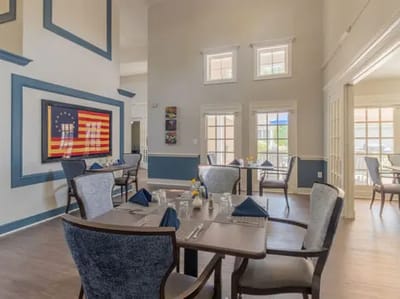
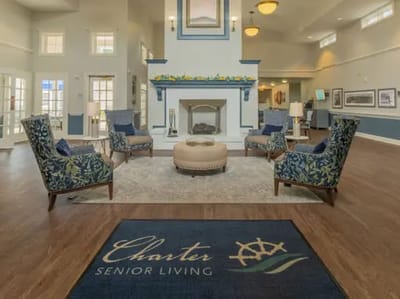
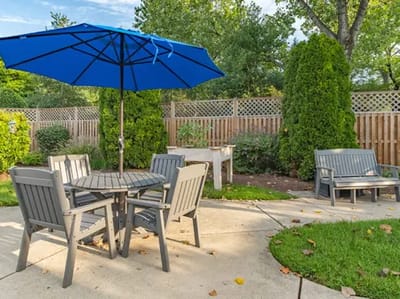
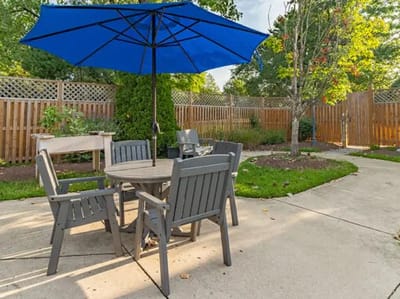
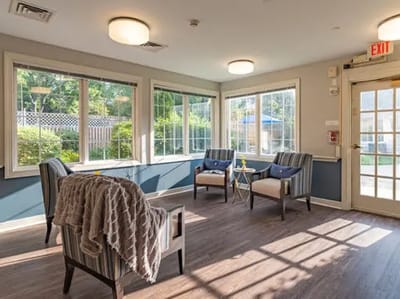
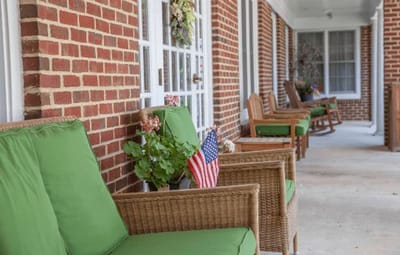
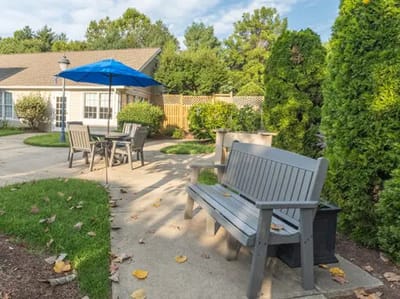
Situated in the heart of Maryland, Charter Senior Living of Bowie is more than just a senior living community. This distinguished facility offers an array of assisted living and memory care services, providing seniors with a supportive environment where they can thrive. Beyond the traditional, Charter Senior Living of Bowie goes the extra mile by offering specialized memory care benefits that cater to the unique needs of residents with cognitive challenges. With a team that has undergone extensive memory care training, the community ensures that every individual receives the utmost care, support, and understanding they deserve.
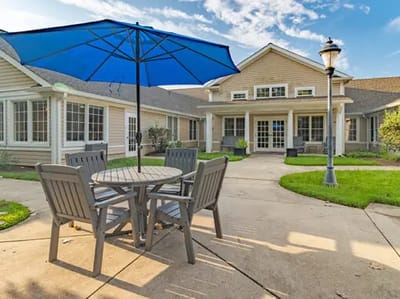
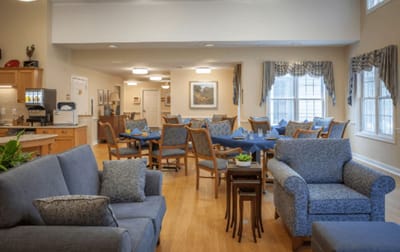
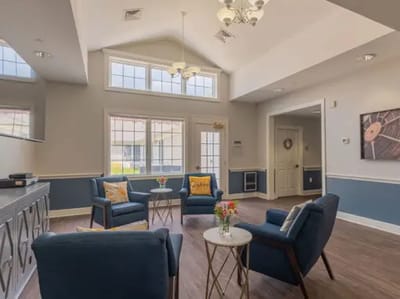
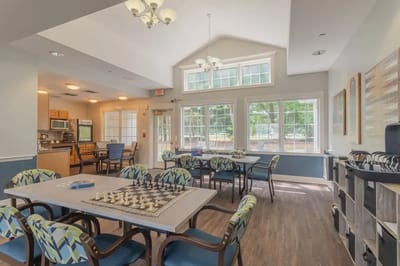
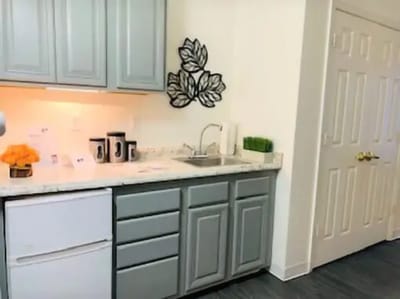
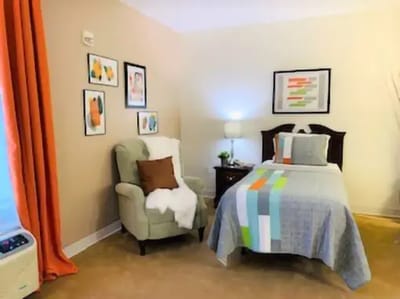
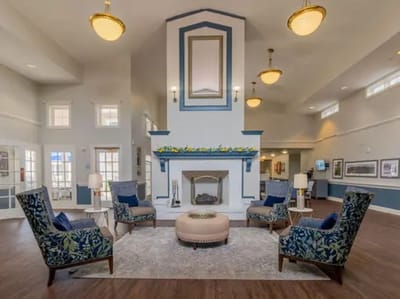
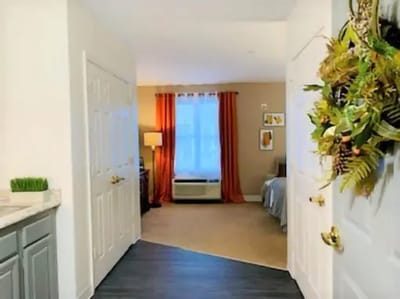
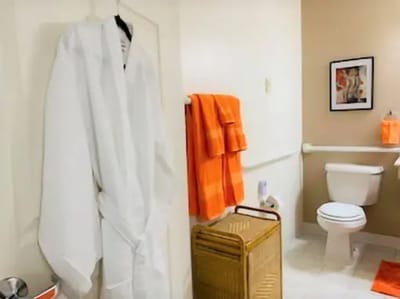
The charm of Charter Senior Living of Bowie extends to its thoughtfully designed assisted living apartments. Residents have the freedom to choose from various floor plans, including suites and one- or two-bedroom layouts, allowing them to create a space that truly feels like home. In addition to its commitment to personalized care, the community’s emphasis on enriching activities, engaging amenities, and a warm and welcoming atmosphere sets the stage for a fulfilling senior living experience. At Charter Senior Living of Bowie, seniors find not just a place to live, but a community that values their well-being, fosters connections, and ensures that every day is filled with comfort, dignity, and purpose.
52-bed community Rank #221 / 697Bed count — State benchmarkedThis home is ranked 221st out of 697 homes in Maryland. Shows this facility's certified or reported bed count compared to other Maryland facilities. Larger communities may offer more amenities, programs, and on-site services for residents and families.Click the rank badge to see the full State ranking.Click here to see the full State ranking.
A moderately sized community that may balance personal attention with shared amenities and social activities.
26 years in operation Rank #77 / 208Years in operation — State benchmarkedThis home is ranked 77th out of 208 homes in Maryland. Shows how long this facility has been in operation compared to other Maryland facilities. Longer operating histories may benefit residents, families, and staff.Click the rank badge to see the full State ranking.Click here to see the full State ranking.
A longer operating history, which may indicate experience navigating regulations and delivering ongoing care.
Walk Score: 30 / 100 Rank #627 / 985Walk Score — State benchmarkedThis home is ranked 627th out of 985 homes in Maryland. Shows how walkable this facility's neighborhood is compared to the average Walk Score across Maryland facilities. Higher scores benefit residents, families, and staff.Click the rank badge to see the full State ranking.Click here to see the full State ranking.
Somewhat walkable. A few nearby services may be reachable on foot, but most trips require transportation.
About this community
Facility TypeAl
CountyPrince George's
Profit StatusTrue
Private Room
$203 - $230 per day
Semi-Private Room
$145 - $199 per day
Wheelchair Accessible
Emergency SystemsYes
Hospice Affiliations
Staffing
Key information about the people who lead and staff this community.
No CNA training program
Rehabilitation Services
Respite Care
Nursing Services
24-Hour Staffing
Dedicated Alzheimer's Unit
Mild Alzheimer's Level
Moderate Alzheimer's Level
Severe Alzheimer's Level
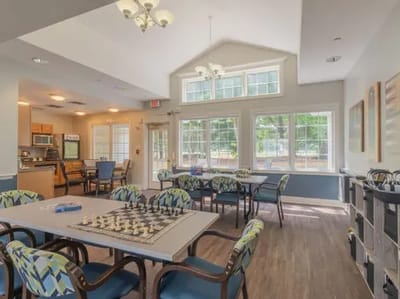
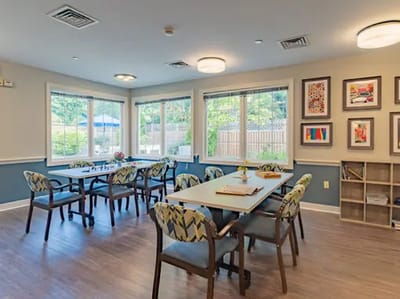
ActivitiesResidents enjoy vibrant life-enrichment programs that offer countless choices and opportunities to live a full, connected life.
Specific ProgramsFlourish℠ Programming, Short-Term Stays
Operating HoursVisitors are welcome 24 hours a day, 7 days a week.
AL$6,595 per month
MC$6,695 per month
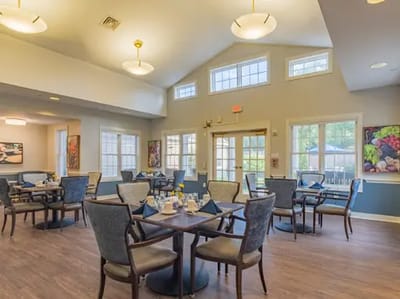
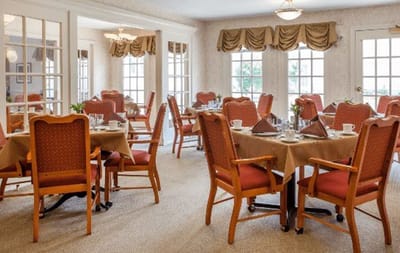
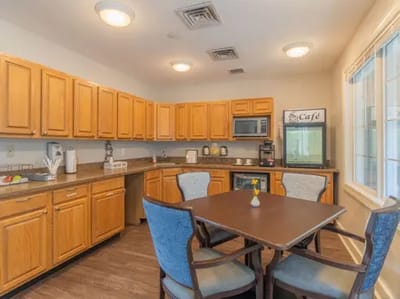
Food DescriptionResidents enjoy three daily meals featuring restaurant-style dishes designed to meet their individual tastes and preferences.
Demographics
Resident demographic information for this facility.
Gender
- Female 79.2%
- Male 20.8%
Age Distribution
- 85-94 83.3%
- 95+ 16.7%
Ethnicity
- White 52.1%
- African American 45.8%
- American Indian 2.1%
What does this home offer?
Housing Options: Studio / 1 Bed / 2 Bed
Building Type: Single-story
Transportation Services
Fitness and Recreation
Murriah Duncan serves as the Executive Director at Charter Senior Living of Bowie, leading the community with a commitment to providing high-quality lifestyles for seniors and their families. She is dedicated to supporting residents with heart, purpose, courage, and fun, ensuring a warm and caring environment every day.
Living Spaces & Floor Plans for Charter Senior Living of Bowie
Assisted Living Calendar
Download PDFMemory Care Calendar
Download PDFPlaces of interest near Charter Senior Living of Bowie
![]() 1.9 miles from city center
1.9 miles from city center
![]() Estimated distance in miles from Bowie's city center to Charter Senior Living of Bowie's address, calculated via Google Maps.
— 9.07 miles to nearest hospital (UM Laurel Medical Center)
Estimated distance in miles from Bowie's city center to Charter Senior Living of Bowie's address, calculated via Google Maps.
— 9.07 miles to nearest hospital (UM Laurel Medical Center)
Calculate Travel Distance to Charter Senior Living of Bowie
Add your location
Financial Assistance for
Assisted Living in Maryland
Charter Senior Living of Bowie is located in Bowie, Maryland.
Here are the financial assistance programs available to residents in Maryland.
Compare Assisted Living around Bowie
The information below is reported by the Maryland Department of Health, Office of Health Care Quality.
| Tribute at Melford |
AL Assisted Living A licensed, long-term care setting for seniors or individuals with disabilities who need help with daily activities — like bathing, dressing, and medication management — but not 24-hour skilled nursing. Offers housing, meals, and around-the-clock support while aiming to maximize resident independence.
MC Memory Care Secured, specialized care for people living with Alzheimer's or dementia. Staff trained in cognitive impairment, with higher staff-to-resident ratios and an environment designed to reduce confusion and wandering risk. | Bowie (Melford Boulevard) | 140
Facility
140
MD AVG
43
Rank
#52 / 697 | Yes |
17
Facility
17
MD AVG
43
Rank
#766 / 985 | Studio / 1 Bed / 2 Bed | 5
Facility
5
MD AVG
21
Rank
#182 / 208 | - |
32% Male Residents — State Benchmarked 32% of residents are male, compared to the Maryland average of 31%. This facility caters to a majority female resident pool (68% female), consistent with the broader assisted living trend where women significantly outnumber men. |
68% Female Residents — State Benchmarked 68% of residents are female, compared to the Maryland average of 69%. Women comprise the large majority, consistent with national assisted living demographics where women live longer and enter care facilities at higher rates. |
24% White Residents — State Benchmarked 24% of residents are reported as White, compared to the Maryland average of 81%. A lower White share than the Maryland average — the community may draw a more diverse resident mix relative to other facilities in Maryland. |
58% African American Residents — State Benchmarked 58% of residents are reported as African American or Black, compared to the Maryland average of 13%. A higher African American share than the typical Maryland average — useful context when comparing cultural fit and community composition. |
18% Other Ethnicity Residents — State Benchmarked 18% of residents fall into categories other than White or African American (combined), compared to the Maryland average of 6%. This column aggregates Hispanic, Asian, multiracial, and any other labeled groups that are not classified as White or African American. Reported subgroups in this total: Mixed Race (10%), Asian (4%), Hispanic (4%). |
16% Residents Age 65–74 — State Benchmarked 16% of residents are 65–74, compared to the Maryland average of 13%. In line with the statewide profile for this youngest senior bracket in assisted living. |
26% Residents Age 75–84 — State Benchmarked 26% of residents are 75–84, compared to the Maryland average of 31%. Below the state norm — the resident mix may skew either younger or older than this typical middle bracket. |
36% Residents Age 85–94 — State Benchmarked 36% of residents are 85–94, compared to the Maryland average of 44%. The population here skews younger than the statewide norm, which may indicate a more active, lower-acuity community. |
18% Residents Age 95+ — State Benchmarked 18% of residents are 95 or older, compared to the Maryland average of 16%. In line with the statewide profile for the oldest resident bracket. |
| Brookdale Woodward Estates |
AL Assisted Living A licensed, long-term care setting for seniors or individuals with disabilities who need help with daily activities — like bathing, dressing, and medication management — but not 24-hour skilled nursing. Offers housing, meals, and around-the-clock support while aiming to maximize resident independence. | Bowie (Bowie Town Center) | 100
Facility
100
MD AVG
43
Rank
#117 / 697 | No |
27
Facility
27
MD AVG
43
Rank
#668 / 985 | Studio / 1 Bed / 2 Bed | 27
Facility
27
MD AVG
21
Rank
#61 / 208 | - |
31% Male Residents — State Benchmarked 31% of residents are male, compared to the Maryland average of 31%. This facility caters to a majority female resident pool (69% female), consistent with the broader assisted living trend where women significantly outnumber men. |
69% Female Residents — State Benchmarked 69% of residents are female, compared to the Maryland average of 69%. Women comprise the large majority, consistent with national assisted living demographics where women live longer and enter care facilities at higher rates. |
29% White Residents — State Benchmarked 29% of residents are reported as White, compared to the Maryland average of 81%. A lower White share than the Maryland average — the community may draw a more diverse resident mix relative to other facilities in Maryland. |
69% African American Residents — State Benchmarked 69% of residents are reported as African American or Black, compared to the Maryland average of 13%. A higher African American share than the typical Maryland average — useful context when comparing cultural fit and community composition. |
2% Other Ethnicity Residents — State Benchmarked 2% of residents fall into categories other than White or African American (combined), compared to the Maryland average of 6%. This column aggregates Hispanic, Asian, multiracial, and any other labeled groups that are not classified as White or African American. Reported subgroups in this total: Asian (2%). |
10% Residents Age 65–74 — State Benchmarked 10% of residents are 65–74, compared to the Maryland average of 13%. Fewer younger seniors suggests the resident population skews older, likely requiring higher acuity care and more hands-on support. |
49% Residents Age 75–84 — State Benchmarked 49% of residents are 75–84, compared to the Maryland average of 31%. A high concentration in this mid-range bracket, where residents typically need moderate support with daily activities. |
33% Residents Age 85–94 — State Benchmarked 33% of residents are 85–94, compared to the Maryland average of 44%. The population here skews younger than the statewide norm, which may indicate a more active, lower-acuity community. |
6% Residents Age 95+ — State Benchmarked 6% of residents are 95 or older, compared to the Maryland average of 16%. Most residents here have not yet reached the oldest-old bracket, suggesting a younger overall community. |
| Arbor Terrace at Waugh Chapel |
AL Assisted Living A licensed, long-term care setting for seniors or individuals with disabilities who need help with daily activities — like bathing, dressing, and medication management — but not 24-hour skilled nursing. Offers housing, meals, and around-the-clock support while aiming to maximize resident independence.
MC Memory Care Secured, specialized care for people living with Alzheimer's or dementia. Staff trained in cognitive impairment, with higher staff-to-resident ratios and an environment designed to reduce confusion and wandering risk. | Gambrills (Waugh Chapel Towne Centre) | 96
Facility
96
MD AVG
43
Rank
#140 / 697 | No |
47
Facility
47
MD AVG
43
Rank
#459 / 985 | Studio / 1 Bed / 2 Bed | 4
Facility
4
MD AVG
21
Rank
#191 / 208 | A+ |
30% Male Residents — State Benchmarked 30% of residents are male, compared to the Maryland average of 31%. This facility caters to a majority female resident pool (70% female), consistent with the broader assisted living trend where women significantly outnumber men. |
70% Female Residents — State Benchmarked 70% of residents are female, compared to the Maryland average of 69%. Women comprise the large majority, consistent with national assisted living demographics where women live longer and enter care facilities at higher rates. |
86% White Residents — State Benchmarked 86% of residents are reported as White, compared to the Maryland average of 81%. Close to the average for this category among assisted living facilities in Maryland with reported race/ethnicity data. |
12% African American Residents — State Benchmarked 12% of residents are reported as African American or Black, compared to the Maryland average of 13%. In line with the Maryland average for African American residents among facilities reporting this breakdown. |
3% Other Ethnicity Residents — State Benchmarked 3% of residents fall into categories other than White or African American (combined), compared to the Maryland average of 6%. This column aggregates Hispanic, Asian, multiracial, and any other labeled groups that are not classified as White or African American. Reported subgroups in this total: Asian (1%), Hawaiian/Pacific Islander (1%). |
10% Residents Age 65–74 — State Benchmarked 10% of residents are 65–74, compared to the Maryland average of 13%. Fewer younger seniors suggests the resident population skews older, likely requiring higher acuity care and more hands-on support. |
43% Residents Age 75–84 — State Benchmarked 43% of residents are 75–84, compared to the Maryland average of 31%. A high concentration in this mid-range bracket, where residents typically need moderate support with daily activities. |
39% Residents Age 85–94 — State Benchmarked 39% of residents are 85–94, compared to the Maryland average of 44%. This is typically the most common age bracket in assisted living — this facility is in line with the statewide norm. |
8% Residents Age 95+ — State Benchmarked 8% of residents are 95 or older, compared to the Maryland average of 16%. Most residents here have not yet reached the oldest-old bracket, suggesting a younger overall community. |
| Charter Senior Living of Bowie |
AL Assisted Living A licensed, long-term care setting for seniors or individuals with disabilities who need help with daily activities — like bathing, dressing, and medication management — but not 24-hour skilled nursing. Offers housing, meals, and around-the-clock support while aiming to maximize resident independence.
MC Memory Care Secured, specialized care for people living with Alzheimer's or dementia. Staff trained in cognitive impairment, with higher staff-to-resident ratios and an environment designed to reduce confusion and wandering risk. | Bowie (Laurel Bowie Road) | 52
Facility
52
MD AVG
43
Rank
#221 / 697 | No |
30
Facility
30
MD AVG
43
Rank
#627 / 985 | Studio / 1 Bed / 2 Bed | 26
Facility
26
MD AVG
21
Rank
#77 / 208 | - |
21% Male Residents — State Benchmarked 21% of residents are male, compared to the Maryland average of 31%. This facility caters to a majority female resident pool (79% female), consistent with the broader assisted living trend where women significantly outnumber men. |
79% Female Residents — State Benchmarked 79% of residents are female, compared to the Maryland average of 69%. Women comprise the large majority, consistent with national assisted living demographics where women live longer and enter care facilities at higher rates. |
52% White Residents — State Benchmarked 52% of residents are reported as White, compared to the Maryland average of 81%. A lower White share than the Maryland average — the community may draw a more diverse resident mix relative to other facilities in Maryland. |
46% African American Residents — State Benchmarked 46% of residents are reported as African American or Black, compared to the Maryland average of 13%. A higher African American share than the typical Maryland average — useful context when comparing cultural fit and community composition. |
2% Other Ethnicity Residents — State Benchmarked 2% of residents fall into categories other than White or African American (combined), compared to the Maryland average of 6%. This column aggregates Hispanic, Asian, multiracial, and any other labeled groups that are not classified as White or African American. Reported subgroups in this total: American Indian (2%). | - | - |
83% Residents Age 85–94 — State Benchmarked 83% of residents are 85–94, compared to the Maryland average of 44%. A high concentration of very elderly residents signals a higher-acuity facility with experience caring for advanced age-related needs. |
17% Residents Age 95+ — State Benchmarked 17% of residents are 95 or older, compared to the Maryland average of 16%. In line with the statewide profile for the oldest resident bracket. |
| Arcadia of Crofton II |
AL Assisted Living A licensed, long-term care setting for seniors or individuals with disabilities who need help with daily activities — like bathing, dressing, and medication management — but not 24-hour skilled nursing. Offers housing, meals, and around-the-clock support while aiming to maximize resident independence.
MC Memory Care Secured, specialized care for people living with Alzheimer's or dementia. Staff trained in cognitive impairment, with higher staff-to-resident ratios and an environment designed to reduce confusion and wandering risk. | Gambrills | 16
Facility
16
MD AVG
43
Rank
#260 / 697 | No |
21
Facility
21
MD AVG
43
Rank
#731 / 985 | Studio / 1 Bed / 2 Bed | 4
Facility
4
MD AVG
21
Rank
#191 / 208 | - |
36% Male Residents — State Benchmarked 36% of residents are male, compared to the Maryland average of 31%. This facility caters to a majority female resident pool (64% female), consistent with the broader assisted living trend where women significantly outnumber men. |
64% Female Residents — State Benchmarked 64% of residents are female, compared to the Maryland average of 69%. Closer to an even gender split than most assisted living facilities, which typically have 65–75% female residents. |
100% White Residents — State Benchmarked 100% of residents are reported as White, compared to the Maryland average of 81%. A higher White share than is typical for assisted living in Maryland in this dataset — compare with peer facilities for local context. |
0% African American Residents — State Benchmarked 0% of residents are reported as African American or Black, compared to the Maryland average of 13%. A lower African American share than is typical in Maryland; local markets still vary widely. |
0% Other Ethnicity Residents — State Benchmarked 0% of residents fall into categories other than White or African American (combined), compared to the Maryland average of 6%. This column aggregates Hispanic, Asian, multiracial, and any other labeled groups that are not classified as White or African American. |
7% Residents Age 65–74 — State Benchmarked 7% of residents are 65–74, compared to the Maryland average of 13%. Fewer younger seniors suggests the resident population skews older, likely requiring higher acuity care and more hands-on support. |
36% Residents Age 75–84 — State Benchmarked 36% of residents are 75–84, compared to the Maryland average of 31%. This is the second most common age bracket in assisted living, representing residents with moderate care needs. |
29% Residents Age 85–94 — State Benchmarked 29% of residents are 85–94, compared to the Maryland average of 44%. The population here skews younger than the statewide norm, which may indicate a more active, lower-acuity community. |
29% Residents Age 95+ — State Benchmarked 29% of residents are 95 or older, compared to the Maryland average of 16%. A high proportion of the oldest-old suggests strong end-of-life care experience and very-high-acuity capabilities. |
Frequently Asked Questions about Charter Senior Living of Bowie
What neighborhood is Charter Senior Living of Bowie in?
Charter Senior Living of Bowie is in the Laurel Bowie Road neighborhood of Bowie.
Is Charter Senior Living of Bowie in a walkable area?
Charter Senior Living of Bowie has a walk score of 30. Somewhat walkable. A few nearby services may be reachable on foot, but most trips require transportation.
Does Charter Senior Living of Bowie have different floorplan options?
Yes — see the floorplan options available at Charter Senior Living of Bowie on this page.
How many beds does Charter Senior Living of Bowie have?
Charter Senior Living of Bowie has 52 beds.
Are there photos of Charter Senior Living of Bowie?
Yes — there are 34 photos of Charter Senior Living of Bowie in the photo gallery on this page.
What is the phone number of Charter Senior Living of Bowie?
(301) 200-0712 will put you in contact with the team at Charter Senior Living of Bowie.
What county is Charter Senior Living of Bowie located in?
Charter Senior Living of Bowie is in Prince George's County.
Guides for Better Senior Living
Care Cost Calculator: See Prices in Your Area
Nursing Home Data Explorer
Don’t Wait Too Long: 7 Red Flag Signs Your Parent Needs Assisted Living Now
The True Cost of Assisted Living in 2025 – And How Families Are Paying For It
Understanding Senior Living Costs: Pricing Models, Discounts & Financial Assistance
Contact Us

Published on
Updated on
Feedback
Write a review for Charter Senior Living of Bowie
Rate your overall experience with this community
Explore Open Rooms
1
Contact details
2
What type of senior care service are you looking for?
3
What budget do you have in mind for senior care?
4
How soon do you need to find care?
5
Additional details
Thank you for your interest!
Our team will be in touch shortly to help with next steps.
Need Help?
Let us help you or a loved one find the perfect senior home.
