


Occupancy rate
100%
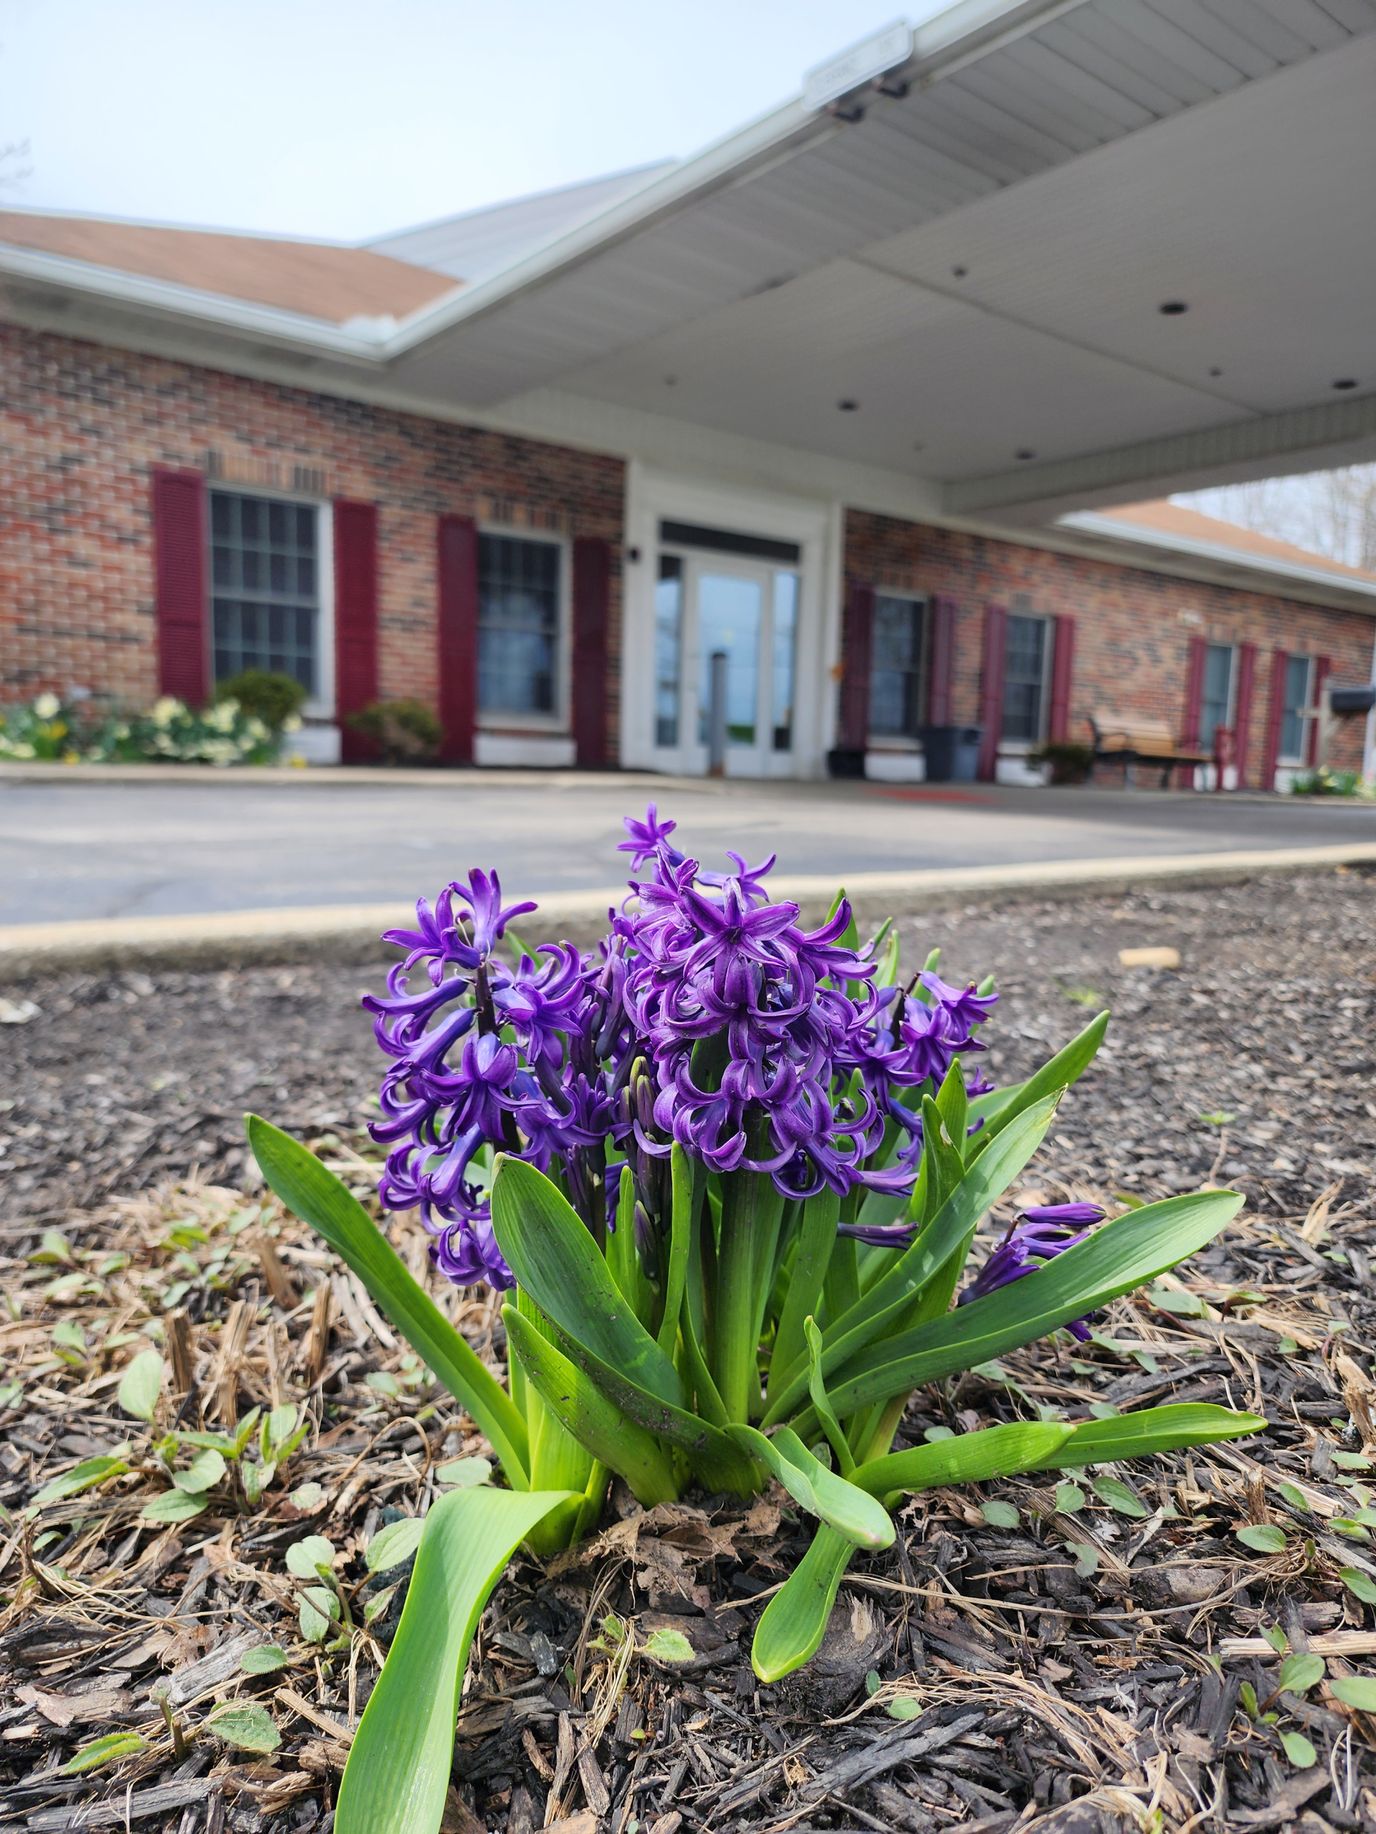


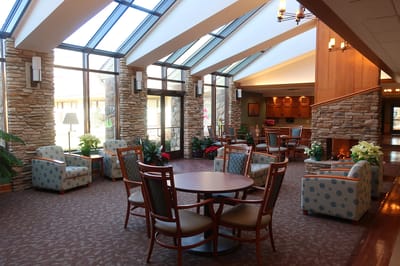


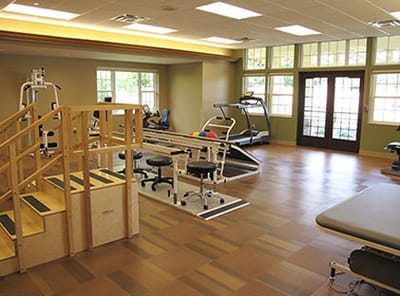


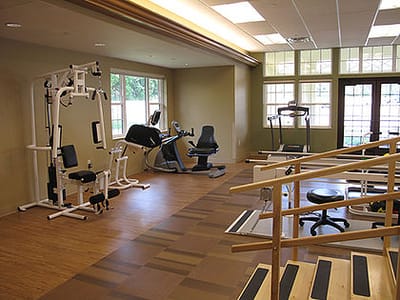


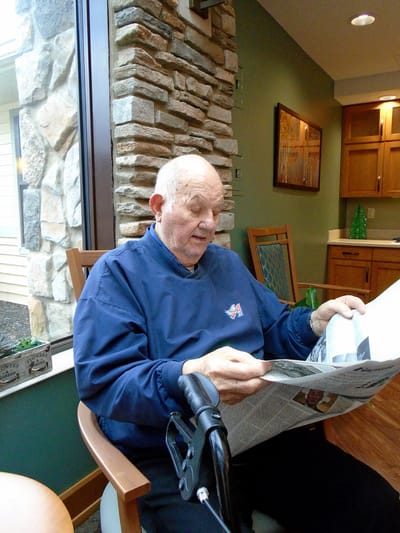


At 889 North Aurora Road in Aurora, Ohio, Anna Maria of Aurora, Inc. runs a 43-bed skilled nursing facility in Portage County’s urban setting. Norton Bros. Holding Company holds the operating entity. Aaron Baker is administrator; Patricia Williams is Director of Nursing. The care model reaches across post-acute rehabilitation, short-term skilled nursing, memory care, assisted living, home care, and respite care.
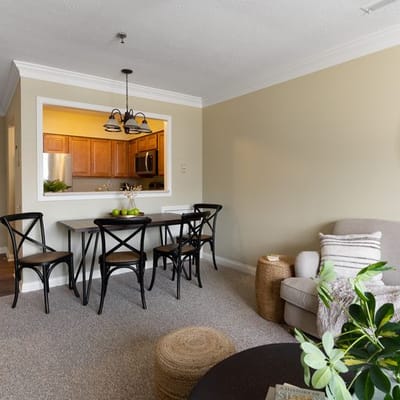
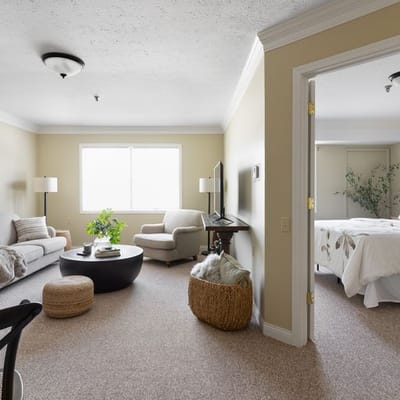
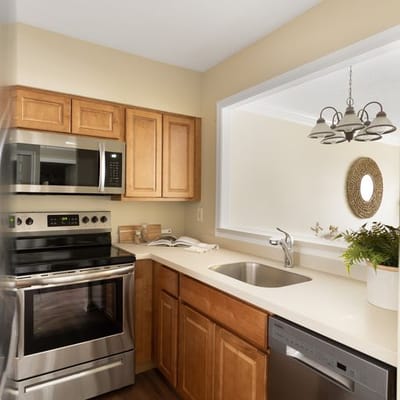
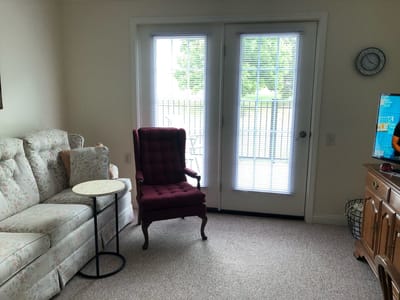
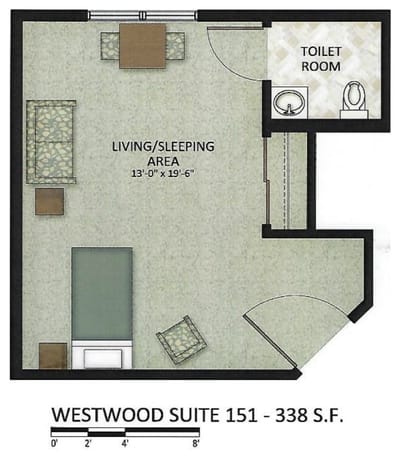
All 43 beds are occupied, and what’s notable is how the admission pattern is shaped by post-acute transitions: the facility functions primarily as a short-stay destination for people coming out of a hospital and working their way back home. Studio, one-bedroom, and two-bedroom housing configurations are available for residents with a range of space and care needs.
Staffing runs around the clock and coverage is continuous, with total nursing care coming in at 3 hours 47 minutes per resident per day. Nurse aides, who carry the daily load of personal care, account for 2 hours and 50 minutes of that figure. Registered nurses are reported at 31 minutes per resident per day; licensed practical nurses at 1 hour and 1 minute.
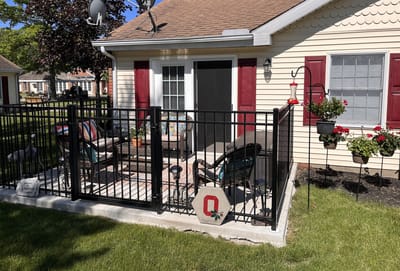
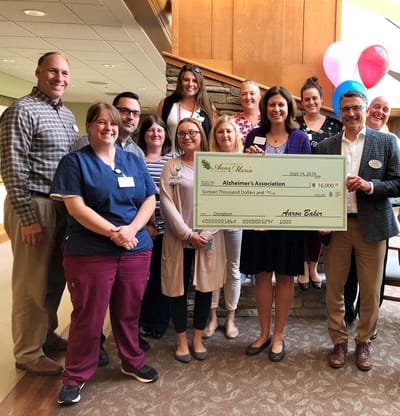
The facility accepts Medicare, Medicaid, and private pay. Aurora’s moderately walkable neighborhood (Walk Score 64) lets visiting families handle some errands on foot, though the area favors drivers overall. The campus runs a Volunteer Opportunities program and an annual Charity Car Show alongside its clinical operations. Home care is also available for residents moving back toward independent living.
Anna Maria of Aurora, Inc. is structured around short-stay skilled nursing and post-acute rehab, with real capacity in memory care, assisted living, and home-based services for residents whose needs shift or extend. Full occupancy and broad payer acceptance reflect steady, consistent demand for what this facility actually does.
| Staff type | Hours / Day / Resident | vs state avg |
|---|---|---|
|
Registered Nurse (RN)
| 31m per day | ▼ 19% State avg: 38m per day · National avg: 41m per day |
|
LPN / LVN
| 1h 1m per day | ▲ 5% State avg: 58m per day · National avg: 52m per day |
|
Nurse Aide
| 2h 50m per day | ▲ 33% State avg: 2h 8m per day · National avg: 2h 20m per day |
|
Weekend Total Nursing
| 3h 54m per day | ▲ 19% State avg: 3h 17m per day · National avg: 3h 26m per day |
|
Physical Therapist
| 6m per day | ▲ 90% State avg: 3m per day · National avg: 4m per day |
|
Weekend RN
| 27m per day | ▲ 7% State avg: 25m per day · National avg: 28m per day |
Anna Maria of Aurora, Inc. is administered by Aaron Baker.
Key information about the people who lead and staff this community.
In Ohio, the Department of Health, Bureau of Survey and Certification conducts unannounced onsite inspections to evaluate the quality of care and environment in all licensed facilities.
Citations
| This Facility | OH Average | vs. OH Avg |
|---|---|---|---|
|
Total citations
| 0 | 2 | This facility has 100% fewer total citations than a typical Ohio nursing home (0 vs. OH avg 2).↓ 100% better |
State average 6.7
Last Health inspection on Dec 2024
State average 30.9
State average 4.59
Health citations are formal notices following inspections when they fail to comply with safety and care standards.
5 of 7 citations resulted from standard inspections; and 2 of 7 resulted from complaint investigations.
State average: 0.3
State average: 0.9
Reporting period: October 1 – December 31, 2025 (Q4 2025). Source: CMS Payroll-Based Journal report.
Manages medical care and health needs.
Assists with medical care and medications.
Helps with daily care and mobility.
Total hours from contractors
7,975 contractor hours this quarter
| Certified Nursing Assistant | 65 | 147 | 212 | 23,561 | 92 | 100% | 8.1 |
| Licensed Practical Nurse | 21 | 34 | 55 | 7,055 | 92 | 100% | 8.7 |
| Registered Nurse | 11 | 14 | 25 | 2,553 | 91 | 99% | 9.3 |
| Speech Language Pathologist | 0 | 8 | 8 | 1,622 | 76 | 83% | 6.2 |
| RN Director of Nursing | 3 | 0 | 3 | 1,364 | 67 | 73% | 8 |
| Clinical Nurse Specialist | 3 | 0 | 3 | 1,209 | 65 | 71% | 8.2 |
| Other Dietary Services Staff | 5 | 0 | 5 | 1,085 | 85 | 92% | 7.3 |
| Dental Services Staff | 2 | 0 | 2 | 973 | 69 | 75% | 8.1 |
| Physical Therapy Assistant | 0 | 3 | 3 | 909 | 79 | 86% | 7 |
| Respiratory Therapy Technician | 0 | 5 | 5 | 791 | 76 | 83% | 5.9 |
| Qualified Social Worker | 0 | 4 | 4 | 623 | 67 | 73% | 5.1 |
| Physical Therapy Aide | 0 | 5 | 5 | 563 | 74 | 80% | 5 |
| Dietitian | 1 | 0 | 1 | 523 | 65 | 71% | 8 |
| Administrator | 1 | 0 | 1 | 512 | 64 | 70% | 8 |
| Therapeutic Recreation Specialist | 0 | 1 | 1 | 480 | 60 | 65% | 8 |
| Nurse Practitioner | 1 | 0 | 1 | 472 | 59 | 64% | 8 |
| Occupational Therapy Aide | 1 | 0 | 1 | 282 | 50 | 54% | 5.6 |
| Occupational Therapy Assistant | 0 | 1 | 1 | 26 | 3 | 3% | 8.7 |
| Medical Director | 0 | 1 | 1 | 15 | 3 | 3% | 5 |
Federal penalties imposed by CMS for regulatory violations, including civil money penalties (fines) and denials of payment for new Medicare/Medicaid admissions.
Source: CMS Penalties Database
No penalties in the past 3 years
No civil money penalties or payment denials were reported in the last 3 years.
These measures show how residents usually do over time at this home, based on health outcomes and preventive care.
Ohio average: 5.8
Ohio average: 12.7
Ohio average: 6.8%
Ohio average: 8.9%
Ohio average: 22.0%
Ohio average: 3.4%
Ohio average: 3.9%
Ohio average: 0.5%
Ohio average: 6.2%
Ohio average: 24.0%
Ohio average: 8.4%
Ohio average: 92.4%
Ohio average: 94.5%
Ohio average: 1.77
Ohio average: 1.83
Ohio average: 78.0%
Ohio average: 1.3%
Ohio average: 75.6%
Ohio average: 25.1%
Ohio average: 12.5%
Ohio average: 0.8%
Ohio average: 53.7%
Ohio average: 50.6%
Quality measures are calculated from Minimum Data Set (MDS) assessments. For most measures, lower percentages indicate better care quality.
31% of new residents, usually for short-term rehab.
65% of new residents, often for short stays.
3% of new residents, often for long-term daily care.
Source: CMS Long-Term Care Facility Characteristics (Data as of Jan 2026)
Residents meet regularly to discuss policies, care quality, and activities
Part of a Continuing Care Retirement Community offering multiple care levels
Organized group of residents that meets regularly to discuss facility policies, quality of life, and activities.
Data sourced from CMS Long-Term Care Facility Characteristics quarterly report. Payer mix reflects the current resident census by primary payment source.
Historical financial and operational data for Anna Maria of Aurora, Inc. from 2011–2023, based on CMS SNF Cost Reports.
Key figures below are for fiscal year ending in 12/2023.
Based on CMS SNF Cost Report for fiscal year ending in 12/2023.
Residents typically stay for brief periods, with frequent admissions and discharges throughout the year.
Most new residents arrive under private pay (65% of admissions), and a typical private pay stay runs around 4 - 5 months.
Coverage residents most often arrive under.
Coverage residents most often leave under.
![]() 0.0 miles from city center
0.0 miles from city center
![]() Estimated distance in miles from Aurora's city center to Anna Maria of Aurora, Inc.'s address, calculated via Google Maps.
Estimated distance in miles from Aurora's city center to Anna Maria of Aurora, Inc.'s address, calculated via Google Maps.
Add your location
Info below is compiled from CMS reports & the OH Dept. of Health, senior community websites & trusted data sources such as Walk Score & BBB.
Communities are listed from highest to lowest based on our ranking methodology.
| Brookdale Westlake Village | NH AL IL MC SNF | Westlake | 60
Facility
60
OH AVG
75
Rank
#177 / 309 |
96.7%
Facility
96.7%
OH AVG
81.7
Rank
#4 / 138 | +18% | 4.38
Facility
4.38
OH AVG
3.54
Rank
#25 / 199 | +18% | +24% | $0
Facility
$0
OH AVG
$74.0k
Rank
#1 / 200 | 5
Facility
5
OH AVG
30.9
Rank
#10 / 199 | 1.3
Facility
1.3
OH AVG
4.6
Rank
#2 / 199 | - | 58 | A+ |
25
Facility
25
OH AVG
40
Rank
#500 / 704 | Labeed Diab | $20.1MFiscal year ending 12/2023
Facility
$20.1MFiscal year ending 12/2023
OH AVG
$10.1M
Rank
#74 / 199 | $10.2MFiscal year ending 12/2023
Facility
$10.2MFiscal year ending 12/2023
OH AVG
$3.9M
Rank
#14 / 199 | 50.8%Fiscal year ending 12/2023
Facility
50.8%Fiscal year ending 12/2023
OH AVG
40.2%
Rank
#6 / 199 | 366373 | ||||
| The Knolls of Oxford | NH AL IL MC SNF | Oxford | 50
Facility
50
OH AVG
75
Rank
#214 / 309 |
92.8%
Facility
92.8%
OH AVG
81.7
Rank
#25 / 138 | +14% | 4.09
Facility
4.09
OH AVG
3.54
Rank
#42 / 199 | -31% | +15% | $0
Facility
$0
OH AVG
$74.0k
Rank
#1 / 200 | 4
Facility
4
OH AVG
30.9
Rank
#4 / 199 | 2.0
Facility
2.0
OH AVG
4.6
Rank
#11 / 199 | - | 46 | - |
0
Facility
0
OH AVG
40
Rank
#686 / 704 | Ronald Beymer | $6.2MFiscal year ending 12/2023
Facility
$6.2MFiscal year ending 12/2023
OH AVG
$10.1M
Rank
#157 / 199 | $4.3MFiscal year ending 12/2023
Facility
$4.3MFiscal year ending 12/2023
OH AVG
$3.9M
Rank
#130 / 199 | 69.5%Fiscal year ending 12/2023
Facility
69.5%Fiscal year ending 12/2023
OH AVG
40.2%
Rank
#22 / 199 | 366282 | ||||
| Elizabeth Scott Community | NH AL MC SNF | Maumee | 60
Facility
60
OH AVG
75
Rank
#177 / 309 |
86.7%
Facility
86.7%
OH AVG
81.7
Rank
#68 / 138 | +6% | 3.52
Facility
3.52
OH AVG
3.54
Rank
#95 / 199 | -64% | -1% | $0
Facility
$0
OH AVG
$74.0k
Rank
#1 / 200 | 9
Facility
9
OH AVG
30.9
Rank
#22 / 199 | 2.3
Facility
2.3
OH AVG
4.6
Rank
#17 / 199 | - | 52 | A+ |
0
Facility
0
OH AVG
40
Rank
#686 / 704 | Elizabeth Scott, Inc | $6.7MFiscal year ending 12/2023
Facility
$6.7MFiscal year ending 12/2023
OH AVG
$10.1M
Rank
#140 / 199 | $3.2MFiscal year ending 12/2023
Facility
$3.2MFiscal year ending 12/2023
OH AVG
$3.9M
Rank
#129 / 199 | 48%Fiscal year ending 12/2023
Facility
48%Fiscal year ending 12/2023
OH AVG
40.2%
Rank
#58 / 199 | 366184 | ||||
| Locust Ridge | NH MC RC SNF | Williamsburg | 61
Facility
61
OH AVG
75
Rank
#174 / 309 |
90.2%
Facility
90.2%
OH AVG
81.7
Rank
#42 / 138 | +10% | 4.46
Facility
4.46
OH AVG
3.54
Rank
#21 / 199 | +35% | +26% | $0
Facility
$0
OH AVG
$74.0k
Rank
#1 / 200 | 18
Facility
18
OH AVG
30.9
Rank
#51 / 199 | 4.5
Facility
4.5
OH AVG
4.6
Rank
#117 / 199 | - | 55 | A+ |
0
Facility
0
OH AVG
40
Rank
#686 / 704 | Gary Vannostrand | $5.9MFiscal year ending 12/2023
Facility
$5.9MFiscal year ending 12/2023
OH AVG
$10.1M
Rank
#168 / 199 | $2.7MFiscal year ending 12/2023
Facility
$2.7MFiscal year ending 12/2023
OH AVG
$3.9M
Rank
#161 / 199 | 45.2%Fiscal year ending 12/2023
Facility
45.2%Fiscal year ending 12/2023
OH AVG
40.2%
Rank
#40 / 199 | 365336 | ||||
| Anna Maria of Aurora, Inc. | NH AL HC IL MC RC SNF | Aurora | 43
Facility
43
OH AVG
75
Rank
#239 / 309 | - | - | 3.78
Facility
3.78
OH AVG
3.54
Rank
#59 / 199 | -20% | +7% | $0
Facility
$0
OH AVG
$74.0k
Rank
#1 / 200 | 7
Facility
7
OH AVG
30.9
Rank
#15 / 199 | 1.8
Facility
1.8
OH AVG
4.6
Rank
#9 / 199 | 1 | 87 | - |
64
Facility
64
OH AVG
40
Rank
#118 / 704 | Norton Bros. Holding Company | $16.4MFiscal year ending 12/2023
Facility
$16.4MFiscal year ending 12/2023
OH AVG
$10.1M
Rank
#17 / 199 | $8.1MFiscal year ending 12/2023
Facility
$8.1MFiscal year ending 12/2023
OH AVG
$3.9M
Rank
#21 / 199 | 49.7%Fiscal year ending 12/2023
Facility
49.7%Fiscal year ending 12/2023
OH AVG
40.2%
Rank
#130 / 199 | 365072 |
Patricia Williams is the Director of Nursing at Anna Maria of Aurora, Inc..
Anna Maria of Aurora, Inc. has a walk score of 64. Moderately walkable. Some errands can be accomplished on foot, with a mix of nearby amenities.
Anna Maria of Aurora, Inc.'s occupancy is 100%.
No, Anna Maria of Aurora, Inc. has a no-pet policy.
Anna Maria of Aurora, Inc. is registered as a for-profit in OH.
Aaron Baker is the administrator of Anna Maria of Aurora, Inc..
Anna Maria of Aurora, Inc. has 43 beds.
Care Cost Calculator: See Prices in Your Area
Nursing Home Data Explorer
Don’t Wait Too Long: 7 Red Flag Signs Your Parent Needs Assisted Living Now
The True Cost of Assisted Living in 2025 – And How Families Are Paying For It
Understanding Senior Living Costs: Pricing Models, Discounts & Financial Assistance


