Birchwood of Spring Branch (formerly Arden Wood)

Nursing Home & Memory Care · Houston, TX
CMS overall rating Info The Overall CMS Rating is scored from 1 to 5 stars and combines results from health inspections, staffing levels, and quality measures. Health inspections carry the most weight. Staffing and quality scores can increase or decrease the final rating based on performance compared to state and national standards.
Birchwood of Spring Branch (formerly Arden Wood)

Nursing Home in Houston

CMS overall rating Info The Overall CMS Rating is scored from 1 to 5 stars and combines results from health inspections, staffing levels, and quality measures. Health inspections carry the most weight. Staffing and quality scores can increase or decrease the final rating based on performance compared to state and national standards.
Calculator: See prices in your area
Birchwood of Spring Branch (formerly Arden Wood) accepts Medicare, Medicaid, and private pay.

Overview of Birchwood of Spring Branch (formerly Arden Wood)

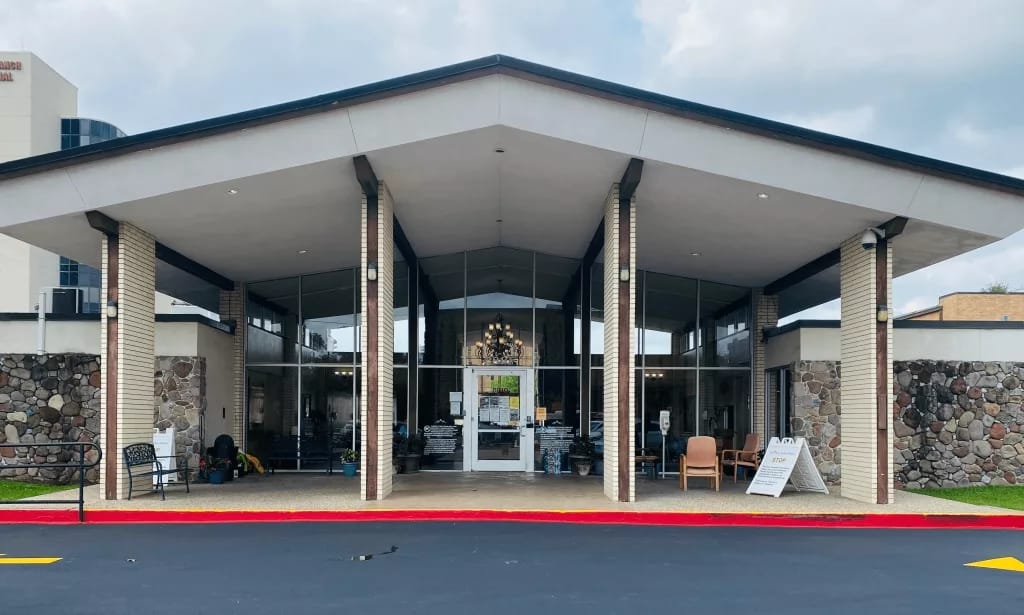
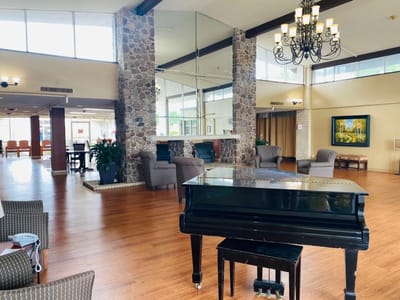
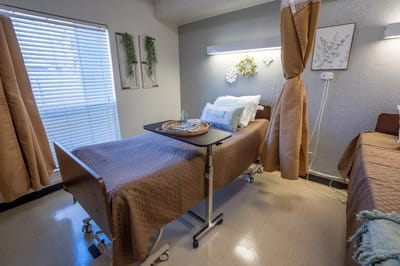
Birchwood of Spring Branch is a memory care, skilled nursing, and rehabilitation community that provides exceptional care. The community offers an inviting community with fine hospitality. The nursing home community houses a team of dedicated staff who are compassionately ready to attend to any need one may have. Residents are encouraged and motivated to live their life to the fullest in a nurturing home-like setting. Birchwood of Spring Branch is able to provide structure and maintain their residents’ sense of individuality while being able to enhance the quality of life for them.

The lifestyle at Birchwood of Spring Branch is built on compassion and care where residents are guaranteed to make the most of their individual day to day while receiving a great amount of hospitality and attentive assistance. Community services include 24-hour nursing care, stimulating activities, engaging social activities and programs; with therapy services that include speech, occupational, and physical; as well as orthopedic recovery, postoperative care, and discharge planning– among many others.

(901) 355-7035

Quality ratings

Measured by Centers for Medicare & Medicaid Services (CMS)

Overall rating Info The Overall CMS Rating combines results from health inspections, staffing levels and quality measures. Health inspections carry the most weight. Staffing and quality scores can increase or decrease the final rating based on performance compared to state and national standards.
▼ 66.8% Below TX avg.
Health Inspection Info Based on the results of the facility's three most recent standard inspections and any complaint investigations. CMS reviews the number, scope, and severity of deficiencies, with more recent findings weighted more heavily.
▼ 65.4% Below TX avg.
Staffing Info Measures average nursing staff hours per resident per day, including Registered Nurses (RNs) and total nursing staff. Ratings are adjusted based on the level of care residents require and are compared to state and national benchmarks.
▲ 66.7% Above TX avg.
Quality Measures Info Based on clinical and physical health indicators reported to CMS, such as hospital readmissions, falls, pressure ulcers, and improvements in mobility. These measures reflect how well residents' health needs are being managed.
At TX avg.

Staffing hours breakdown

Info Daily nursing hours per resident by staff type, reported to CMS. Higher is generally better — compare this facility to state and national averages to see where staffing stands.

Hours per resident per day — compared to Texas state averages

Total nursing care / resident Info This home is ranked 72nd out of 240 homes in Texas.

Total adjusted nursing hours per resident per day, combining RN, LPN, and aide time. CMS adjusts this for case-mix so facilities can be fairly compared.
3h 52m per day
Rank #72 / 240Nurse hours — state benchmarkedThis home is ranked 72nd out of 240 homes in Texas.Shows adjusted nurse hours per resident per day benchmarked to the Texas average, with a ranking across 240 Texas SNFs. More hours mean more direct care. The national average is about 3.5 hrs; below 3.0 is a red flag.
This facility Texas avg (3h 47m per day)
vs Texas avg
+2%

2 of 6 metrics below state avg

Standout metric RN (Weekend) is +19% above state avg
Staff typeHours / dayvs state avg
Registered Nurse (RN) Info RNs hold the highest nursing license and can assess residents, interpret test results, and direct care plans. More RN hours per day often signals stronger clinical oversight and faster response to health changes. 29m per day ▲ 12% State avg: 26m per day · National avg: 41m per day
LPN / LVN Info Licensed Practical Nurses (LPNs) or Licensed Vocational Nurses (LVNs) deliver routine hands-on care — medication administration, wound dressing, and monitoring vital signs. They work under RN supervision and make up a large share of daily bedside care. 58m per day ■ Avg State avg: 57m per day · National avg: 52m per day
Nurse Aide Info Certified Nurse Aides (CNAs) provide the most direct day-to-day assistance: bathing, dressing, feeding, and mobility. Nurse aide hours are typically the largest staffing category and directly affect residents' quality of life. 1h 39m per day ▼ 18% State avg: 2h 1m per day · National avg: 2h 21m per day
Total Nursing (Weekend) Info Combined nursing hours (RN + LPN + Nurse Aide) per resident per day on weekends. Staffing often drops on weekends — this figure reveals whether the facility maintains adequate coverage outside of weekday hours. 3h 11m per day ▲ 7% State avg: 2h 59m per day · National avg: 3h 26m per day
Physical Therapist Info Hours per resident per day provided by licensed Physical Therapists (PTs) or PT Assistants. PT services help residents recover mobility after injury or illness and are especially important for post-acute (short-stay) rehabilitation. 3m per day ▼ 25% State avg: 4m per day · National avg: 4m per day
RN (Weekend) Info Registered nurse hours specifically on weekends. Facilities sometimes reduce RN presence on Saturdays and Sundays — a low weekend RN figure compared to weekday hours can indicate reduced clinical oversight when most administrative staff are absent. 25m per day ▲ 19% State avg: 21m per day · National avg: 29m per day

Capacity and availability

This home usually has availability

Occupancy lower than 85% suggests more openings may be available.

Higher occupancy than the Texas average: 63.5%
Occupancy rate 80.4% Rank #64 / 252Occupancy rate — state benchmarkedThis home is ranked 64th out of 252 homes in Texas.Shows this facility's occupancy rate versus the Texas average, with its statewide rank out of 252. Higher occupancy signals strong local demand and financial stability.
Avg. Length of Stay 164 days
Occupancy rate
80.4% Rank #64 / 252Occupancy rate — state benchmarkedThis home is ranked 64th out of 252 homes in Texas.Shows this facility's occupancy rate versus the Texas average, with its statewide rank out of 252. Higher occupancy signals strong local demand and financial stability.
Avg. Length of Stay
164 days

Who this home usually serves

TYPE OF STAY

Mostly long-term care residents

Most residents stay for extended periods and receive ongoing daily care.

Breakdown by payment type

Medicare

27% of new residents, usually for short-term rehab.

Typical stay 1 - 2 months

Private pay

27% of new residents, often for short stays.

Typical stay 1 - 2 months

Medicaid

47% of new residents, often for long-term daily care.

Typical stay 9 - 10 months

Finances and operations

Privately-owned community
Operated by a partnership between two or more business owners.
Home revenue
$9.0M
Profit
$129.4K
Privately-owned community Operated by a partnership between two or more business owners.
Home revenue
$9.0M Rank #244 / 252Revenue — state benchmarkedThis home is ranked 244th out of 252 homes in Texas.Shows this facility's annual revenue compared to the Texas SNF average. Higher revenue generally means more resources for staffing and capital — read alongside Payroll %.
Profit
$129.4K
Payroll costs Info The portion of the home's budget spent on staff, including nurses, caregivers, and other employees who support care and operations. Rank #230 / 252Payroll — state benchmarkedThis home is ranked 230th out of 252 homes in Texas.Shows total annual staff payroll benchmarked to the Texas average. Higher payroll investment relative to peers often signals better staffing and less reliance on cheaper contract labor.
$6.5M
72.1% of revenue Rank #191 / 230Payroll % — state benchmarkedThis home is ranked 191st out of 230 homes in Texas.Shows payroll as a percentage of revenue versus the Texas average. Well-run SNFs often land around 55–65%. Below 25% may signal understaffing or heavy agency use — read with Staffing ratings.
Other operating costs Info All remaining costs needed to run the home, such as food, utilities, building maintenance, supplies and administrative expenses.
-$3.1M
Total costs $3.4M
Walk Score
Walk Score: 63 / 100 Rank #37 / 207Walk Score — state benchmarkedThis home is ranked 37th out of 207 homes in Texas.Shows how walkable this facility's neighborhood is compared to the average Walk Score across Texas SNFs. Higher scores benefit residents, families, and staff.
Moderately walkable. Some errands can be accomplished on foot, with a mix of nearby amenities.
BBB Rating
BBB Rating: C+ (Not Accredited)
An independent rating from the Better Business Bureau based on factors such as complaint history, transparency, and business practices.
How BBB ratings work

Types of Care at Birchwood of Spring Branch (formerly Arden Wood)

Nursing Home Memory Care

Contact Birchwood of Spring Branch (formerly Arden Wood)

Inspection History

In Texas, the Health and Human Services Commission (HHSC) is the primary regulatory body that conducts unannounced inspections and publishes quality reports for all long-term care homes.

The data displayed corresponds to the last 5 years.

6 visits/inspections Info Inspections are mandatory, regular evaluations conducted by state health departments or regulatory agencies. They ensure the community provides safe, compliant care, covering areas like resident health, staff and management.

Latest inspection

Date December 30, 2025
Annual Inspection

30 deficiencies

Deficiencies indicate regulatory issues. A higher number implies the facility had several areas requiring improvement.

Texas average: 32 deficiencies

Inspection Report Summary for Birchwood of Spring Branch (formerly Arden Wood)

The most recent inspection on December 30, 2025, found deficiencies related to infection prevention and control, specifically missing Enhanced Barrier Precautions signage outside resident rooms requiring PPE. Earlier inspections showed a pattern of deficiencies involving resident care coordination, medication management, infection control, and safety issues, including substantiated complaints of neglect and immediate jeopardy situations that were later resolved. Main themes across reports included failures in infection prevention and control, respiratory care, pharmaceutical services, and timely supervision of residents, with pest control and environmental safety also noted. Several complaint investigations were substantiated, including cases of neglect resulting in resident injury and infection outbreaks, but enforcement actions such as fines or license suspensions were not listed in the available reports. The facility’s inspection history shows ongoing challenges with compliance, though immediate jeopardy findings were addressed through corrective plans.

Health Inspection History

Inspections
Total health inspections 5

Texas average 7.4


Last Health inspection on Mar 2025

Total health citations
23 Rank #142 / 243Health citations — state benchmarkedThis home is ranked 142nd out of 243 homes in Texas.Shows this facility's total health deficiency citations benchmarked to the Texas state average, with a ranking across all 243 TX SNFs. Lower citation counts earn a better rank.

Texas average 25.9

Citations per inspection
4.6 Rank #211 / 243Citations per inspection — state benchmarkedThis home is ranked 211th out of 243 homes in Texas.Shows average deficiency citations per CMS inspection for this facility versus the Texas mean across 243 SNFs with citation data. Lower is better.

Texas average 3.67


Health citations are formal notices following inspections when they fail to comply with safety and care standards.

8 of 23 citations resulted from standard inspections; 8 of 23 resulted from complaint investigations; and 7 of 23 came from combined inspections (standard and complaint).

Breakdown of citation severity (last 4 years)
Critical Health citations More info
9
350% worse than Texas average

Texas average: 2


Serious Health citations More info 0
100% better than Texas average

Texas average: 0.4

9 critical citations More info Texas average: 2

0 serious citations More info Texas average: 0.4

14 moderate citations More info Texas average: 23

0 minor citations More info Texas average: 0.4
Citations history (last 4 years)
Nursing Services moderate citation Info Issues related to the availability and quality of nursing staff and the care they provide. Mar 28, 2025
Corrected

Nutrition moderate citation Info Issues related to food quality, meal service, and resident's nutritional needs. Mar 28, 2025
Corrected

Pharmacy moderate citation Info Issues related to medication management, including how drugs are stored, administered, and monitored. Mar 28, 2025
Corrected

Pharmacy moderate citation Info Issues related to medication management, including how drugs are stored, administered, and monitored. Mar 28, 2025
Corrected

Financial Assistance for
Nursing Home in Texas

Birchwood of Spring Branch (formerly Arden Wood) is located in Houston, Texas.
Here are the financial assistance programs available to residents in Texas.

Get Financial aid guidance

Community Care for the Aged and Disabled (CCAD)

TX Medicaid CCAD

Age 65+ or disabled
General Texas resident, Medicaid-eligible, care need (not always nursing home level).
Income Limits (2025) ~$2,829/month 300% FBR, individual
Asset Limits $2,000 (individual), $3,000 (couple).
TX

Large state; rural access challenges.

Benefits
Personal care (5-7 hours/day) Respite (240 hours/year) Adult day care (~$60/day) Home aides

Texas Community Care Services

TX CCS

Age 60+
General Texas resident, at risk of decline.
Income Limits ~$2,000/month individual, varies
Asset Limits $5,000 individual
TX

Limited funding; high demand in urban areas.

Benefits
In-home care (3-5 hours/week) Respite (up to 10 days/year) Transportation (~5 trips/month)

Area Agency on Aging (AAA) Services

Texas AAA Services

Age 60+
General TX resident; no income/asset limits.
Income Limits (2025) None; donations encouraged.
Asset Limits Not assessed.
TX

28 AAAs; includes Meals on Wheels in some areas.

Benefits
Meals (~$5-$7/meal) Transportation Homemaker services (~4 hours/week) Respite (~5 days/year) Legal aid

Medicare Savings Program (MSP)

Texas Medicare Savings Program

Age 65+ or disabled
General TX resident, Medicare Part A/B.
Income Limits (2025) ~$2,510/month (QMB), ~$3,380/month (SLMB), ~$3,598/month (QI)—individual.
Asset Limits $9,430 (individual), $14,130 (couple).
TX

Includes Extra Help for Part D; no waitlist.

Benefits
Covers Part B premiums ($174.70/month) Deductibles ($240/year) Copays (~20%)

Low-Income Home Energy Assistance Program (LIHEAP)

Texas Comprehensive Energy Assistance Program (CEAP)

Age 60+ prioritized
General TX resident, low-income.
Income Limits (2025) ~$3,970/month 185% FPL
Asset Limits Not assessed.
TX

Priority for elderly/disabled; covers gas, electric, propane.

Benefits
Heating/cooling aid ($300-$1,000/season) Emergency aid ($500 max)

Family Caregiver Support Program (FCSP)

Texas Family Caregiver Support Program

Age
General Caregivers of 60+ needing care or 55+ caregivers of others; TX resident; 2+ ADLs.
Income Limits (2025) No strict cap; prioritizes low-income ~$24,980/year
Asset Limits Not assessed.
TX

High rural demand; includes grandparent caregivers.

Benefits
Respite (4-6 hours/week or 5 days/year) Adult day care ($60/day) Training Supplies (~$500/year)

Senior Community Service Employment Program (SCSEP)

Texas SCSEP

Age 55+
General unemployed, low-income, TX resident.
Income Limits (2025) ~$1,983/month 125% FPL
Asset Limits Not specified.
TX

Priority for veterans, rural residents; AARP partnership.

Benefits
Paid training (~20 hours/week at ~$7.25/hour) Job placement

VA Aid and Attendance (A&A) and Housebound Benefits

Texas VA Aid and Attendance/Housebound

Age 65+ or disabled veteran/spouse
General TX resident, wartime service, ADL help (A&A) or homebound.
Income Limits (2025) Net income < ~$1,984/month (veteran with dependent, A&A); pension offsets income.
Asset Limits ~$155,356 net worth
TX

High veteran population; supports rural/urban needs.

Benefits
Cash (~$1,433-$2,642/month veteran, ~$951-$1,318 spouse) for care costs

Property Tax Exemption for Seniors

Texas Senior Property Tax Exemption

Age 65+
General TX resident, homeowner (homestead).
Income Limits (2025) None; tax-based eligibility.
Asset Limits Not assessed.
TX

$25,000+ exemption; optional freeze in some counties; saves ~$500-$1,000/year.

Benefits
Tax exemption or freeze (~$500-$1,000/year savings)

Senior Farmers’ Market Nutrition Program (SFMNP)

Texas SFMNP

Age 60+
General TX resident, low-income.
Income Limits (2025) ~$2,322/month 185% FPL
Asset Limits Not assessed.
TX

Vouchers (~$50/season); serves ~20,000 via 28 AAAs.

Benefits
Vouchers (~$50/season) for produce at farmers’ markets

Places of interest near Birchwood of Spring Branch (formerly Arden Wood)

Address 11.1 miles from city center Info Estimated distance in miles from Houston's city center to Birchwood of Spring Branch (formerly Arden Wood)'s address, calculated via Google Maps. — 9.03 miles to nearest hospital (Kindred Hospital Houston Medical Center)

Calculate Travel Distance to Birchwood of Spring Branch (formerly Arden Wood)

Add your location

Address

Staffing Data (Q2 2025)

This data corresponds to Q2 2025 and is based on CMS Payroll-Based Journal.

Total staff 104
Employees 101
Contractors 3
Staff to resident ratio 0.91:1
39% worse than Texas average

Texas average ratio: 1.51:1

Avg staff/day 55
Average shift 8.6 hours
6% better than Texas average

Texas average: 8.1 hours

Total staff hours (quarter) 43,025
Nursing staff breakdown
Registered Nurse

Manages medical care and health needs.

Total count 10
Average shift length Info Average shift length. Calculated as total hours divided by days worked and average staff per day. 9.6 hours

No contractors work on this role.

Licensed Practical Nurse

Assists with medical care and medications.

Total count 22
Average shift length Info Average shift length. Calculated as total hours divided by days worked and average staff per day. 9.9 hours

No contractors work on this role.

Certified Nursing Assistant

Helps with daily care and mobility.

Total count 47
Average shift length Info Average shift length. Calculated as total hours divided by days worked and average staff per day. 8.4 hours

No contractors work on this role.

Contractor staffing

Total hours from contractors

0.3%

132 contractor hours this quarter

Occupational Therapy Aide: 2 Medical Director: 1
Staff by category
Certified Nursing Assistant4704720,58391100%8.4
Licensed Practical Nurse2202210,32491100%9.9
Registered Nurse100104,22191100%9.6
RN Director of Nursing4041,9596470%8.1
Clinical Nurse Specialist3039836470%7.9
Qualified Social Worker2028638189%7.5
Respiratory Therapy Technician2027197987%5.7
Physical Therapy Aide2025786066%7.7
Dietitian1015016673%7.6
Administrator1014966268%8
Speech Language Pathologist2024846673%7.3
Nurse Practitioner1014725965%8
Mental Health Service Worker1014645864%8
Physical Therapy Assistant2021993033%4.7
Occupational Therapy Aide0221041314%8
Qualified Activities Professional1014878%6.8
Medical Director0112889%3.4
47 Certified Nursing Assistant
% of Days 100%
22 Licensed Practical Nurse
% of Days 100%
10 Registered Nurse
% of Days 100%
4 RN Director of Nursing
% of Days 70%
3 Clinical Nurse Specialist
% of Days 70%
2 Qualified Social Worker
% of Days 89%
2 Respiratory Therapy Technician
% of Days 87%
2 Physical Therapy Aide
% of Days 66%
1 Dietitian
% of Days 73%
1 Administrator
% of Days 68%
2 Speech Language Pathologist
% of Days 73%
1 Nurse Practitioner
% of Days 65%
1 Mental Health Service Worker
% of Days 64%
2 Physical Therapy Assistant
% of Days 33%
2 Occupational Therapy Aide
% of Days 14%
1 Qualified Activities Professional
% of Days 8%
1 Medical Director
% of Days 9%

Facility Characteristics

Source: CMS Long-Term Care Facility Characteristics (Data as of Jan 2026)

Total residents 114
Medicaid
103
90.4% of residents
Private pay or other
11
9.6% of residents
Programs & Services
Residents Group

Residents meet regularly to discuss policies, care quality, and activities

Active Resident Council

Organized group of residents that meets regularly to discuss facility policies, quality of life, and activities.

Quality of care over time

These measures show how residents usually do over time at this home, based on health outcomes and preventive care.

High-risk clinical events score Info A composite score based on pressure ulcers, falls with injury, weight loss, walking ability decline, and activities of daily living decline. 6.3
27% better than Texas average

Texas average: 8.6

Functional decline score Info A composite score based on activities of daily living decline, walking ability decline, and incontinence. 8.6
46% better than Texas average

Texas average: 16.0

Long-stay resident measures
Significantly above average Texas avg: 4.1 Info CMS star rating based on long-stay quality measure performance. 5 stars = significantly above average, 1 star = significantly below average.
Need for Help with Daily Activities Increased Info Percent of long-stay residents whose need for help with daily activities has increased 5.0%
69% better than Texas average

Texas average: 16.2%

Walking Ability Worsened Info Percent of long-stay residents whose ability to move independently worsened 7.3%
55% better than Texas average

Texas average: 16.2%

Low Risk Residents with Bowel/Bladder Incontinence Info Percent of low risk long-stay residents who lose control of their bowels or bladder 13.6%
13% better than Texas average

Texas average: 15.7%

Falls with Major Injury Info Percent of long-stay residents experiencing one or more falls with major injury 3.6%
10% worse than Texas average

Texas average: 3.2%

High Risk Residents with Pressure Ulcers Info Percent of long-stay high risk residents with pressure ulcers 2.9%
35% better than Texas average

Texas average: 4.4%

Urinary Tract Infection Info Percent of long-stay residents with a urinary tract infection 0.0%
100% better than Texas average

Texas average: 0.8%

Lost Too Much Weight Info Percent of long-stay residents who lose too much weight 12.8%
269% worse than Texas average

Texas average: 3.5%

Depressive Symptoms Info Percent of long-stay residents who have depressive symptoms 1.0%
67% better than Texas average

Texas average: 2.9%

Antipsychotic Use Info Percent of long-stay residents who received an antipsychotic medication 10.7%
35% worse than Texas average

Texas average: 7.9%

Pneumococcal Vaccine Info Percent of long-stay residents assessed and appropriately given the pneumococcal vaccine 95.1%
In line with Texas average

Texas average: 97.3%

Influenza Vaccine Info Percent of long-stay residents assessed and appropriately given the seasonal influenza vaccine 97.5%
In line with Texas average

Texas average: 97.9%

Hospitalizations per 1,000 days Info Number of hospitalizations per 1,000 long-stay resident days. 3.92
84% worse than Texas average

Texas average: 2.13

ED visits per 1,000 days Info Number of outpatient emergency department visits per 1,000 long-stay resident days. 1.27
39% better than Texas average

Texas average: 2.07

Short-stay resident measures
Below average Texas avg: 3.1 Info CMS star rating based on short-stay quality measure performance. 5 stars = much above average, 1 star = much below average.
Pneumococcal Vaccine Info Percent of short-stay residents assessed and appropriately given the pneumococcal vaccine 53.5%
41% worse than Texas average

Texas average: 90.4%

Antipsychotic medication increase Info Percent of short-stay residents who newly received an antipsychotic medication 8.3%
475% worse than Texas average

Texas average: 1.4%

Influenza Vaccine Info Percent of short-stay residents assessed and appropriately given the seasonal influenza vaccine 75.0%
15% worse than Texas average

Texas average: 88.0%

Re-hospitalized after SNF stay Info Percentage of short-stay residents who were re-hospitalized after their nursing home admission. 40.2%
55% worse than Texas average

Texas average: 25.9%

Emergency department visits Info Percentage of short-stay residents who had an outpatient emergency department visit. 3.2%
73% better than Texas average

Texas average: 12.0%

Falls with major injury Info Percentage of SNF residents who experience falls with major injury during their stay. 4.2%
442% worse than Texas average

Texas average: 0.8%

Penalties and fines

Federal penalties imposed by CMS for regulatory violations, including civil money penalties (fines) and denials of payment for new Medicare/Medicaid admissions.

Source: CMS Penalties Database (Data as of Jan 2026)

Total fines amount $107K
34% higher than Texas average

Texas average: $80K

Number of fines 1
60% fewer fines than Texas average

Texas average: 2.5

Payment Denials Info Serious action where Medicare and/or Medicaid temporarily stops payments for new residents until issues are fixed. 1
354% more payment denials than Texas average

Texas average: 0.2

Fines amount comparison
This facility $107K
Texas average $80K
Penalty History

Penalties are imposed by CMS for violations of federal nursing home regulations.

2 penalties in the past 3 years

Multiple penalties were reported in the last 3 years.

Civil Money Penalty Info Fines imposed for noncompliance, which can be assessed per day or per instance of violation. Dec 23, 2023
$107K
Payment Denial Info Serious action where Medicare and/or Medicaid temporarily stops payments for new residents until issues are fixed. Dec 23, 2023
10 days

Last updated: Jan 2026

Compare Nursing Home around Houston The information below is reported by the Texas Health and Human Services Commission.

5 facilities compared · CMS & TX Dept. of Health data · Updated May 2026

Filter by care type
Park Manor of CyFair
NH

Nursing Home Licensed facility providing 24/7 skilled nursing care for residents with complex, ongoing medical needs. Staffed by RNs, LPNs, and CNAs. Inspected and star-rated annually by CMS. Accepts Medicare (short-term rehab) and Medicaid (long-term care).

AL

Assisted Living A licensed, long-term care setting for seniors or individuals with disabilities who need help with daily activities — like bathing, dressing, and medication management — but not 24-hour skilled nursing. Offers housing, meals, and around-the-clock support while aiming to maximize resident independence.

Houston (White Oak Bend)120 75.2% +19%3.27 +51%-10%072.3-114- 55 Hmg Park Manor Of Cyfair, L.l.c.$10.9M$3.9M36.1%675818
Capstone Healthcare Estates at Veterans Memorial
NH

Nursing Home Licensed facility providing 24/7 skilled nursing care for residents with complex, ongoing medical needs. Staffed by RNs, LPNs, and CNAs. Inspected and star-rated annually by CMS. Accepts Medicare (short-term rehab) and Medicaid (long-term care).

AL

Assisted Living A licensed, long-term care setting for seniors or individuals with disabilities who need help with daily activities — like bathing, dressing, and medication management — but not 24-hour skilled nursing. Offers housing, meals, and around-the-clock support while aiming to maximize resident independence.

IL

Independent Living Lifestyle-focused communities for older adults offering dining, activities, and transportation with minimal personal care. Best for active, independent seniors who want community without medical support.

MC

Memory Care Secured, specialized care for people living with Alzheimer's or dementia. Staff trained in cognitive impairment, with higher staff-to-resident ratios and an environment designed to reduce confusion and wandering risk.

Houston (Fallbrook)120 84.2% +33%3.63 -29%0%0192.12101- 51 Capstone Vm Opco Llc$11.8M$4.0M33.6%676252
Capstone Healthcare Estates on Orem
NH

Nursing Home Licensed facility providing 24/7 skilled nursing care for residents with complex, ongoing medical needs. Staffed by RNs, LPNs, and CNAs. Inspected and star-rated annually by CMS. Accepts Medicare (short-term rehab) and Medicaid (long-term care).

Houston (Central Southwest)120 80.7% +27%3.69 -40%+2%1202.9197- 55 -$11.0M$3.8M34.7%676314
Courtyard Nursing and Rehabilitation
NH

Nursing Home Licensed facility providing 24/7 skilled nursing care for residents with complex, ongoing medical needs. Staffed by RNs, LPNs, and CNAs. Inspected and star-rated annually by CMS. Accepts Medicare (short-term rehab) and Medicaid (long-term care).

Houston (Southeast Houston)120 59.6% -6%3.05 +17%-16%1186.0167- 73 Stanwick Senior Care Llc$6.7M$3.1M46.5%455613
Birchwood of Spring Branch (formerly Arden Wood)
NH

Nursing Home Licensed facility providing 24/7 skilled nursing care for residents with complex, ongoing medical needs. Staffed by RNs, LPNs, and CNAs. Inspected and star-rated annually by CMS. Accepts Medicare (short-term rehab) and Medicaid (long-term care).

MC

Memory Care Secured, specialized care for people living with Alzheimer's or dementia. Staff trained in cognitive impairment, with higher staff-to-resident ratios and an environment designed to reduce confusion and wandering risk.

Houston (Spring Branch Central)174 80.4% +27%3.87 +28%+7%1234.69121C+ 63 Bw Of Spring Branch Llc$3.5M$1.1M31.8%675789

Guides for Better Senior Living

Care Cost Calculator: See Prices in Your Area

Nursing Home Data Explorer

Don’t Wait Too Long: 7 Red Flag Signs Your Parent Needs Assisted Living Now

The True Cost of Assisted Living in 2025 – And How Families Are Paying For It

Understanding Senior Living Costs: Pricing Models, Discounts & Financial Assistance

Frequently Asked Questions about Birchwood of Spring Branch (formerly Arden Wood)

What neighborhood is Birchwood of Spring Branch (formerly Arden Wood) in?

Birchwood of Spring Branch (formerly Arden Wood) is in the Spring Branch Central neighborhood of Houston.

Is Birchwood of Spring Branch (formerly Arden Wood) in a walkable area?

Birchwood of Spring Branch (formerly Arden Wood) has a walk score of 63. Moderately walkable. Some errands can be accomplished on foot, with a mix of nearby amenities.

What is the phone number of Birchwood of Spring Branch (formerly Arden Wood)?

(901) 355-7035 will put you in contact with the team at Birchwood of Spring Branch (formerly Arden Wood).

Is Birchwood of Spring Branch (formerly Arden Wood) Medicare or Medicaid certified?

Yes — Birchwood of Spring Branch (formerly Arden Wood) is a CMS-certified provider of Medicare and Medicaid.

Explore Open Rooms
1 Contact details
2 What type of senior care service are you looking for?
3 What budget do you have in mind for senior care?
4 How soon do you need to find care?
5 Additional details

Thank you for your interest!

Our team will be in touch shortly to help with next steps.