


Total staff
146
Employees
146
Contractors
0
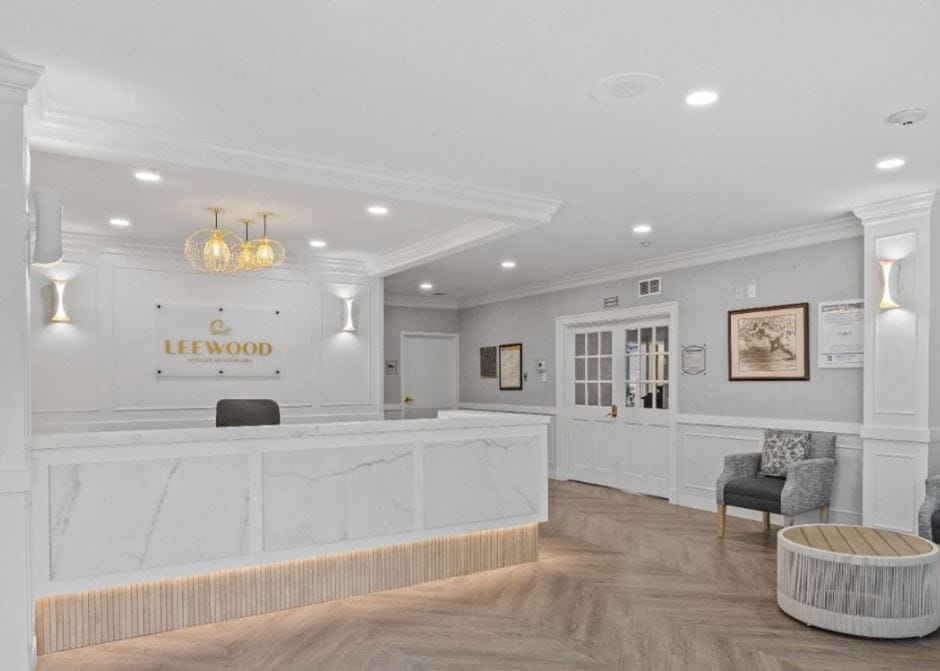
August Healthcare at Leewood is a 132-bed nursing home in Annandale, Virginia, sitting along Braddock Road at 7120 Braddock Rd and owned by Ina Belviy. The care model covers nursing, memory care, and respite stays. The neighborhood scores a 60 on walkability, so some daily needs are within reach on foot, though a car helps for most trips.
Residents stay an average of 132 days. That figure spans both short-term rehab patients moving toward discharge and longer-term residents in nursing or memory care. Nursing hours total 4 hours and 11 minutes per resident per day, including 29 minutes of registered nurse time and 2 hours and 12 minutes of nurse aide time.
The facility is running at 81.6% occupancy. Medicare, Medicaid, and private pay are all accepted.
What makes this facility’s clinical setup notable is how much happens on-site. Residents can see a dentist, podiatrist, optometrist, orthopedic specialist, or psychiatrist without leaving the building. Diagnostics and an antibiotics lab are also available in-house.
Dining runs to gourmet meals with a vegetarian option and a variety of snacks. The activity calendar brings in movies, cooking classes, piano performances, gardening, and art, pet, and music therapy on a weekly basis.
August Healthcare at Leewood is a clinically dense nursing facility that keeps most specialist care under one roof, accepts all major coverage types, and pairs its medical program with a diverse daily activity schedule.
Staffing hours
![]() Daily nursing hours per resident by staff type, reported to CMS. Higher is generally better — compare this facility to state and national averages to see where staffing stands.
Daily nursing hours per resident by staff type, reported to CMS. Higher is generally better — compare this facility to state and national averages to see where staffing stands.
Hours per resident per day vs Virginia averages
Total nursing care
![]() This home is ranked 34th out of 71 homes in Virginia for nurse hours. Total adjusted nursing hours per resident per day, combining RN, LPN, and aide time. CMS adjusts this for case-mix so facilities can be fairly compared.
This home is ranked 34th out of 71 homes in Virginia for nurse hours. Total adjusted nursing hours per resident per day, combining RN, LPN, and aide time. CMS adjusts this for case-mix so facilities can be fairly compared.
4h 11m
12% above state avg3 of 6 metrics below state avg
Reporting period: October 1 – December 31, 2025 (Q4 2025). Source: CMS Payroll-Based Journal report.
Manages medical care and health needs.
Assists with medical care and medications.
Helps with daily care and mobility.
| Certified Nursing Assistant | 66 | 0 | 66 | 28,153 | 92 | 100% | 7.9 |
| Licensed Practical Nurse | 30 | 0 | 30 | 13,675 | 92 | 100% | 8.3 |
| Registered Nurse | 13 | 0 | 13 | 3,852 | 92 | 100% | 8.1 |
| Clinical Nurse Specialist | 5 | 0 | 5 | 1,897 | 64 | 70% | 7.6 |
| Other Dietary Services Staff | 4 | 0 | 4 | 1,405 | 85 | 92% | 7.7 |
| Speech Language Pathologist | 3 | 0 | 3 | 1,009 | 75 | 82% | 7 |
| Dietitian | 2 | 0 | 2 | 933 | 82 | 89% | 7.6 |
| Mental Health Service Worker | 3 | 0 | 3 | 913 | 65 | 71% | 7.3 |
| Respiratory Therapy Technician | 6 | 0 | 6 | 831 | 74 | 80% | 6 |
| Physical Therapy Aide | 5 | 0 | 5 | 628 | 81 | 88% | 4.5 |
| Physical Therapy Assistant | 4 | 0 | 4 | 600 | 69 | 75% | 6 |
| Nurse Practitioner | 1 | 0 | 1 | 480 | 64 | 70% | 7.5 |
| Qualified Social Worker | 2 | 0 | 2 | 347 | 46 | 50% | 7.5 |
| Occupational Therapy Aide | 1 | 0 | 1 | 148 | 20 | 22% | 7.4 |
| Administrator | 1 | 0 | 1 | 44 | 44 | 48% | 1 |
Federal penalties imposed by CMS for regulatory violations, including civil money penalties (fines) and denials of payment for new Medicare/Medicaid admissions.
Source: CMS Penalties Database
No penalties in the past 3 years
No civil money penalties or payment denials were reported in the last 3 years.
These measures show how residents usually do over time at this home, based on health outcomes and preventive care.
Virginia average: 10.1
Virginia average: 19.7
Virginia average: 16.8%
Virginia average: 19.7%
Virginia average: 22.6%
Virginia average: 3.6%
Virginia average: 5.4%
Virginia average: 1.5%
Virginia average: 5.9%
Virginia average: 14.9%
Virginia average: 12.9%
Virginia average: 91.3%
Virginia average: 94.0%
Virginia average: 1.46
Virginia average: 1.41
Virginia average: 74.9%
Virginia average: 1.2%
Virginia average: 73.6%
Virginia average: 22.0%
Virginia average: 11.7%
Virginia average: 0.8%
Virginia average: 53.7%
Virginia average: 50.6%
Quality measures are calculated from Minimum Data Set (MDS) assessments. For most measures, lower percentages indicate better care quality.
46% of new residents, usually for short-term rehab.
31% of new residents, often for short stays.
23% of new residents, often for long-term daily care.
Source: CMS Long-Term Care Facility Characteristics (Data as of Jan 2026)
Residents meet regularly to discuss policies, care quality, and activities
Organized group of residents that meets regularly to discuss facility policies, quality of life, and activities.
Data sourced from CMS Long-Term Care Facility Characteristics quarterly report. Payer mix reflects the current resident census by primary payment source.
Historical financial and operational data for August Healthcare at Leewood from 2011–2024, based on CMS SNF Cost Reports.
Key figures below are for fiscal year ending in 03/2024.
Based on CMS SNF Cost Report for fiscal year ending in 03/2024.
Most residents typically stay for a few weeks or months before returning home or moving on.
New residents most often arrive under Medicare (46% of admissions), and a typical Medicare stay runs around 1 months.
Coverage residents most often arrive under.
Coverage residents most often leave under.
![]() 1.3 miles from city center
1.3 miles from city center
![]() Estimated distance in miles from Annandale's city center to August Healthcare at Leewood's address, calculated via Google Maps.
Estimated distance in miles from Annandale's city center to August Healthcare at Leewood's address, calculated via Google Maps.
Add your location
Info below is compiled from CMS reports & the VA Depts. of Social Services & Health, senior community websites & trusted data sources such as Walk Score & BBB.
Communities are listed from highest to lowest based on our ranking methodology.
| Goodwin House Alexandria | NH AL HC IL MC SNF | Alexandria (Alexandria West) | 250
Facility
250
VA AVG
96
Rank
#6 / 365 |
22.4%
Facility
22.4%
VA AVG
70.5
Rank
#294 / 297 | -68% | 6.07
Facility
6.07
VA AVG
3.74
Rank
#8 / 71 | +19% | +62% | $0
Facility
$0
VA AVG
$54.3k
Rank
#1 / 75 | 14
Facility
14
VA AVG
38.4
Rank
#13 / 70 | 4.7
Facility
4.7
VA AVG
8.9
Rank
#16 / 70 | - | 56 | - |
62
Facility
62
VA AVG
44
Rank
#97 / 446 | Robert Liebreich | $31.7MFiscal year ending 09/2023
Facility
$31.7MFiscal year ending 09/2023
VA AVG
$18.3M
Rank
#4 / 71 | $31.0MFiscal year ending 09/2023
Facility
$31.0MFiscal year ending 09/2023
VA AVG
$6.9M
Rank
#1 / 71 | 97.7%Fiscal year ending 09/2023
Facility
97.7%Fiscal year ending 09/2023
VA AVG
39.7%
Rank
#23 / 71 | 495057 | ||||
| Arleigh Burke Pavilion at Vinson Hall Retirement Community | NH AL HC IL MC RC SNF | Mclean (Kirby Road) | 32
Facility
32
VA AVG
96
Rank
#335 / 365 |
59.4%
Facility
59.4%
VA AVG
70.5
Rank
#216 / 297 | -16% | 5.53
Facility
5.53
VA AVG
3.74
Rank
#11 / 71 | -11% | +48% | $0
Facility
$0
VA AVG
$54.3k
Rank
#1 / 75 | 13
Facility
13
VA AVG
38.4
Rank
#11 / 70 | 4.3
Facility
4.3
VA AVG
8.9
Rank
#13 / 70 | - | 19 | - |
52
Facility
52
VA AVG
44
Rank
#160 / 446 | Nmcgr | $10.7MFiscal year ending 12/2023
Facility
$10.7MFiscal year ending 12/2023
VA AVG
$18.3M
Rank
#30 / 71 | $14.8MFiscal year ending 12/2023
Facility
$14.8MFiscal year ending 12/2023
VA AVG
$6.9M
Rank
#17 / 71 | 139.4%Fiscal year ending 12/2023
Facility
139.4%Fiscal year ending 12/2023
VA AVG
39.7%
Rank
#27 / 71 | 495410 | ||||
| Woodbine Rehabilitation & Healthcare Center | NH HOS MC PC RC SNF | Alexandria (Rosemont) | 307
Facility
307
VA AVG
96
Rank
#2 / 365 |
93.1%
Facility
93.1%
VA AVG
70.5
Rank
#30 / 297 | +32% | 2.64
Facility
2.64
VA AVG
3.74
Rank
#71 / 71 | +51% | -30% | $0
Facility
$0
VA AVG
$54.3k
Rank
#1 / 75 | 20
Facility
20
VA AVG
38.4
Rank
#26 / 70 | 6.7
Facility
6.7
VA AVG
8.9
Rank
#31 / 70 | - | 286 | - |
24
Facility
24
VA AVG
44
Rank
#341 / 446 | Donna Shaw | $52.9MFiscal year ending 06/2024
Facility
$52.9MFiscal year ending 06/2024
VA AVG
$18.3M
Rank
#5 / 71 | $20.9MFiscal year ending 06/2024
Facility
$20.9MFiscal year ending 06/2024
VA AVG
$6.9M
Rank
#8 / 71 | 39.4%Fiscal year ending 06/2024
Facility
39.4%Fiscal year ending 06/2024
VA AVG
39.7%
Rank
#58 / 71 | 495019 | ||||
| August Healthcare at Leewood | NH MC RC SNF | Annandale (Braddock Road) | 132
Facility
132
VA AVG
96
Rank
#66 / 365 | - | - | 4.19
Facility
4.19
VA AVG
3.74
Rank
#34 / 71 | -8% | +12% | $0
Facility
$0
VA AVG
$54.3k
Rank
#1 / 75 | 33
Facility
33
VA AVG
38.4
Rank
#42 / 70 | 11.0
Facility
11.0
VA AVG
8.9
Rank
#49 / 70 | - | 139 | - |
60
Facility
60
VA AVG
44
Rank
#108 / 446 | Ina Belviy | $15.5MFiscal year ending 03/2024
Facility
$15.5MFiscal year ending 03/2024
VA AVG
$18.3M
Rank
#50 / 71 | $7.9MFiscal year ending 03/2024
Facility
$7.9MFiscal year ending 03/2024
VA AVG
$6.9M
Rank
#40 / 71 | 50.8%Fiscal year ending 03/2024
Facility
50.8%Fiscal year ending 03/2024
VA AVG
39.7%
Rank
#19 / 71 | 495337 | ||||
| Alexandria Rehabilitation & Healthcare Center | NH HOS PC RC SNF | Alexandria (North Ridge) | 111
Facility
111
VA AVG
96
Rank
#108 / 365 |
93.7%
Facility
93.7%
VA AVG
70.5
Rank
#29 / 297 | +33% | 2.94
Facility
2.94
VA AVG
3.74
Rank
#67 / 71 | -5% | -21% | $0
Facility
$0
VA AVG
$54.3k
Rank
#1 / 75 | 40
Facility
40
VA AVG
38.4
Rank
#49 / 70 | 13.3
Facility
13.3
VA AVG
8.9
Rank
#57 / 70 | 2 | 104 | - |
37
Facility
37
VA AVG
44
Rank
#254 / 446 | Tahir Majeed | $15.7MFiscal year ending 06/2024
Facility
$15.7MFiscal year ending 06/2024
VA AVG
$18.3M
Rank
#49 / 71 | $6.1MFiscal year ending 06/2024
Facility
$6.1MFiscal year ending 06/2024
VA AVG
$6.9M
Rank
#62 / 71 | 38.9%Fiscal year ending 06/2024
Facility
38.9%Fiscal year ending 06/2024
VA AVG
39.7%
Rank
#53 / 71 | 495203 |
August Healthcare at Leewood is located in Annandale, Virginia.
Here are the financial assistance programs available to residents in Virginia.
August Healthcare at Leewood is in the Braddock Road neighborhood.
August Healthcare at Leewood has a walk score of 60. Moderately walkable. Some errands can be accomplished on foot, with a mix of nearby amenities.
August Healthcare at Leewood's occupancy is 81.6%.
No, August Healthcare at Leewood has a no-pet policy.
August Healthcare at Leewood is registered as a for-profit.
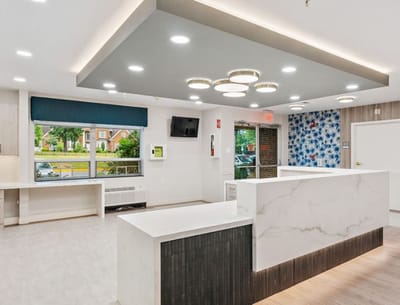
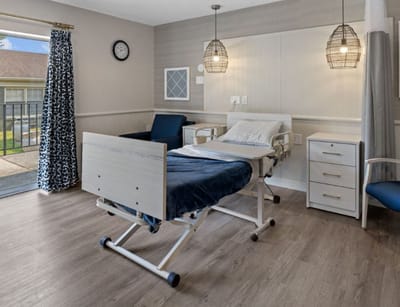
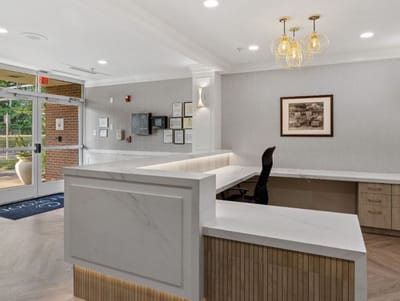
Yes — there are 4 photos of August Healthcare at Leewood in the photo gallery on this page.
August Healthcare at Leewood is located at 7120 Braddock Rd, Annandale, VA 22003.
Care Cost Calculator: See Prices in Your Area
Nursing Home Data Explorer
Don’t Wait Too Long: 7 Red Flag Signs Your Parent Needs Assisted Living Now
The True Cost of Assisted Living in 2025 – And How Families Are Paying For It
Understanding Senior Living Costs: Pricing Models, Discounts & Financial Assistance


