Bell Trace Family-first Senior Living
Nursing Home, Assisted Living, Hospice Care, Independent Living & Respite Care · Bloomington, IN
CMS overall rating Info CMS (the Centers for Medicare & Medicaid Services) is the federal agency that rates nursing home quality. Its Overall Rating runs from 1 to 5 stars, combining health inspections, staffing, and quality measures, with inspections weighted most heavily.

Bell Trace Family-first Senior Living

Nursing Home, Assisted Living, Hospice Care, Independent Living & Respite Care · Bloomington, IN
CMS overall rating Info CMS (the Centers for Medicare & Medicaid Services) is the federal agency that rates nursing home quality. Its Overall Rating runs from 1 to 5 stars, combining health inspections, staffing, and quality measures, with inspections weighted most heavily.
Calculator: See prices in your area
Bell Trace Family-first Senior Living accepts Medicare, Medicaid, and private pay.

Overview of Bell Trace Family-First Senior Living

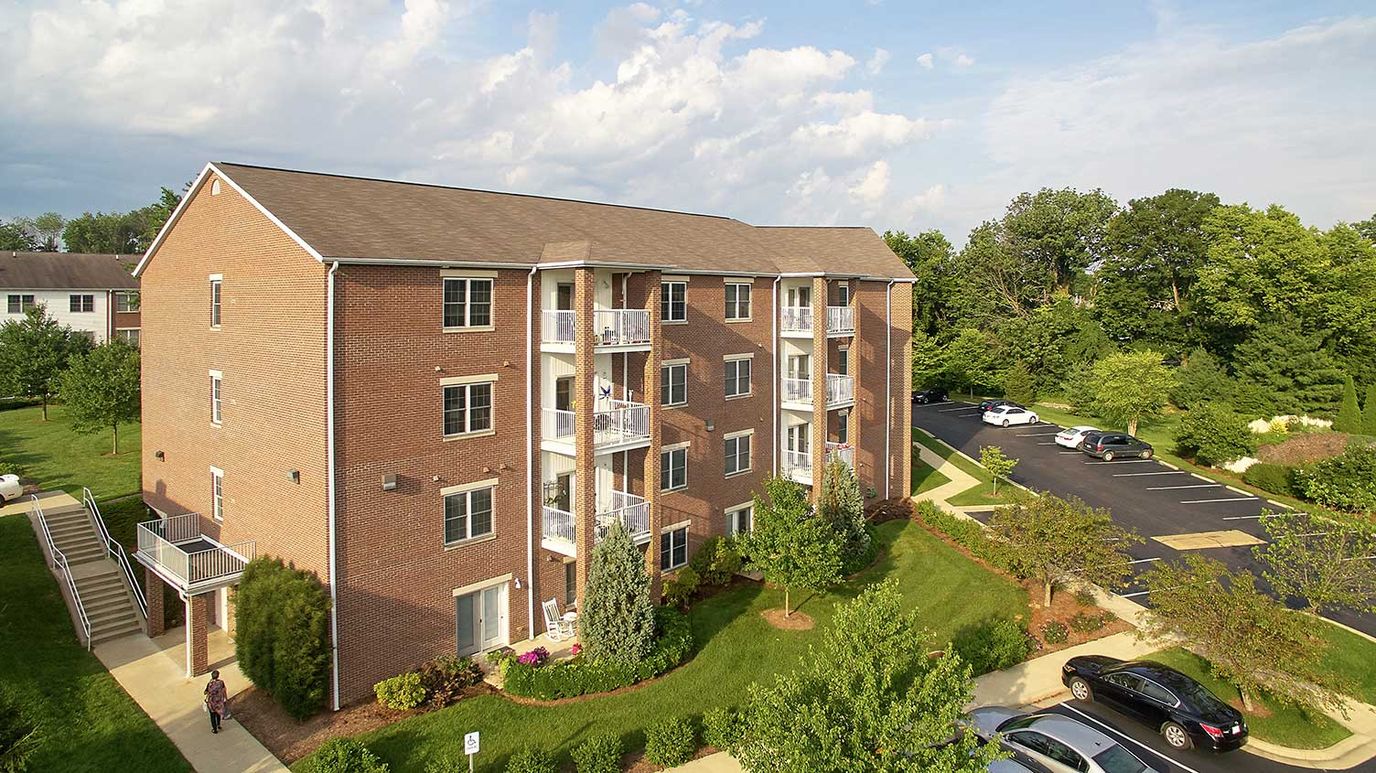
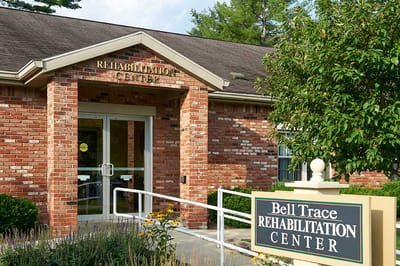
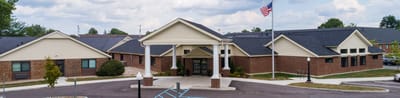
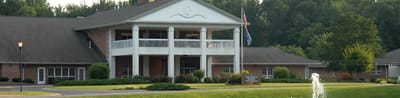
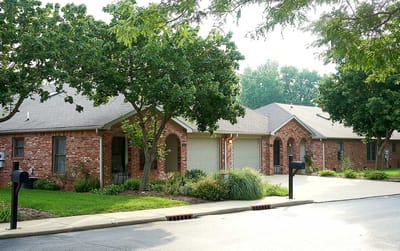
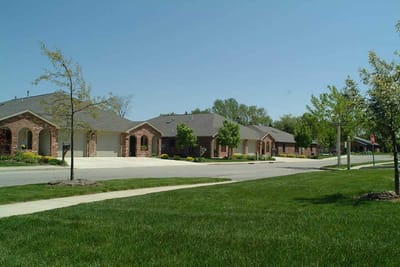
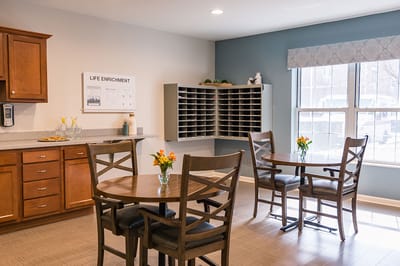
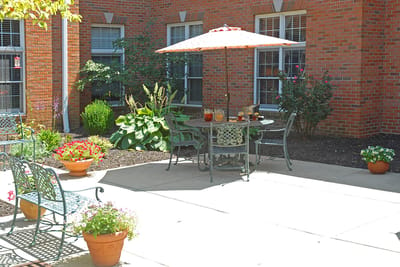
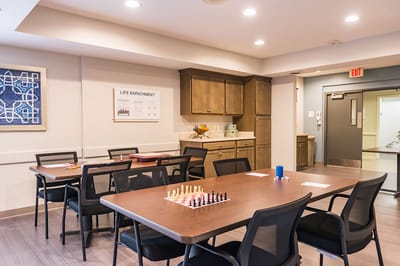
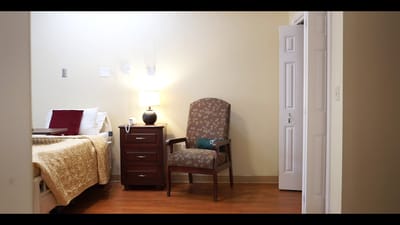
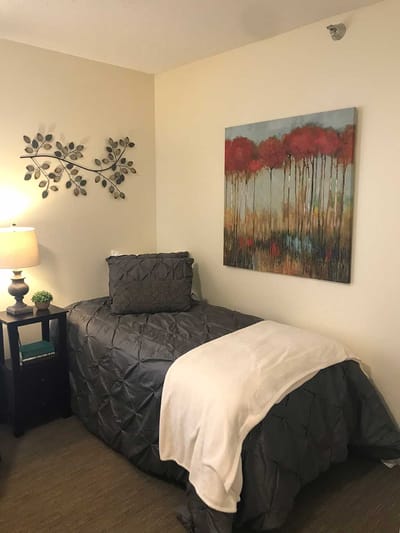
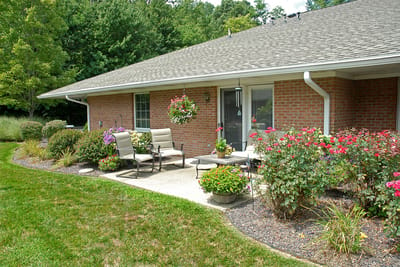
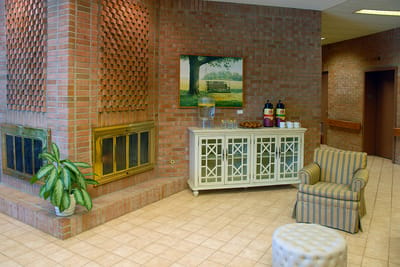
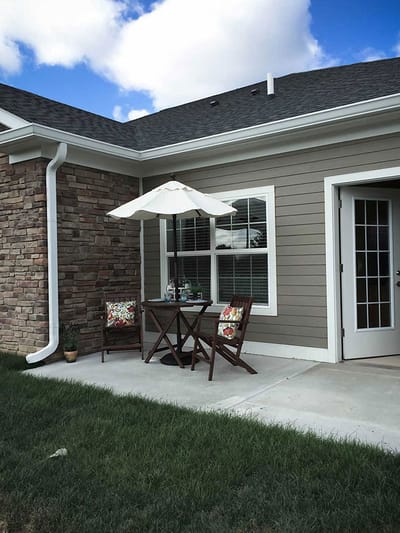
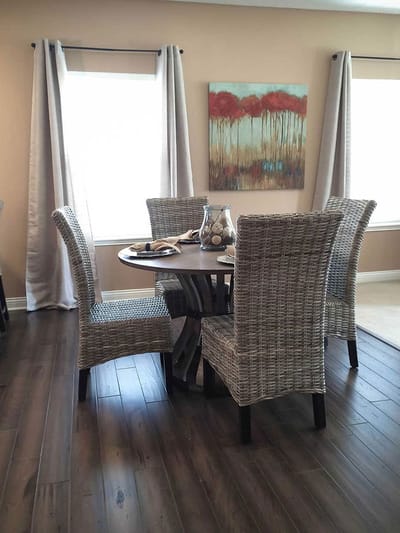
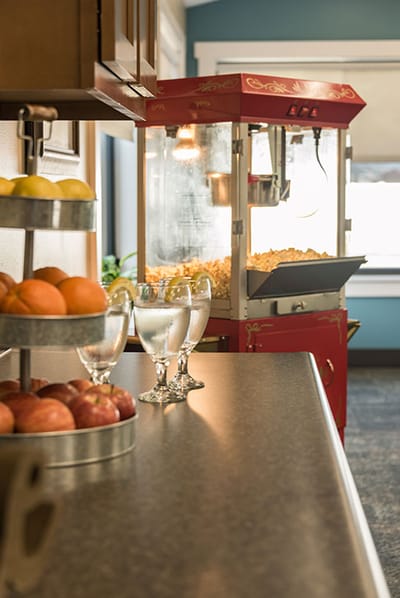
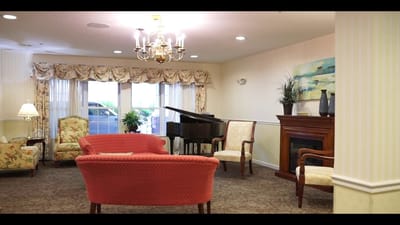
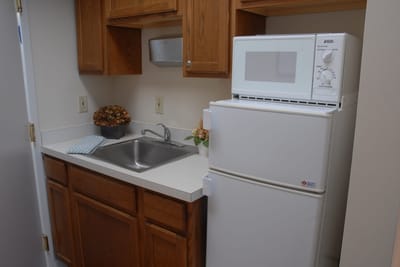
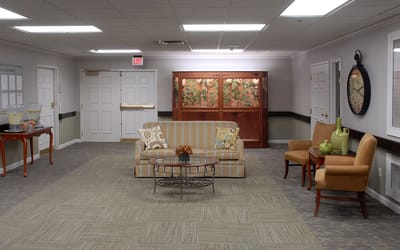
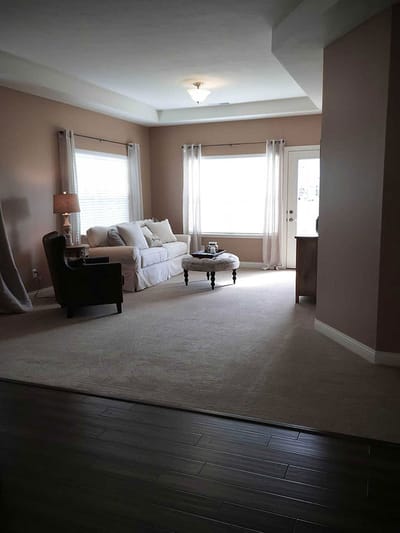
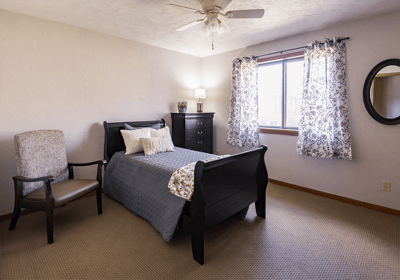
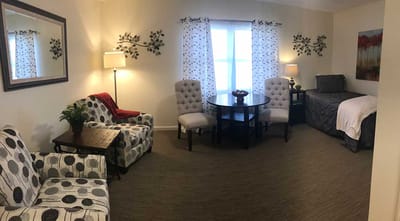
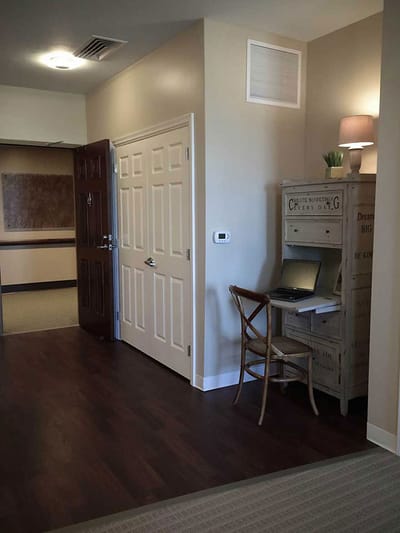
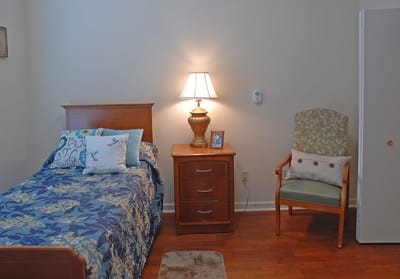
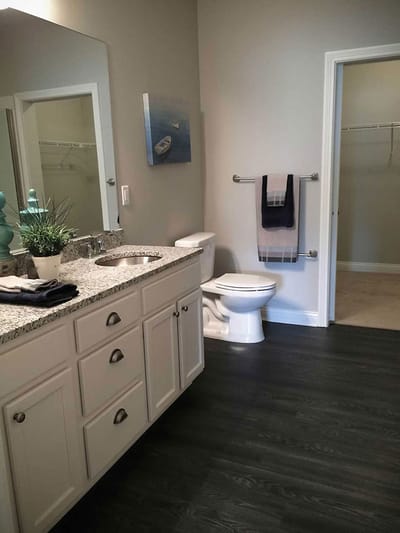
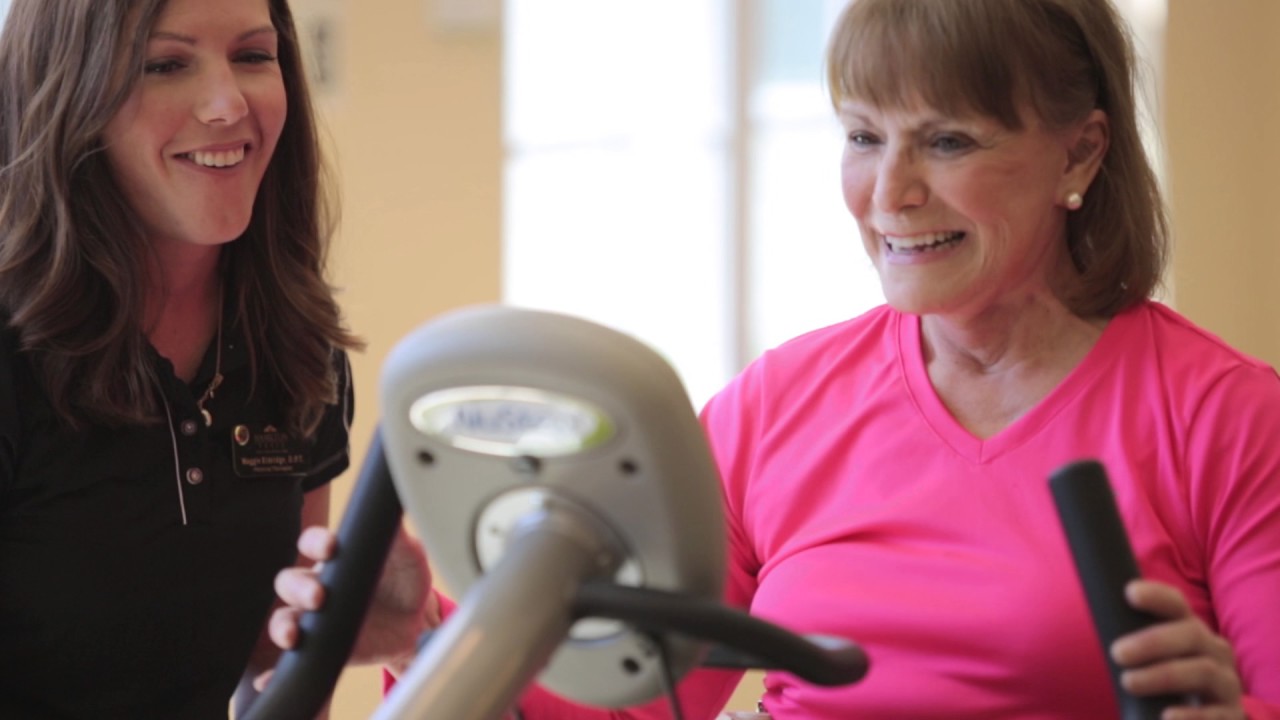
Bell Trace Senior Living approaches retirement living in a person-focused way. As a family-owned community, quality senior care extends to memory care, assisted living, nursing care, and independent living housing options. Its care staff strives to balance professionalism and ensure that residents are treated like family. The level of compassion and service are received exceptionally well by its residents, making it a remarkable environment. Bell Trace guarantees excellent senior care for everyone, all day, every day.

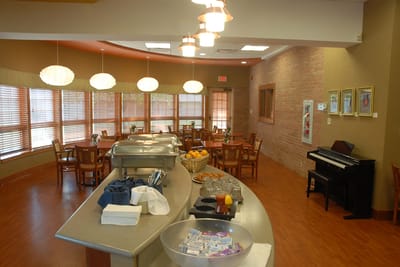
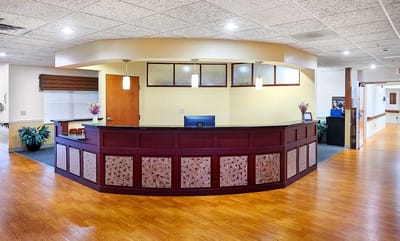
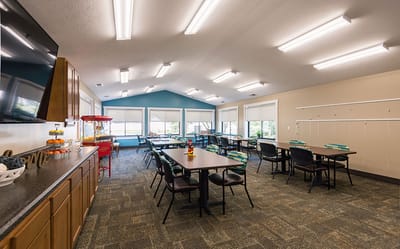
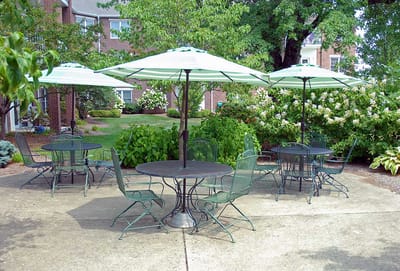
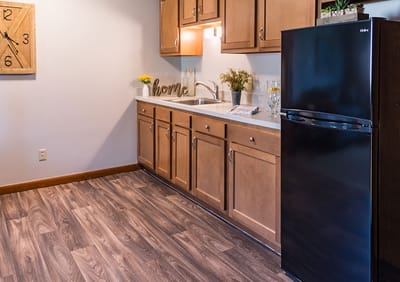
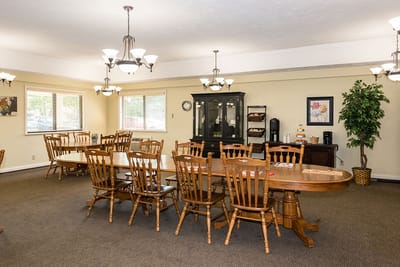
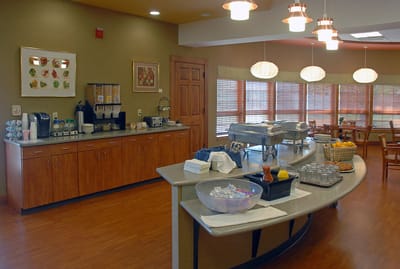
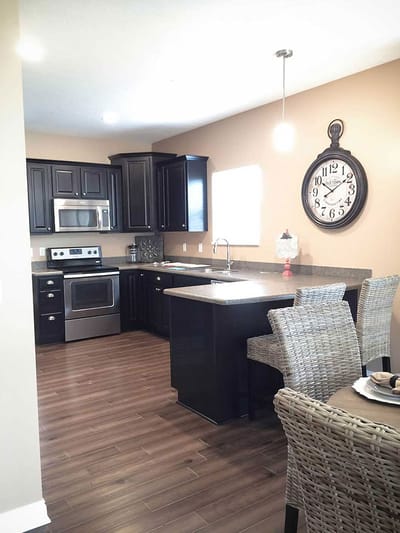
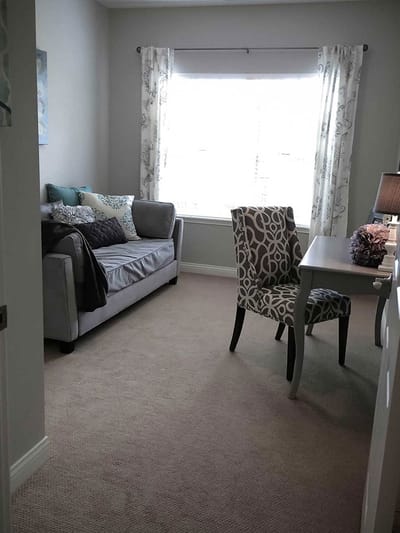
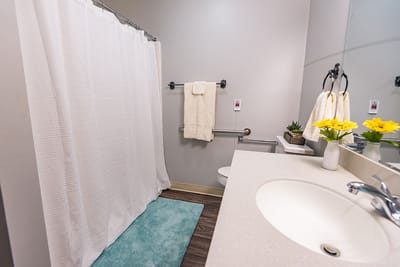
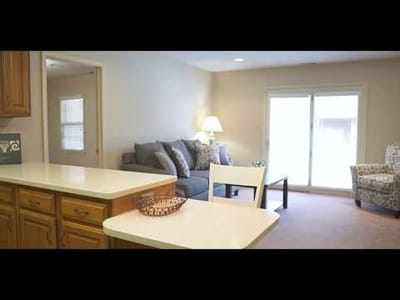
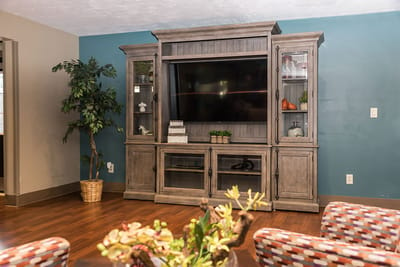
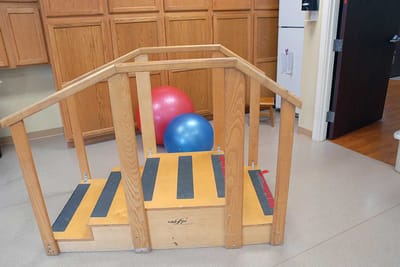
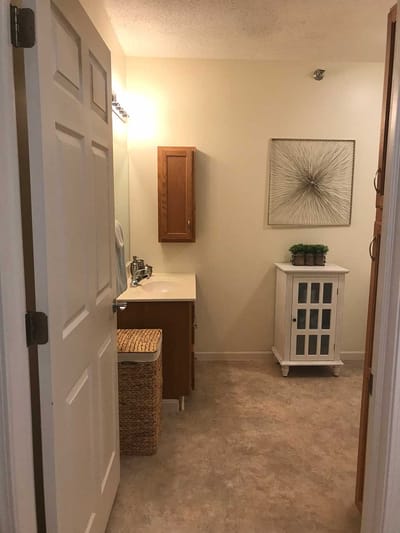
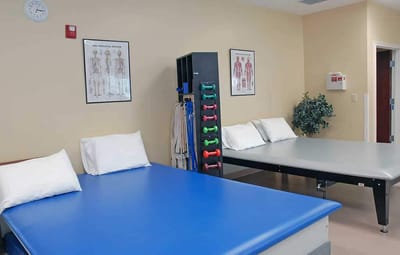
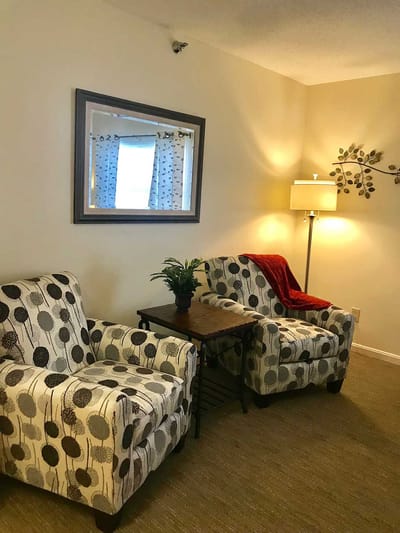
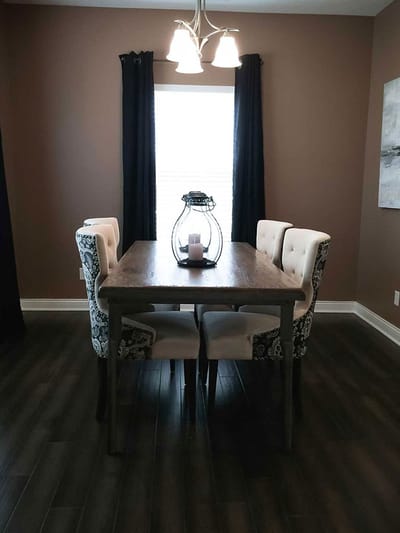
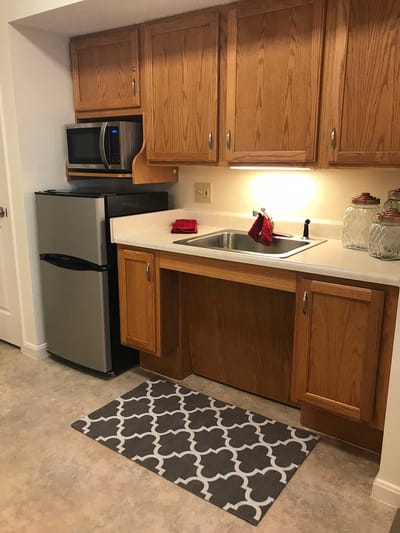
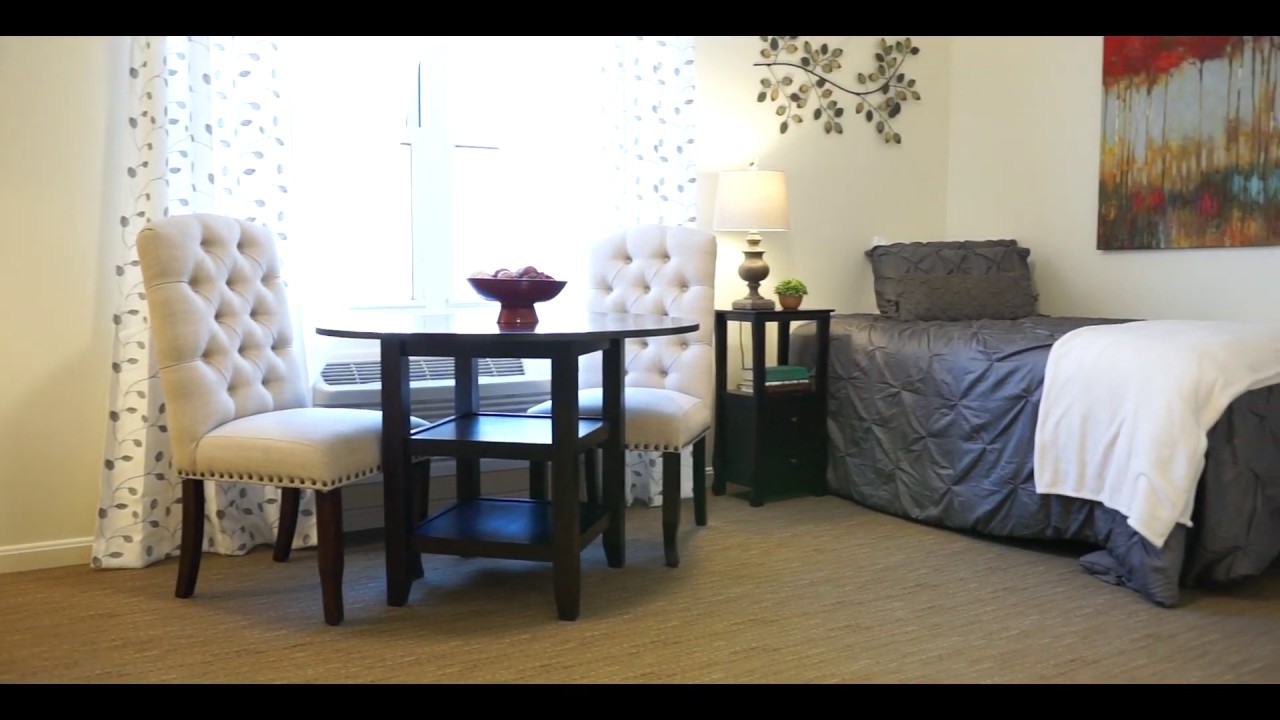
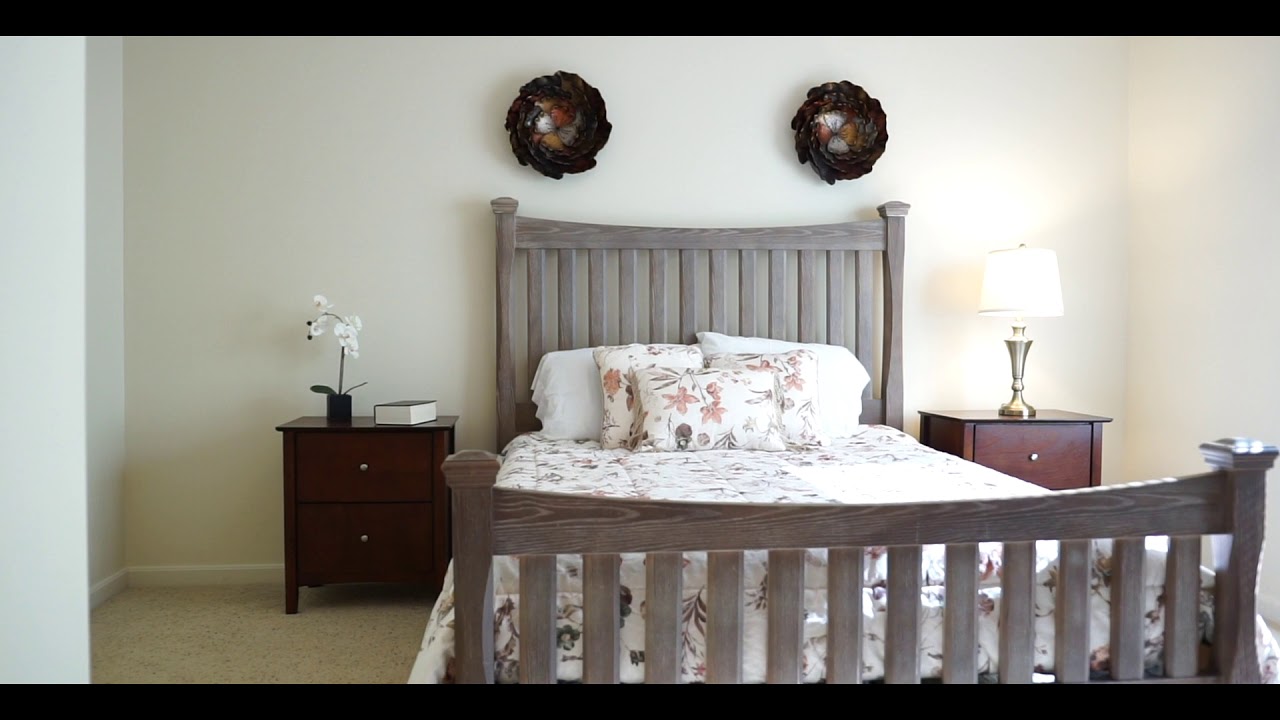
The cozy atmosphere welcomes seniors and their families to a home that ensures they provide the best care possible included in its list of accommodations. A list of programs and support services is available: licensed nurses on-site 24/7, private and semi-private apartment options, delicious home-cooked meals are served daily, scheduled transportation, housekeeping and laundry, respite stays, and adult day programs are offered.

Quality ratings

Measured by Centers for Medicare & Medicaid Services (CMS)

Overall rating Info The Overall CMS Rating combines results from health inspections, staffing levels and quality measures. Health inspections carry the most weight. Staffing and quality scores can increase or decrease the final rating based on performance compared to state and national standards.
▲ 62.1% Above IN avg. ▲ 62.1% Above IN avg.IN average: 3.1Click the badge to see the full State ranking.Click here to see the full State ranking.
Health Inspection Info Based on the results of the facility's three most recent standard inspections and any complaint investigations. CMS reviews the number, scope, and severity of deficiencies, with more recent findings weighted more heavily.
▲ 78.1% Above IN avg. ▲ 78.1% Above IN avg.IN average: 2.8Click the badge to see the full State ranking.Click here to see the full State ranking.
Staffing Info Measures average nursing staff hours per resident per day, including Registered Nurses (RNs) and total nursing staff. Ratings are adjusted based on the level of care residents require and are compared to state and national benchmarks.
▲ 22.0% Above IN avg. ▲ 22.0% Above IN avg.IN average: 2.5Click the badge to see the full State ranking.Click here to see the full State ranking.
Quality Measures Info Based on clinical and physical health indicators reported to CMS, such as hospital readmissions, falls, pressure ulcers, and improvements in mobility. These measures reflect how well residents' health needs are being managed.
▲ 22.3% Above IN avg. ▲ 22.3% Above IN avg.IN average: 4.1Click the badge to see the full State ranking.Click here to see the full State ranking.

Staffing hours breakdown

Info Daily nursing hours per resident by staff type, reported to CMS. Higher is generally better — compare this facility to state and national averages to see where staffing stands.

Hours per resident per day — compared to Indiana state averages

Total nursing care / resident Info This home is ranked 88th out of 291 homes in Indiana for nurse hours. Total adjusted nursing hours per resident per day, combining RN, LPN, and aide time. CMS adjusts this for case-mix so facilities can be fairly compared.
3h 34m per day
Rank #88 / 291Nurse hours — State benchmarkedThis home is ranked 88th out of 291 homes in Indiana. Shows adjusted nurse hours per resident per day benchmarked to the Indiana average, with a ranking across 291 Indiana facilities. More hours mean more direct care. The national average is about 3.5 hrs; below 3.0 is a red flag.Rankings are based only on facilities in Indiana that report data for that category. Facilities without available data are excluded from the ranking.Click the rank badge to see the full State ranking.Click here to see the full State ranking.
This facility Indiana avg (3h 26m per day)
vs Indiana avg
+4%

3 of 6 metrics below state avg

Standout metric Physical Therapist is +187% above state avg
Staff type Hours / Day / Resident vs state avg
Registered Nurse (RN) Info RNs hold the highest nursing license and can assess residents, interpret test results, and direct care plans. More RN hours per day often signals stronger clinical oversight and faster response to health changes. 1h 3m per day ▲ 62% State avg: 39m per day · National avg: 41m per day
LPN / LVN Info Licensed Practical Nurses (LPNs) or Licensed Vocational Nurses (LVNs) deliver routine hands-on care — medication administration, wound dressing, and monitoring vital signs. They work under RN supervision and make up a large share of daily bedside care. 43m per day ▼ 8% State avg: 47m per day · National avg: 52m per day
Nurse Aide Info Certified Nurse Aides (CNAs) provide the most direct day-to-day assistance: bathing, dressing, feeding, and mobility. Nurse aide hours are typically the largest staffing category and directly affect residents' quality of life. 1h 43m per day ▼ 24% State avg: 2h 15m per day · National avg: 2h 20m per day
Weekend Total Nursing Info Combined nursing hours (RN + LPN + Nurse Aide) per resident per day on weekends. Staffing often drops on weekends — this figure reveals whether the facility maintains adequate coverage outside of weekday hours. 3h 8m per day ▼ 4% State avg: 3h 16m per day · National avg: 3h 27m per day
Physical Therapist Info Hours per resident per day provided by licensed Physical Therapists (PTs) or PT Assistants. PT services help residents recover mobility after injury or illness and are especially important for post-acute (short-stay) rehabilitation. 11m per day ▲ 187% State avg: 4m per day · National avg: 4m per day
Weekend RN Info Registered nurse hours specifically on weekends. Facilities sometimes reduce RN presence on Saturdays and Sundays — a low weekend RN figure compared to weekday hours can indicate reduced clinical oversight when most administrative staff are absent. 51m per day ▲ 90% State avg: 27m per day · National avg: 29m per day

Capacity and availability

This home usually has limited availability

Higher occupancy than the Indiana average: 69.4%
Occupancy rate
90.2% Rank #29 / 434Occupancy rate — State benchmarkedThis home is ranked 29th out of 434 homes in Indiana. Shows this facility's occupancy rate versus the Indiana average, with its Statewide rank out of 434. Higher occupancy signals strong local demand and financial stability.Rankings are based only on facilities in Indiana that report data for that category. Facilities without available data are excluded from the ranking.Click the rank badge to see the full State ranking.Click here to see the full State ranking.
Avg. Length of Stay
48 days
Bed community size
90-bed community Rank #286 / 437Bed count — State benchmarkedThis home is ranked 286th out of 437 homes in Indiana. Shows this facility's certified or reported bed count compared to other Indiana facilities. Larger communities may offer more amenities, programs, and on-site services for residents and families.Rankings are based only on facilities in Indiana that report data for that category. Facilities without available data are excluded from the ranking.Click the rank badge to see the full State ranking.Click here to see the full State ranking.
A larger shared setting that may offer more common spaces and organized community services.
Walk Score
Walk Score: 29 / 100 Rank #337 / 587Walk Score — State benchmarkedThis home is ranked 337th out of 587 homes in Indiana. Shows how walkable this facility's neighborhood is compared to the average Walk Score across Indiana facilities. Higher scores benefit residents, families, and staff.Rankings are based only on facilities in Indiana that report data for that category. Facilities without available data are excluded from the ranking.Click the rank badge to see the full State ranking.Click here to see the full State ranking.
Somewhat walkable. A few nearby services may be reachable on foot, but most trips require transportation.

About this community

Awards

five-star rating

Safety & Compliance

Secured Perimeter
Grab Bars
Emergency SystemsYes
Safety FeaturesSmoke detectors with sprinkler system and fire alarm, 24-hour emergency response system

Therapy & Rehabilitation

3 services
Rehabilitation Services
Respite Care
Short-Term Rehab

Staffing & Medical

1 service
24-Hour Staffing

Amenities & Lifestyle

Fitness Center
Gym
Salon
Barber
Dining Room
Restaurant
Bistro
Transportation
Concierge
Housekeeping
Laundry
Linen Service
Private Dining
Activities
Wellness Programrehabilitative therapies, long term care, home health care, hospice
Specific Programsart classes, exercise classes, social, cultural, and educational programs and activities
Religious Services

Pricing & Financial Information

Starting PriceCall for Details per month

Contact Bell Trace Family-first Senior Living

Staffing Data

Reporting period: October 1 – December 31, 2025 (Q4 2025). Source: CMS Payroll-Based Journal report.

Total staff 137
Employees 99
Contractors 38
Staff to resident ratio 1.67 : 1
1670632% more staff per resident than Indiana average
Indiana average ratio: 0.00 : 1 Indiana average ratio: 0.00 : 1See full Indiana ranking
Avg staff/day 41
Average shift 8.4 hours
9% better than Indiana average
Indiana average: 7.7 hours Indiana average shift: 7.7 hoursSee full Indiana ranking
Total staff hours (quarter) 31,770

Nursing staff breakdown

Q4 2025 · Oct 1 – Dec 31 More info This data comes from the CMS Payroll-Based Journal report covering October 1 – December 31, 2025.
Registered Nurse

Manages medical care and health needs.

RN Staff Info All 23 RN Staff are full-time employees. No contractors work on this role. 23
Average shift length Info Average shift length. Calculated as total hours divided by days worked and average staff per day. 8.7 hours
Licensed Practical Nurse

Assists with medical care and medications.

LPN Staff Info All 13 LPN Staff are full-time employees. No contractors work on this role. 13
Average shift length Info Average shift length. Calculated as total hours divided by days worked and average staff per day. 10.2 hours
Certified Nursing Assistant

Helps with daily care and mobility.

CNA Staff Info All 40 CNA Staff are full-time employees. No contractors work on this role. 40
Average shift length Info Average shift length. Calculated as total hours divided by days worked and average staff per day. 9.5 hours

Contractor staffing

Q4 2025 · Oct 1 – Dec 31 More info This data comes from the CMS Payroll-Based Journal report covering October 1 – December 31, 2025.

Total hours from contractors

15%

4,764 contractor hours this quarter

Respiratory Therapy Technician: 10 Physical Therapy Aide: 9 Speech Language Pathologist: 8 Physical Therapy Assistant: 6 Qualified Social Worker: 3 Qualified Activities Professional: 2

Staff by category

Q4 2025 · Oct 1 – Dec 31 More info This data comes from the CMS Payroll-Based Journal report covering October 1 – December 31, 2025.
Certified Nursing Assistant 40 0 40 11,269 92 100% 9.5
Registered Nurse 23 0 23 6,334 92 100% 8.7
Licensed Practical Nurse 13 0 13 4,753 92 100% 10.2
Respiratory Therapy Technician 0 10 10 1,254 89 97% 5.1
Physical Therapy Assistant 0 6 6 1,180 85 92% 6.5
Speech Language Pathologist 0 8 8 1,040 75 82% 6.2
Dental Services Staff 2 0 2 938 63 68% 8.8
Physical Therapy Aide 0 9 9 781 76 83% 6
Clinical Nurse Specialist 7 0 7 694 64 70% 7.9
Medication Aide/Technician 3 0 3 665 70 76% 8.7
Dietitian 1 0 1 503 65 71% 7.7
Administrator 1 0 1 472 59 64% 8
Nurse Practitioner 1 0 1 456 57 62% 8
Qualified Social Worker 0 3 3 417 67 73% 6
RN Director of Nursing 3 0 3 374 49 53% 6.5
Other Dietary Services Staff 3 0 3 340 60 65% 5.6
Nurse Aide in Training 2 0 2 208 25 27% 8.3
Qualified Activities Professional 0 2 2 93 14 15% 6.6
40 Certified Nursing Assistant
% of Days 100%
23 Registered Nurse
% of Days 100%
13 Licensed Practical Nurse
% of Days 100%
10 Respiratory Therapy Technician
% of Days 97%
6 Physical Therapy Assistant
% of Days 92%
8 Speech Language Pathologist
% of Days 82%
2 Dental Services Staff
% of Days 68%
9 Physical Therapy Aide
% of Days 83%
7 Clinical Nurse Specialist
% of Days 70%
3 Medication Aide/Technician
% of Days 76%
1 Dietitian
% of Days 71%
1 Administrator
% of Days 64%
1 Nurse Practitioner
% of Days 62%
3 Qualified Social Worker
% of Days 73%
3 RN Director of Nursing
% of Days 53%
3 Other Dietary Services Staff
% of Days 65%
2 Nurse Aide in Training
% of Days 27%
2 Qualified Activities Professional
% of Days 15%

Penalties and fines

Federal penalties imposed by CMS for regulatory violations, including civil money penalties (fines) and denials of payment for new Medicare/Medicaid admissions.

Source: CMS Penalties Database

No penalties in the past 3 years

No civil money penalties or payment denials were reported in the last 3 years.

Quality of care over time

These measures show how residents usually do over time at this home, based on health outcomes and preventive care.

High-risk clinical events score Info A composite score based on pressure ulcers, falls with injury, weight loss, walking ability decline, and activities of daily living decline. 10.8
35% worse than Indiana average

Indiana average: 8.0

Functional decline score Info A composite score based on activities of daily living decline, walking ability decline, and incontinence. 21.7
27% worse than Indiana average

Indiana average: 17.1

Long-stay resident measures
Need for Help with Daily Activities Increased Info Percent of long-stay residents whose need for help with daily activities has increased 8.9%
26% better than Indiana average

Indiana average: 12.0%

Walking Ability Worsened Info Percent of long-stay residents whose ability to move independently worsened 31.5%
119% worse than Indiana average

Indiana average: 14.4%

Low Risk Residents with Bowel/Bladder Incontinence Info Percent of low risk long-stay residents who lose control of their bowels or bladder 24.8%
In line with Indiana average

Indiana average: 24.6%

Falls with Major Injury Info Percent of long-stay residents experiencing one or more falls with major injury 3.3%
14% better than Indiana average

Indiana average: 3.9%

High Risk Residents with Pressure Ulcers Info Percent of long-stay high risk residents with pressure ulcers 6.9%
58% worse than Indiana average

Indiana average: 4.4%

Urinary Tract Infection Info Percent of long-stay residents with a urinary tract infection 0.5%
61% better than Indiana average

Indiana average: 1.2%

Lost Too Much Weight Info Percent of long-stay residents who lose too much weight 3.4%
40% better than Indiana average

Indiana average: 5.7%

Depressive Symptoms Info Percent of long-stay residents who have depressive symptoms 0.0%
100% better than Indiana average

Indiana average: 24.1%

Antipsychotic Use Info Percent of long-stay residents who received an antipsychotic medication 5.7%
54% better than Indiana average

Indiana average: 12.4%

Pneumococcal Vaccine Info Percent of long-stay residents assessed and appropriately given the pneumococcal vaccine 100.0%
7% better than Indiana average

Indiana average: 93.7%

Influenza Vaccine Info Percent of long-stay residents assessed and appropriately given the seasonal influenza vaccine 100.0%
5% better than Indiana average

Indiana average: 95.4%

Short-stay resident measures
Pneumococcal Vaccine Info Percent of short-stay residents assessed and appropriately given the pneumococcal vaccine 100.0%
22% better than Indiana average

Indiana average: 81.7%

Antipsychotic medication increase Info Percent of short-stay residents who newly received an antipsychotic medication 0.0%
100% better than Indiana average

Indiana average: 1.4%

Influenza Vaccine Info Percent of short-stay residents assessed and appropriately given the seasonal influenza vaccine 99.1%
25% better than Indiana average

Indiana average: 79.0%

Breakdown by payment type

Medicare

48% of new residents, usually for short-term rehab.

Typical stay 24 days

Private pay

49% of new residents, often for short stays.

Typical stay 1 - 2 months

Medicaid

3% of new residents, often for long-term daily care.

Typical stay 2 years

Facility Characteristics

Source: CMS Long-Term Care Facility Characteristics (Data as of Jan 2026)

Total residents 82
Medicare
15
18.3% of residents
Medicaid
33
40.2% of residents
Private pay or other
34
41.5% of residents
Programs & Services
Residents Group

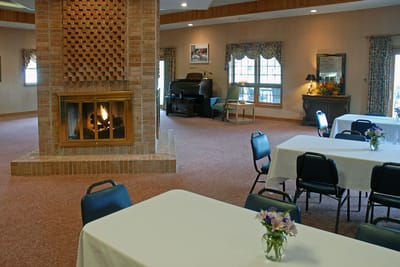
Residents meet regularly to discuss policies, care quality, and activities

Nurse Aide Training

State-approved Nurse Aide Training and Competency Evaluation Program on-site

Active Resident Council

Organized group of residents that meets regularly to discuss facility policies, quality of life, and activities.

Finances and operations

Based on CMS SNF Cost Report for fiscal year ending in 12/2023.

Government
Operated by federal authorities.
Net patient revenue Info Net patient revenue — what the home actually collects for resident care, after contractual allowances, bad debt and discounts are subtracted from its gross charges (CMS cost report, Worksheet G-3). It covers resident care only; money the home earns from other sources is shown separately as "Other income."
$11.9M
Net patient income Info Net patient income: net patient revenue minus the home's total operating expenses. A positive figure means it earns more from resident care than it spends to deliver it; a negative figure means the opposite. It excludes non-operating "other income."
$91.5K
Government Operated by federal authorities.
Net patient revenue Info Net patient revenue — what the home actually collects for resident care, after contractual allowances, bad debt and discounts are subtracted from its gross charges (CMS cost report, Worksheet G-3). It covers resident care only; money the home earns from other sources is shown separately as "Other income."
$11.9M Rank #39 / 294Revenue — State benchmarkedThis home is ranked 39th out of 294 homes in Indiana. Shows this facility's annual revenue compared to the Indiana average. Higher revenue generally means more resources for staffing and capital — read alongside Payroll %.Rankings are based only on facilities in Indiana that report data for that category. Facilities without available data are excluded from the ranking.Click the rank badge to see the full State ranking.Click here to see the full State ranking.
Net patient income Info Net patient income: net patient revenue minus the home's total operating expenses. A positive figure means it earns more from resident care than it spends to deliver it; a negative figure means the opposite. It excludes non-operating "other income."
$91.5K
Other income Info Money the home earns outside of resident care — such as investments, grants, rentals and other non-operating sources (CMS cost report, Worksheet G-3). It is tracked separately from net patient revenue: it is not part of that figure, and it is not included in net patient income.
$46.0K
Payroll costs Info Staff salaries plus wage-related costs — benefits such as payroll taxes, health insurance and retirement — from the home's own accounting records (CMS cost report, Worksheet A). Contract or agency labor is counted separately, under other operating costs. Rank #81 / 294Payroll — State benchmarkedThis home is ranked 81st out of 294 homes in Indiana. Shows total annual staff payroll benchmarked to the Indiana average. Higher payroll investment relative to peers often signals better staffing and less reliance on cheaper contract labor.Rankings are based only on facilities in Indiana that report data for that category. Facilities without available data are excluded from the ranking.Click the rank badge to see the full State ranking.Click here to see the full State ranking.
$5.5M 46.5% of net patient revenue Info Payroll as a share of revenue: staff salaries and wage-related benefits divided by net patient revenue. A higher figure means more of each revenue dollar goes to staff pay. Rank #259 / 294Payroll % — State benchmarkedThis home is ranked 259th out of 294 homes in Indiana. Shows payroll as a percentage of revenue versus the Indiana average. Well-run Indiana facilities typically land around 54–68% — the top third Statewide. Below 25% may signal understaffing or heavy agency use — read with Staffing ratings.Rankings are based only on facilities in Indiana that report data for that category. Facilities without available data are excluded from the ranking.Click the rank badge to see the full State ranking.Click here to see the full State ranking.
Other operating costs Info Everything it costs to run the home apart from payroll — food, utilities, supplies, maintenance, contract labor and administration. Calculated as total operating expense minus payroll (staff salaries and wage-related benefits).
$6.2M
Total costs Info The home's total operating expense for the year — all the costs of running it, salaries included (CMS cost report, Worksheet G-3).
$11.8M

What does this home offer?

Housing options icon

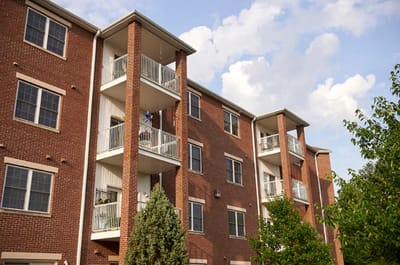
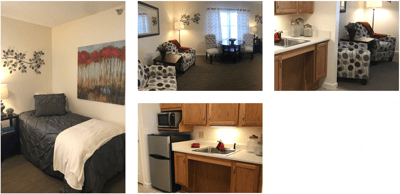
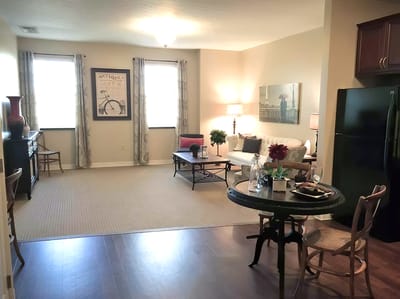
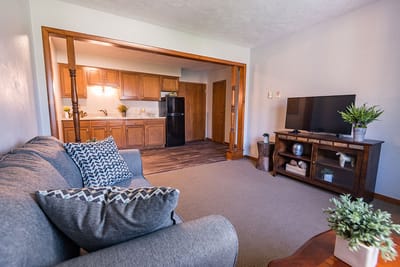
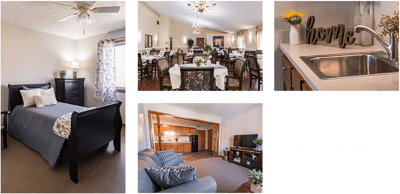
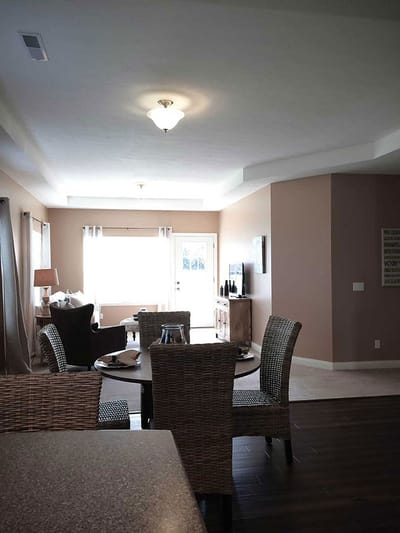
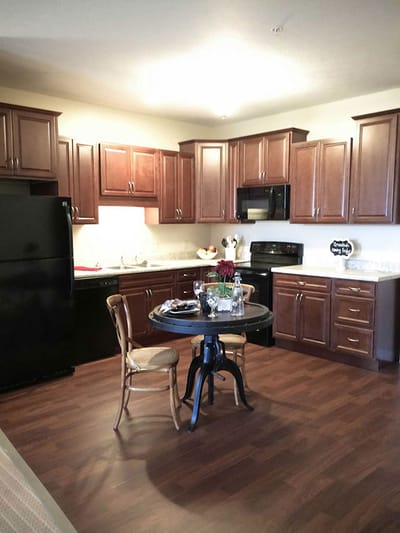
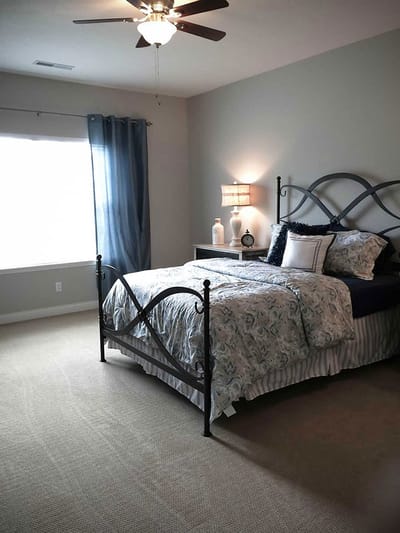
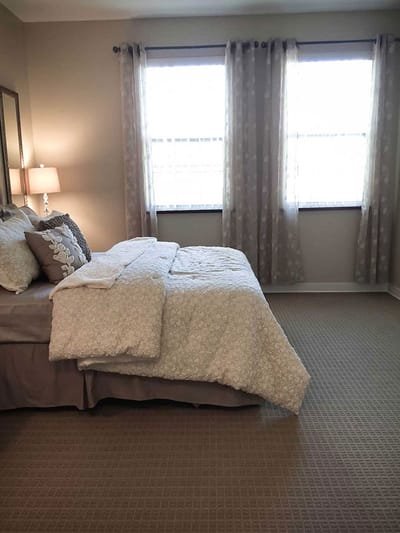
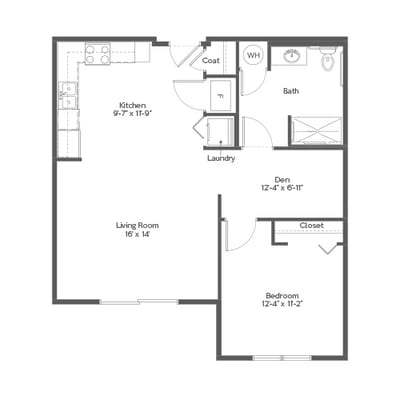
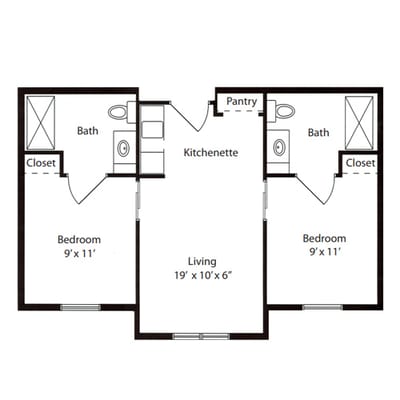
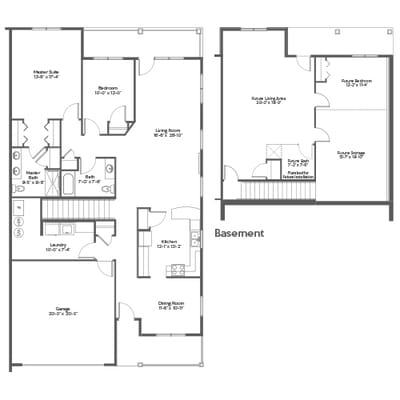
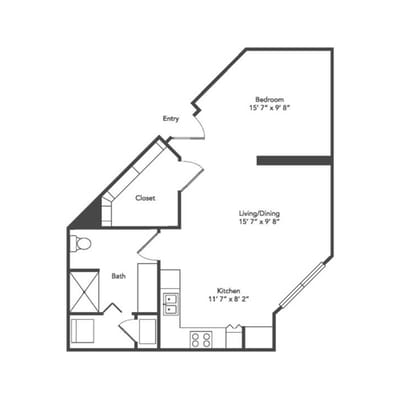
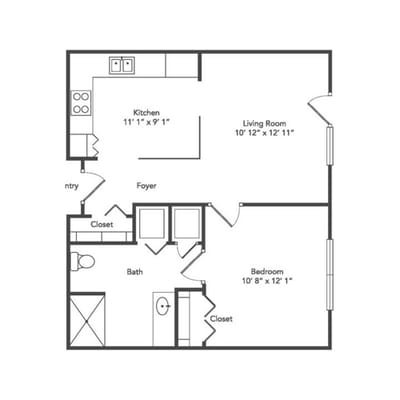
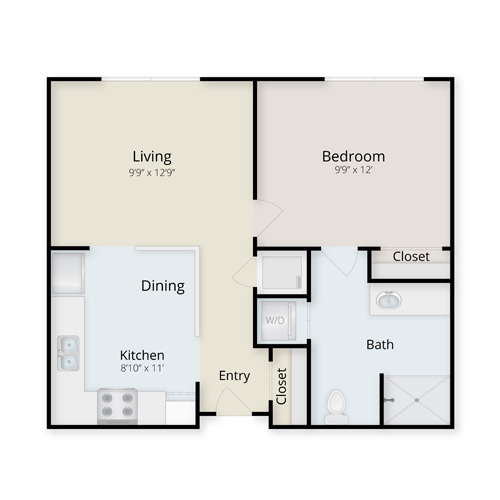
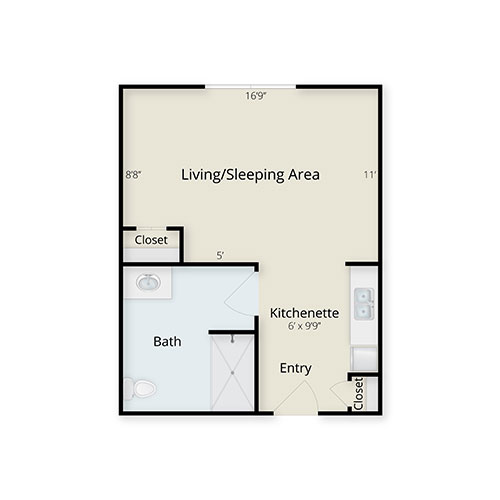
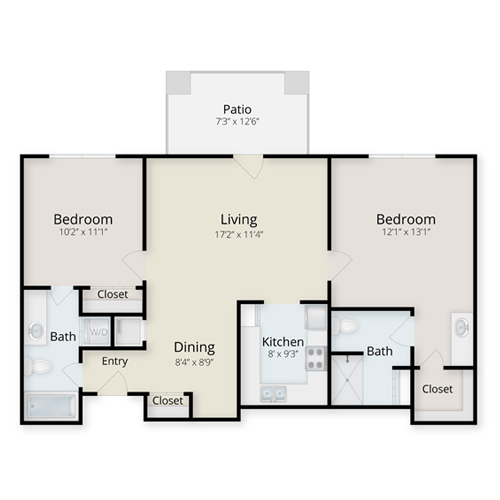
Housing Options: Private Rooms / Semi-Private Rooms

Building type icon
Building type icon

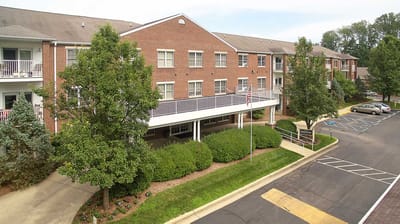
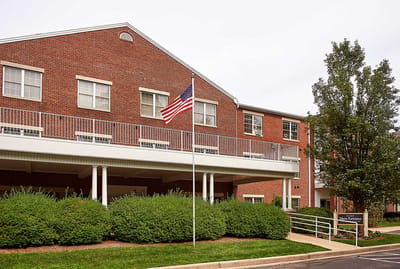
Building Type: Mid-rise

Transportation services icon

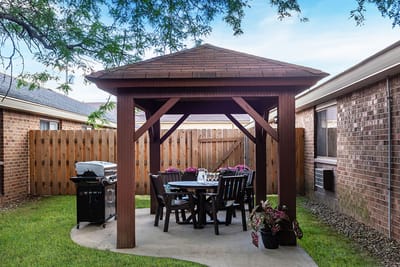
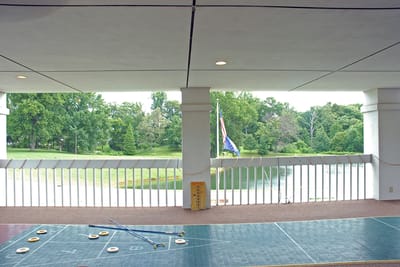
Transportation Services

Fitness and recreation icon

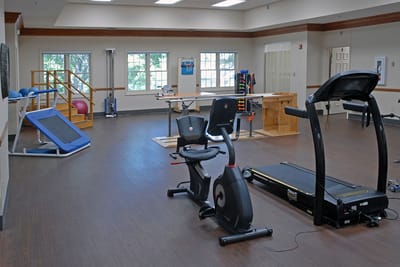
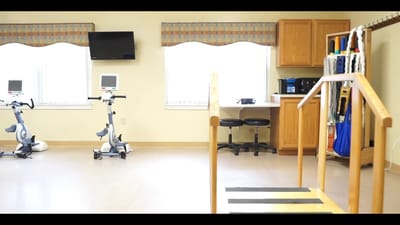
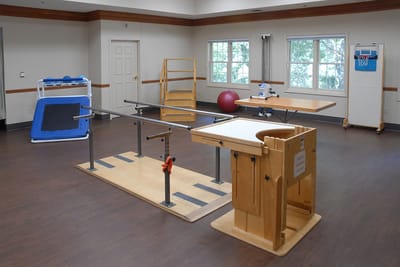
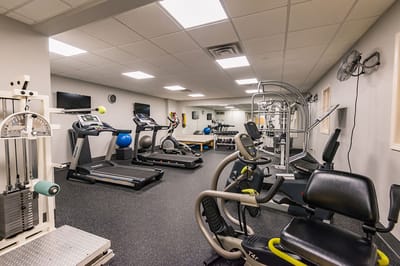
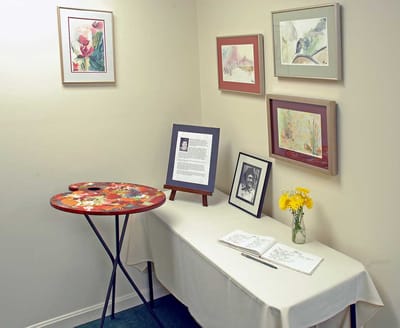
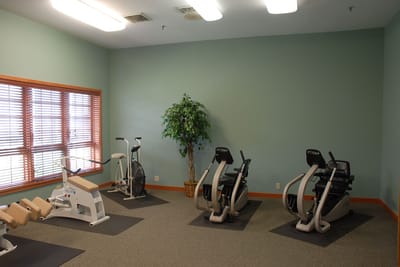
Fitness and Recreation

Who this home usually serves

TYPE OF STAY

Mix of rehab and long-term care

This home supports both short-term rehab and long-term care, with residents staying for a wide range of durations.

New residents most often arrive under private pay (49% of admissions), and a typical private pay stay runs around 1 - 2 months.

Admissions
526 total

Coverage residents most often arrive under.

Medicare 48%
Private pay 49%
Medicaid 3%
Discharges
584 total

Coverage residents most often leave under.

Medicare 40%
Private pay 52%
Medicaid 8%

Managed by Daniel W. Moore

Administrator

Daniel W. Moore is a licensed health facility administrator who has served as administrator of CarDon’s Health & Living Communities, including Bell Trace. He coordinated the planning and construction of Bell Trace and brings extensive leadership experience in senior living community administration.

Living Spaces & Floor Plans for Bell Trace Family-first Senior Living

Studio

Places of interest near Bell Trace Family-first Senior Living

Address 2.6 miles from city center Info Estimated distance in miles from Bloomington's city center to Bell Trace Family-first Senior Living's address, calculated via Google Maps.

Calculate Travel Distance to Bell Trace Family-first Senior Living

Add your location

Address

Compare Nursing Homes around Bloomington

The information below is reported by the Indiana Department of Health, Division of Long Term Care.

5 facilities compared · CMS & IN Dept. of Health data

Stonecroft Health Campus
NH
ADC
AL
MC
RC
Bloomington
124
Facility 124
IN AVG 116
Rank #157 / 437
84.7%
Facility 84.7%
IN AVG 69.4%
Rank #388 / 434
+22%
3.59
Facility 3.59
IN AVG 3.44
Rank #88 / 291
+18% +4%
$0
Facility $0
IN AVG $31.4k
Rank #1 / 293
91
Facility 91
IN AVG 83
Rank #71 / 384
4
Facility 4
IN AVG 25.0
Rank #7 / 292
2.0
Facility 2.0
IN AVG 4.1
Rank #25 / 292
- 105 A+
9
Facility 9
IN AVG 37
Rank #473 / 587
Daviess County Hospital
$10.6M
Facility $10.6M
IN AVG $10.7M
Rank #139 / 294
$5.2M
Facility $5.2M
IN AVG $4.2M
Rank #125 / 294
49.7%
Facility 49.7%
IN AVG 42%
Rank #151 / 294
155838
Bell Trace Family-first Senior Living
NH
AL
HC
IL
RC
Bloomington
90
Facility 90
IN AVG 116
Rank #286 / 437
90.2%
Facility 90.2%
IN AVG 69.4%
Rank #29 / 434
+30%
3.57
Facility 3.57
IN AVG 3.44
Rank #88 / 291
+71% +4%
$0
Facility $0
IN AVG $31.4k
Rank #1 / 293
-
4
Facility 4
IN AVG 25.0
Rank #7 / 292
4.0
Facility 4.0
IN AVG 4.1
Rank #153 / 292
- 77 -
29
Facility 29
IN AVG 37
Rank #337 / 587
-
$11.9M
Facility $11.9M
IN AVG $10.7M
Rank #39 / 294
$5.5M
Facility $5.5M
IN AVG $4.2M
Rank #81 / 294
46.5%
Facility 46.5%
IN AVG 42%
Rank #259 / 294
155677
Majestic Care of Bloomington
NH
HC
MC
RC
Bloomington
224
Facility 224
IN AVG 116
Rank #21 / 437
50.0%
Facility 50.0%
IN AVG 69.4%
Rank #348 / 434
-28%
2.95
Facility 2.95
IN AVG 3.44
Rank #232 / 291
-30% -14%
$0
Facility $0
IN AVG $31.4k
Rank #1 / 293
89
Facility 89
IN AVG 83
Rank #89 / 384
6
Facility 6
IN AVG 25.0
Rank #17 / 292
2.0
Facility 2.0
IN AVG 4.1
Rank #25 / 292
- 108 -
44
Facility 44
IN AVG 37
Rank #249 / 587
Columbus Regional Hospital
$12.4M
Facility $12.4M
IN AVG $10.7M
Rank #115 / 294
$5.8M
Facility $5.8M
IN AVG $4.2M
Rank #110 / 294
46.6%
Facility 46.6%
IN AVG 42%
Rank #165 / 294
155019
Brickyard Healthcare – Bloomington Care Center
NH
MC
RC
Bloomington (Sunny Slopes)
153
Facility 153
IN AVG 116
Rank #83 / 437
72.5%
Facility 72.5%
IN AVG 69.4%
Rank #169 / 434
+4%
3.46
Facility 3.46
IN AVG 3.44
Rank #107 / 291
-1% +1%
$9.1k
Facility $9.1k
IN AVG $31.4k
Rank #253 / 293
69
Facility 69
IN AVG 83
Rank #341 / 384
26
Facility 26
IN AVG 25.0
Rank #164 / 292
2.6
Facility 2.6
IN AVG 4.1
Rank #59 / 292
2 125 -
33
Facility 33
IN AVG 37
Rank #313 / 587
Ggnsc Bloomington LLC
$16.2M
Facility $16.2M
IN AVG $10.7M
Rank #91 / 294
$6.4M
Facility $6.4M
IN AVG $4.2M
Rank #68 / 294
39.7%
Facility 39.7%
IN AVG 42%
Rank #108 / 294
155278
Bloomington Nursing & Rehabilitation Center
NH
HC
RC
Bloomington (Barclay Gardens)
38
Facility 38
IN AVG 116
Rank #424 / 437
74.3%
Facility 74.3%
IN AVG 69.4%
Rank #154 / 434
+7%
2.26
Facility 2.26
IN AVG 3.44
Rank #286 / 291
+9% -34%
$0
Facility $0
IN AVG $31.4k
Rank #1 / 293
-
29
Facility 29
IN AVG 25.0
Rank #187 / 292
4.1
Facility 4.1
IN AVG 4.1
Rank #167 / 292
- 32 -
64
Facility 64
IN AVG 37
Rank #115 / 587
Aperion Care Monroe, LLC
$3.6M
Facility $3.6M
IN AVG $10.7M
Rank #285 / 294
$1.3M
Facility $1.3M
IN AVG $4.2M
Rank #284 / 294
36.4%
Facility 36.4%
IN AVG 42%
Rank #43 / 294
155532

Financial Assistance for
Nursing Home in Indiana

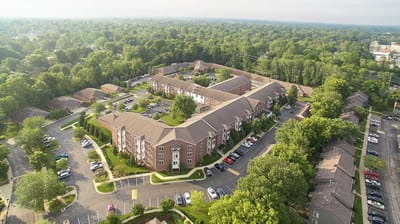
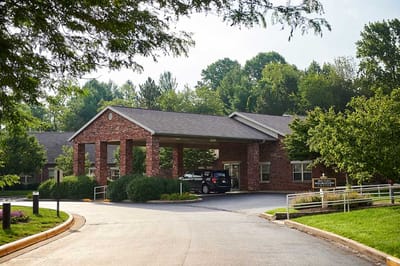
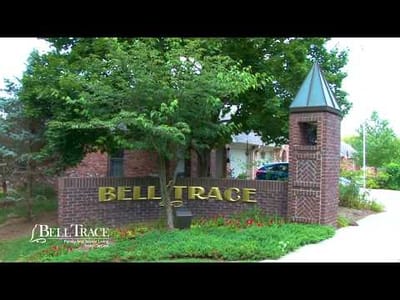
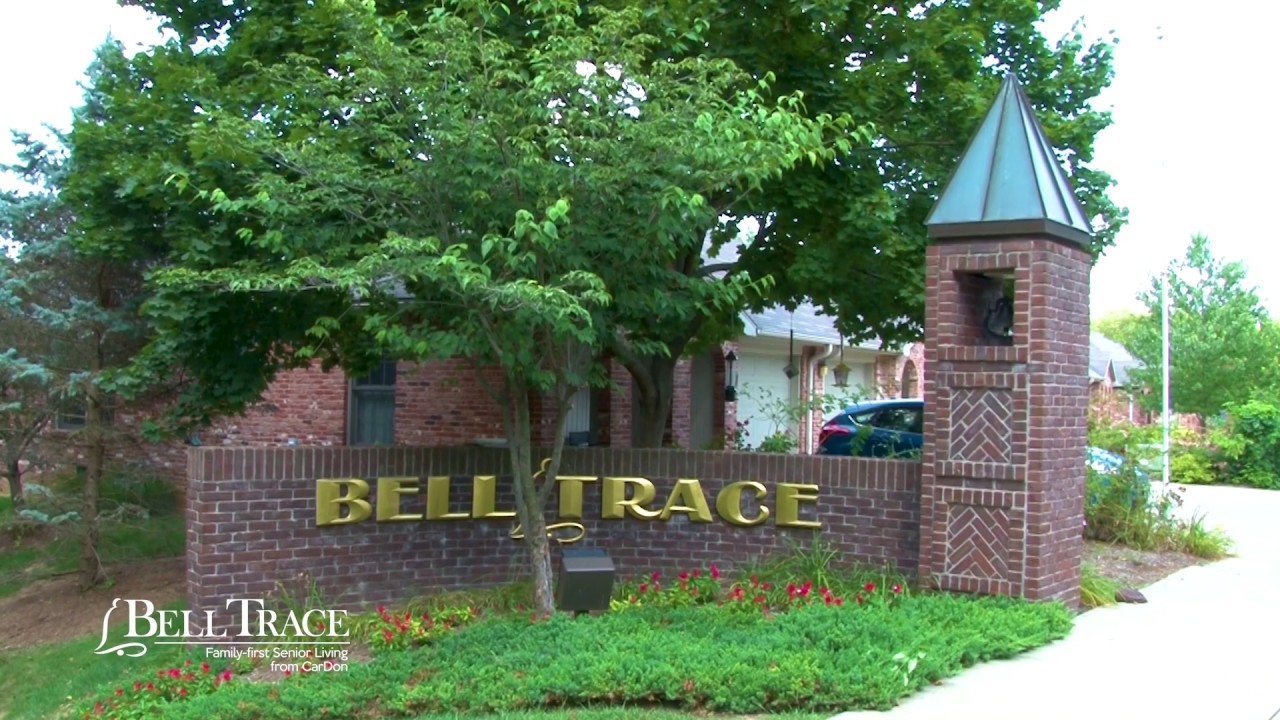
Bell Trace Family-first Senior Living is located in Bloomington, Indiana.
Here are the financial assistance programs available to residents in Indiana.

Get Financial aid guidance

Aged and Disabled Waiver

Indiana Medicaid A&D Waiver

Age 65+ or disabled
General Indiana resident, Medicaid-eligible, nursing home-level care need.
Income Limits (2025) ~$2,829/month 300% FBR, individual
Asset Limits $2,000 (individual), $3,000 (couple).
IN

Requires level-of-care determination.

Benefits
Personal care (5-7 hours/day) Respite (240 hours/year) Adult day care (~$60/day) Home health services

CHOICE Program

Indiana CHOICE

Age 60+
General Indiana resident, at risk of nursing home.
Income Limits ~$2,000/month varies
Asset Limits $10,000 individual
IN

Limited funding; regional variation.

Benefits
In-home care (3-5 hours/week) Respite (up to 10 days/year) Transportation (~5 trips/month)

Residential Care Assistance Program (RCAP)

Indiana Residential Care Assistance Program

Age 65+
General or blind, or disabled, Indiana resident, in approved facility, low-income or SSI recipient.
Income Limits (2025) ~$1,004/month including SSI
Asset Limits $2,000 (individual), $3,000 (couple).
IN

~50 facilities statewide; per diem rate set by FSSA.

Benefits
Room/board Laundry Minimal care coordination (~$20-$50/day subsidy)

Medicare Savings Program (MSP)

Indiana Medicare Savings Program

Age 65+ or disabled
General Indiana resident, Medicare Part A/B.
Income Limits (2025) ~$2,510/month (QMB), ~$3,380/month (SLMB), ~$3,598/month (QI)—individual.
Asset Limits $9,430 (individual), $14,130 (couple).
IN

Three tiers; no waitlist.

Benefits
Covers Part B premiums ($174.70/month) Deductibles ($240/year) Copays (~20%)

National Family Caregiver Support Program (NFCSP) Respite

Indiana NFCSP Respite Care

Age
General Caregivers of 60+ needing care or 55+ caregivers of others; Indiana resident; functional needs (2+ ADLs).
Income Limits (2025) Prioritizes ~$24,980/year (individual); no strict cap.
Asset Limits Not assessed; need-based.
IN

16 AAAs; prioritizes low-income, rural caregivers.

Benefits
Respite (4-6 hours/week or 5 days/year) Adult day care ($60/day) Caregiver training

VA Aid and Attendance (A&A) and Housebound Benefits

Indiana VA Aid and Attendance/Housebound

Age 65+ or disabled veteran/spouse
General Indiana resident, wartime service, need for ADL help (A&A) or homebound.
Income Limits (2025) Net income < ~$1,984/month (veteran with dependent, A&A); pension offsets income.
Asset Limits ~$155,356 net worth limit
IN

High veteran demand statewide.

Benefits
Cash (~$1,433-$2,642/month veteran, ~$951-$1,318 spouse) for care costs (e.g., in-home, assisted living)

Frequently Asked Questions about Bell Trace Family-first Senior Living

Is Bell Trace Family-first Senior Living in a walkable area?

Bell Trace Family-first Senior Living has a walk score of 29. Somewhat walkable. A few nearby services may be reachable on foot, but most trips require transportation.

What is the occupancy rate at Bell Trace Family-first Senior Living?

Bell Trace Family-first Senior Living's occupancy is 90.2%.

Does Bell Trace Family-first Senior Living have different floorplan options?

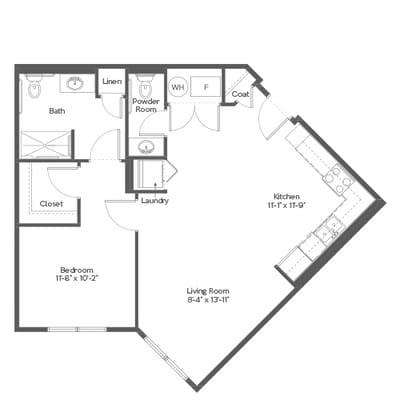
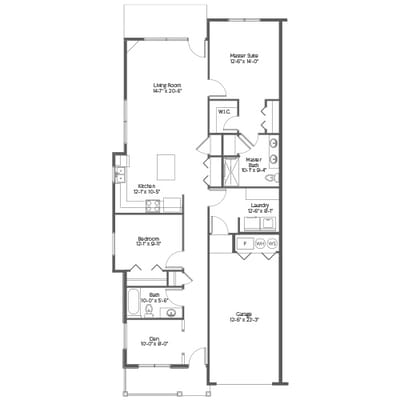
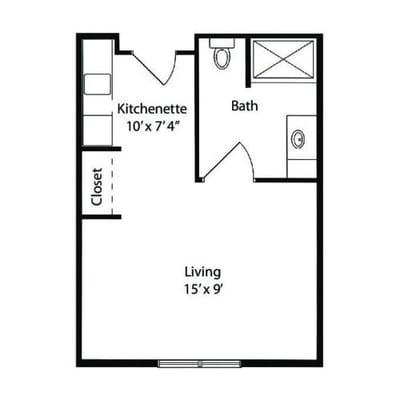
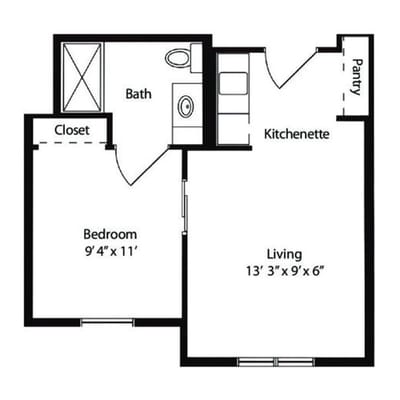
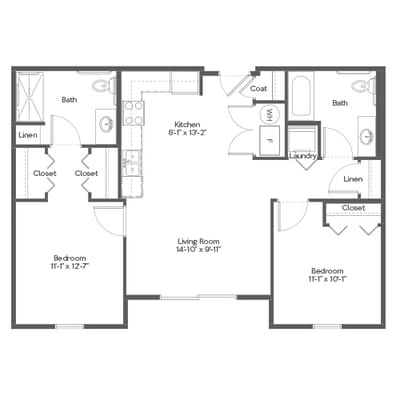
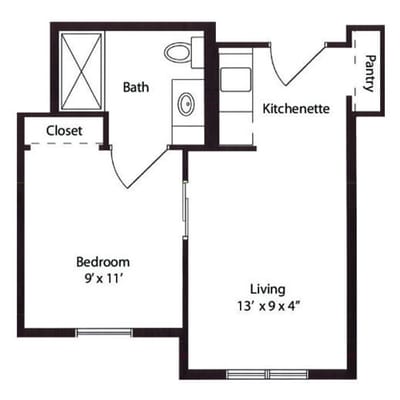
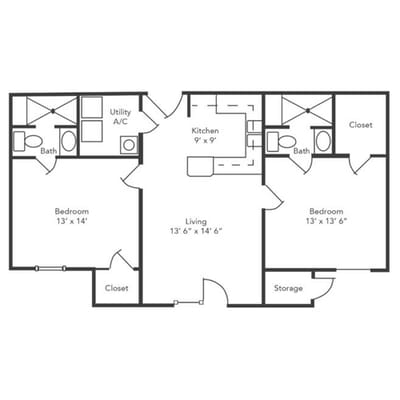
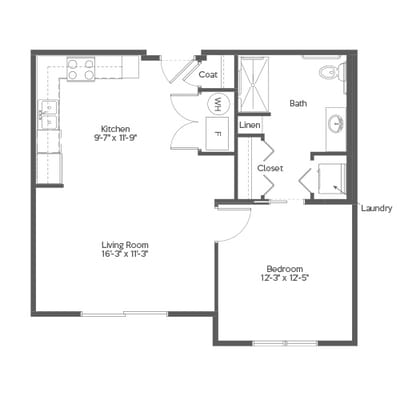
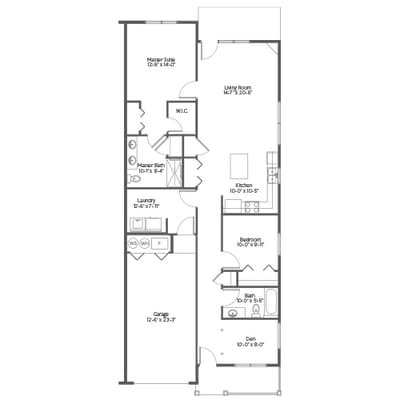
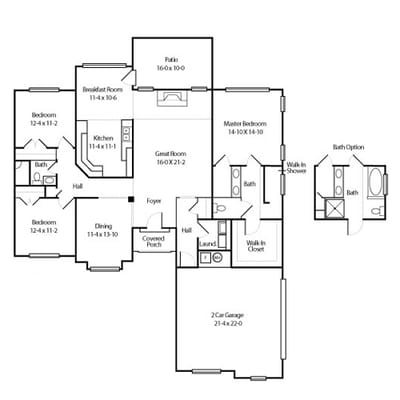
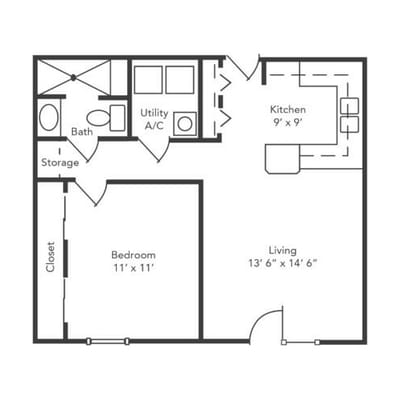
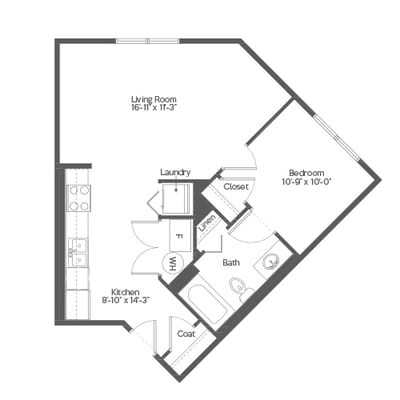
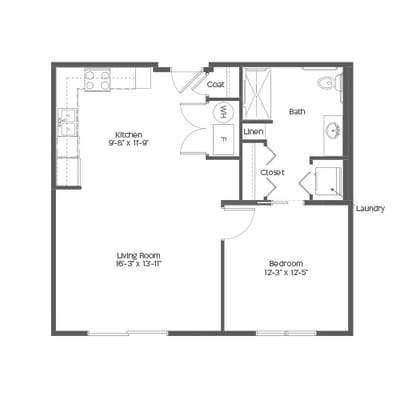
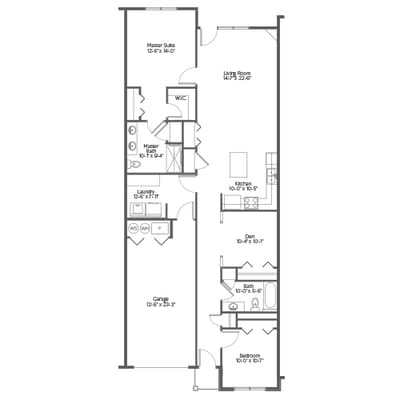
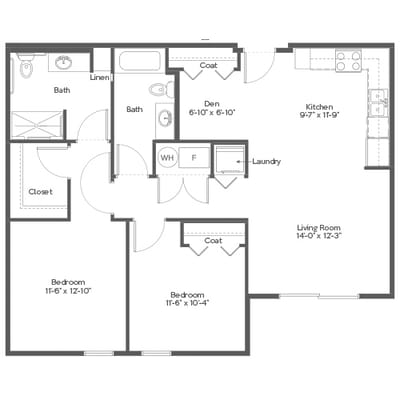
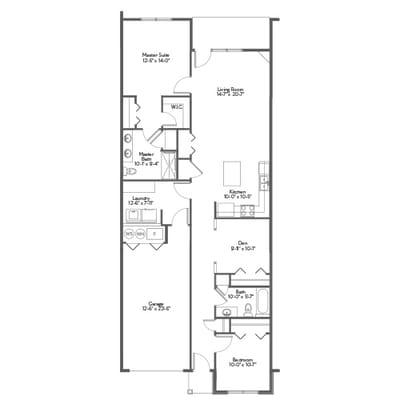
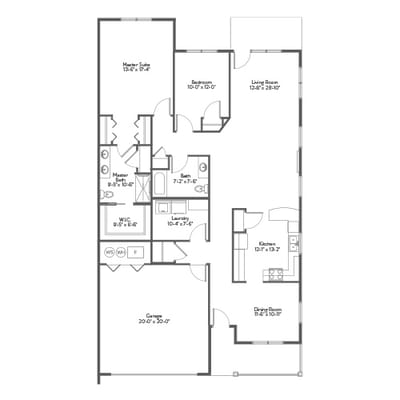
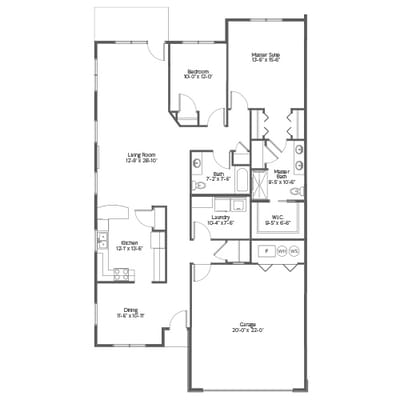
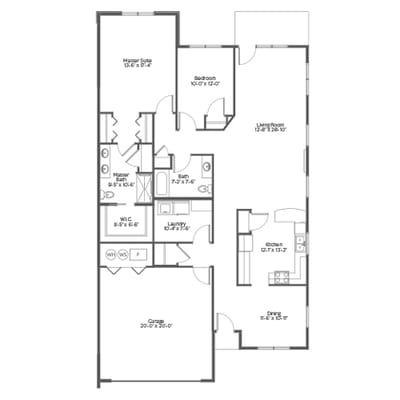
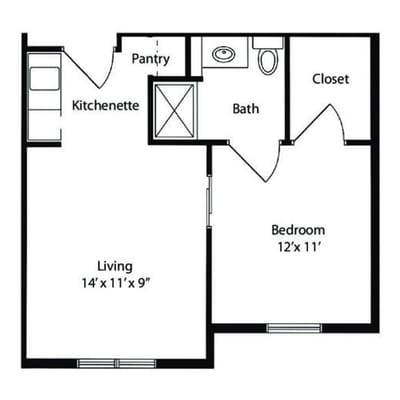
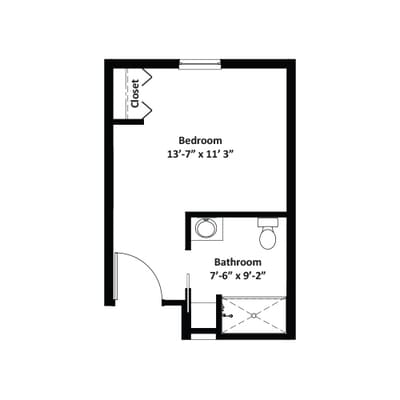
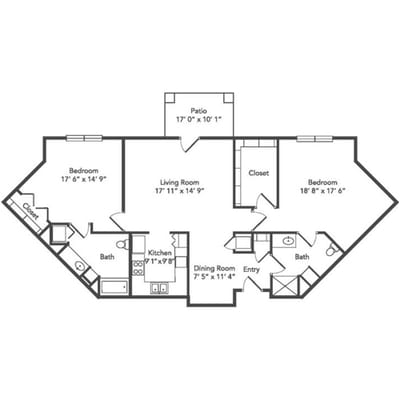
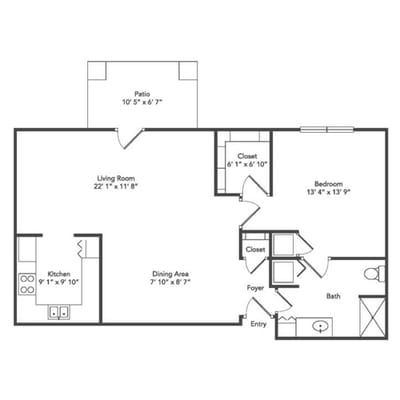
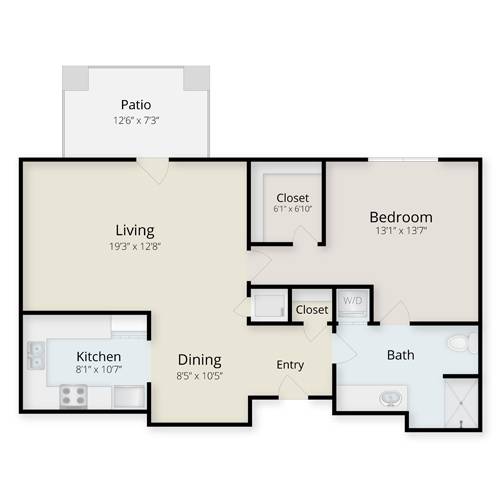
Yes — see the floorplan options available at Bell Trace Family-first Senior Living on this page.

Is Bell Trace Family-first Senior Living a government-operated facility?

Bell Trace Family-first Senior Living is a government-operated nursing facility.

Are there photos of Bell Trace Family-first Senior Living?

Yes — there are 188 photos of Bell Trace Family-first Senior Living in the photo gallery on this page.

What is the address of Bell Trace Family-first Senior Living?

Bell Trace Family-first Senior Living is located at N, 725 Bell Trace Cir, Bloomington, IN 47408.

What is the phone number of Bell Trace Family-first Senior Living?

(812) 332-2355 will put you in contact with the team at Bell Trace Family-first Senior Living.

Guides for Better Senior Living

Care Cost Calculator: See Prices in Your Area

Nursing Home Data Explorer

Don’t Wait Too Long: 7 Red Flag Signs Your Parent Needs Assisted Living Now

The True Cost of Assisted Living in 2025 – And How Families Are Paying For It

Understanding Senior Living Costs: Pricing Models, Discounts & Financial Assistance