Explore Open Rooms

1 Contact details
2 What type of senior care service are you looking for?
3 What budget do you have in mind for senior care?
4 How soon do you need to find care?
5 Additional details

Thank you for your interest!

Our team will be in touch shortly to help with next steps.

Nursing Home

Bethel Health Care Center

Nursing Home

Bethel Health Care Center

13 Park Lawn Dr, Bethel, CT 06801 View map
Overview of Bethel Health Care Center

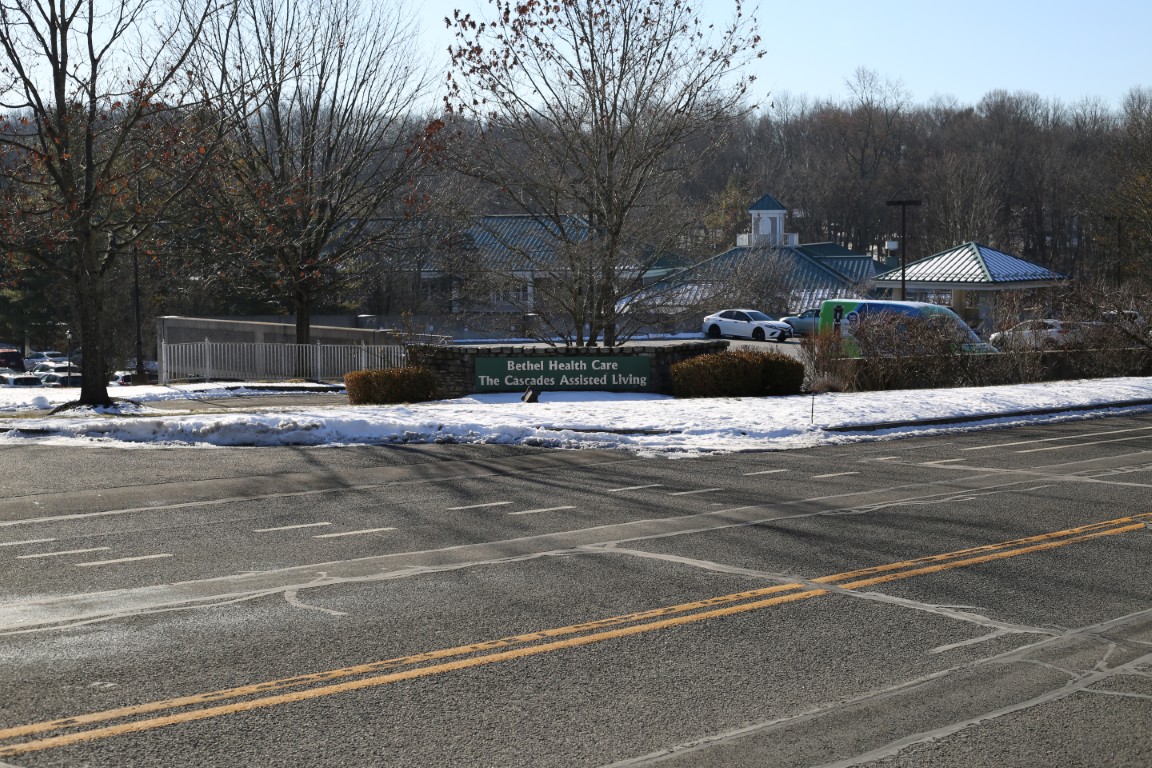
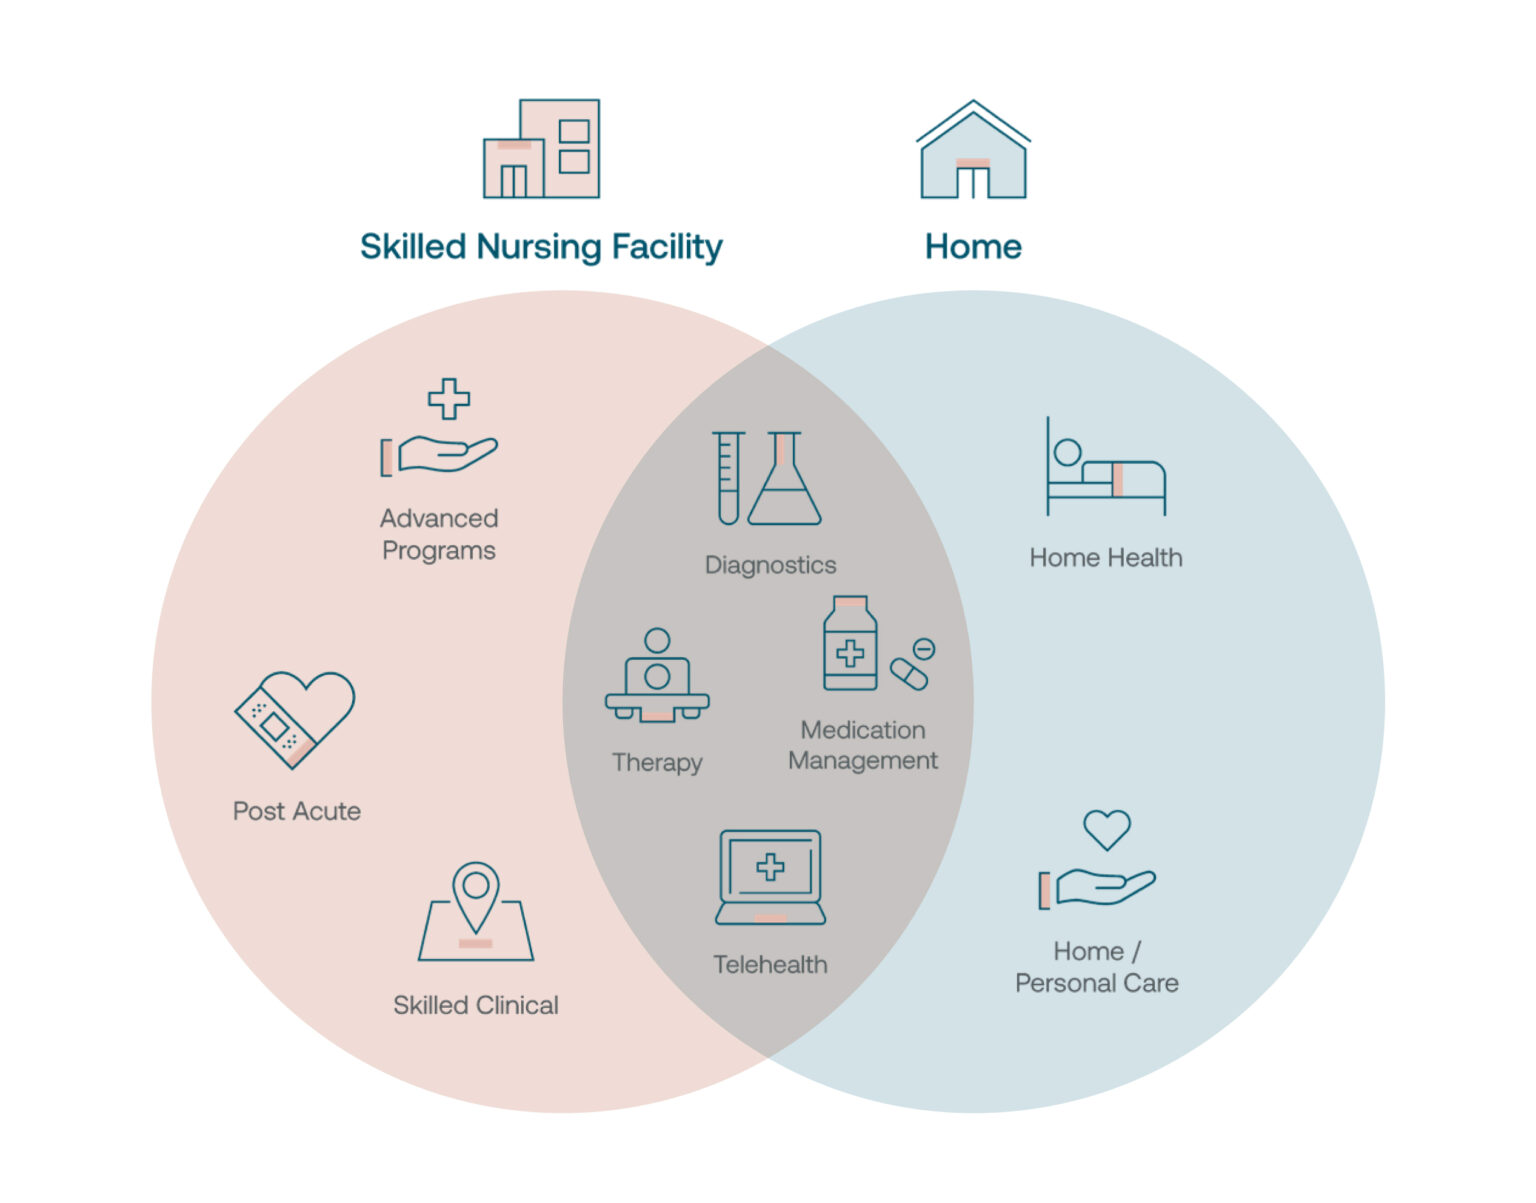
Bethel Health Care Center offers exceptional personal care for residents of rehabilitation and post-acute care services. A comprehensive community that presents a resort-like lifestyle with world-class hospitality offered for short-term rehabilitation and long-term care services. Expect elegance and luxury for seniors who want to live purposefully and thrive in a community that prioritizes their needs.
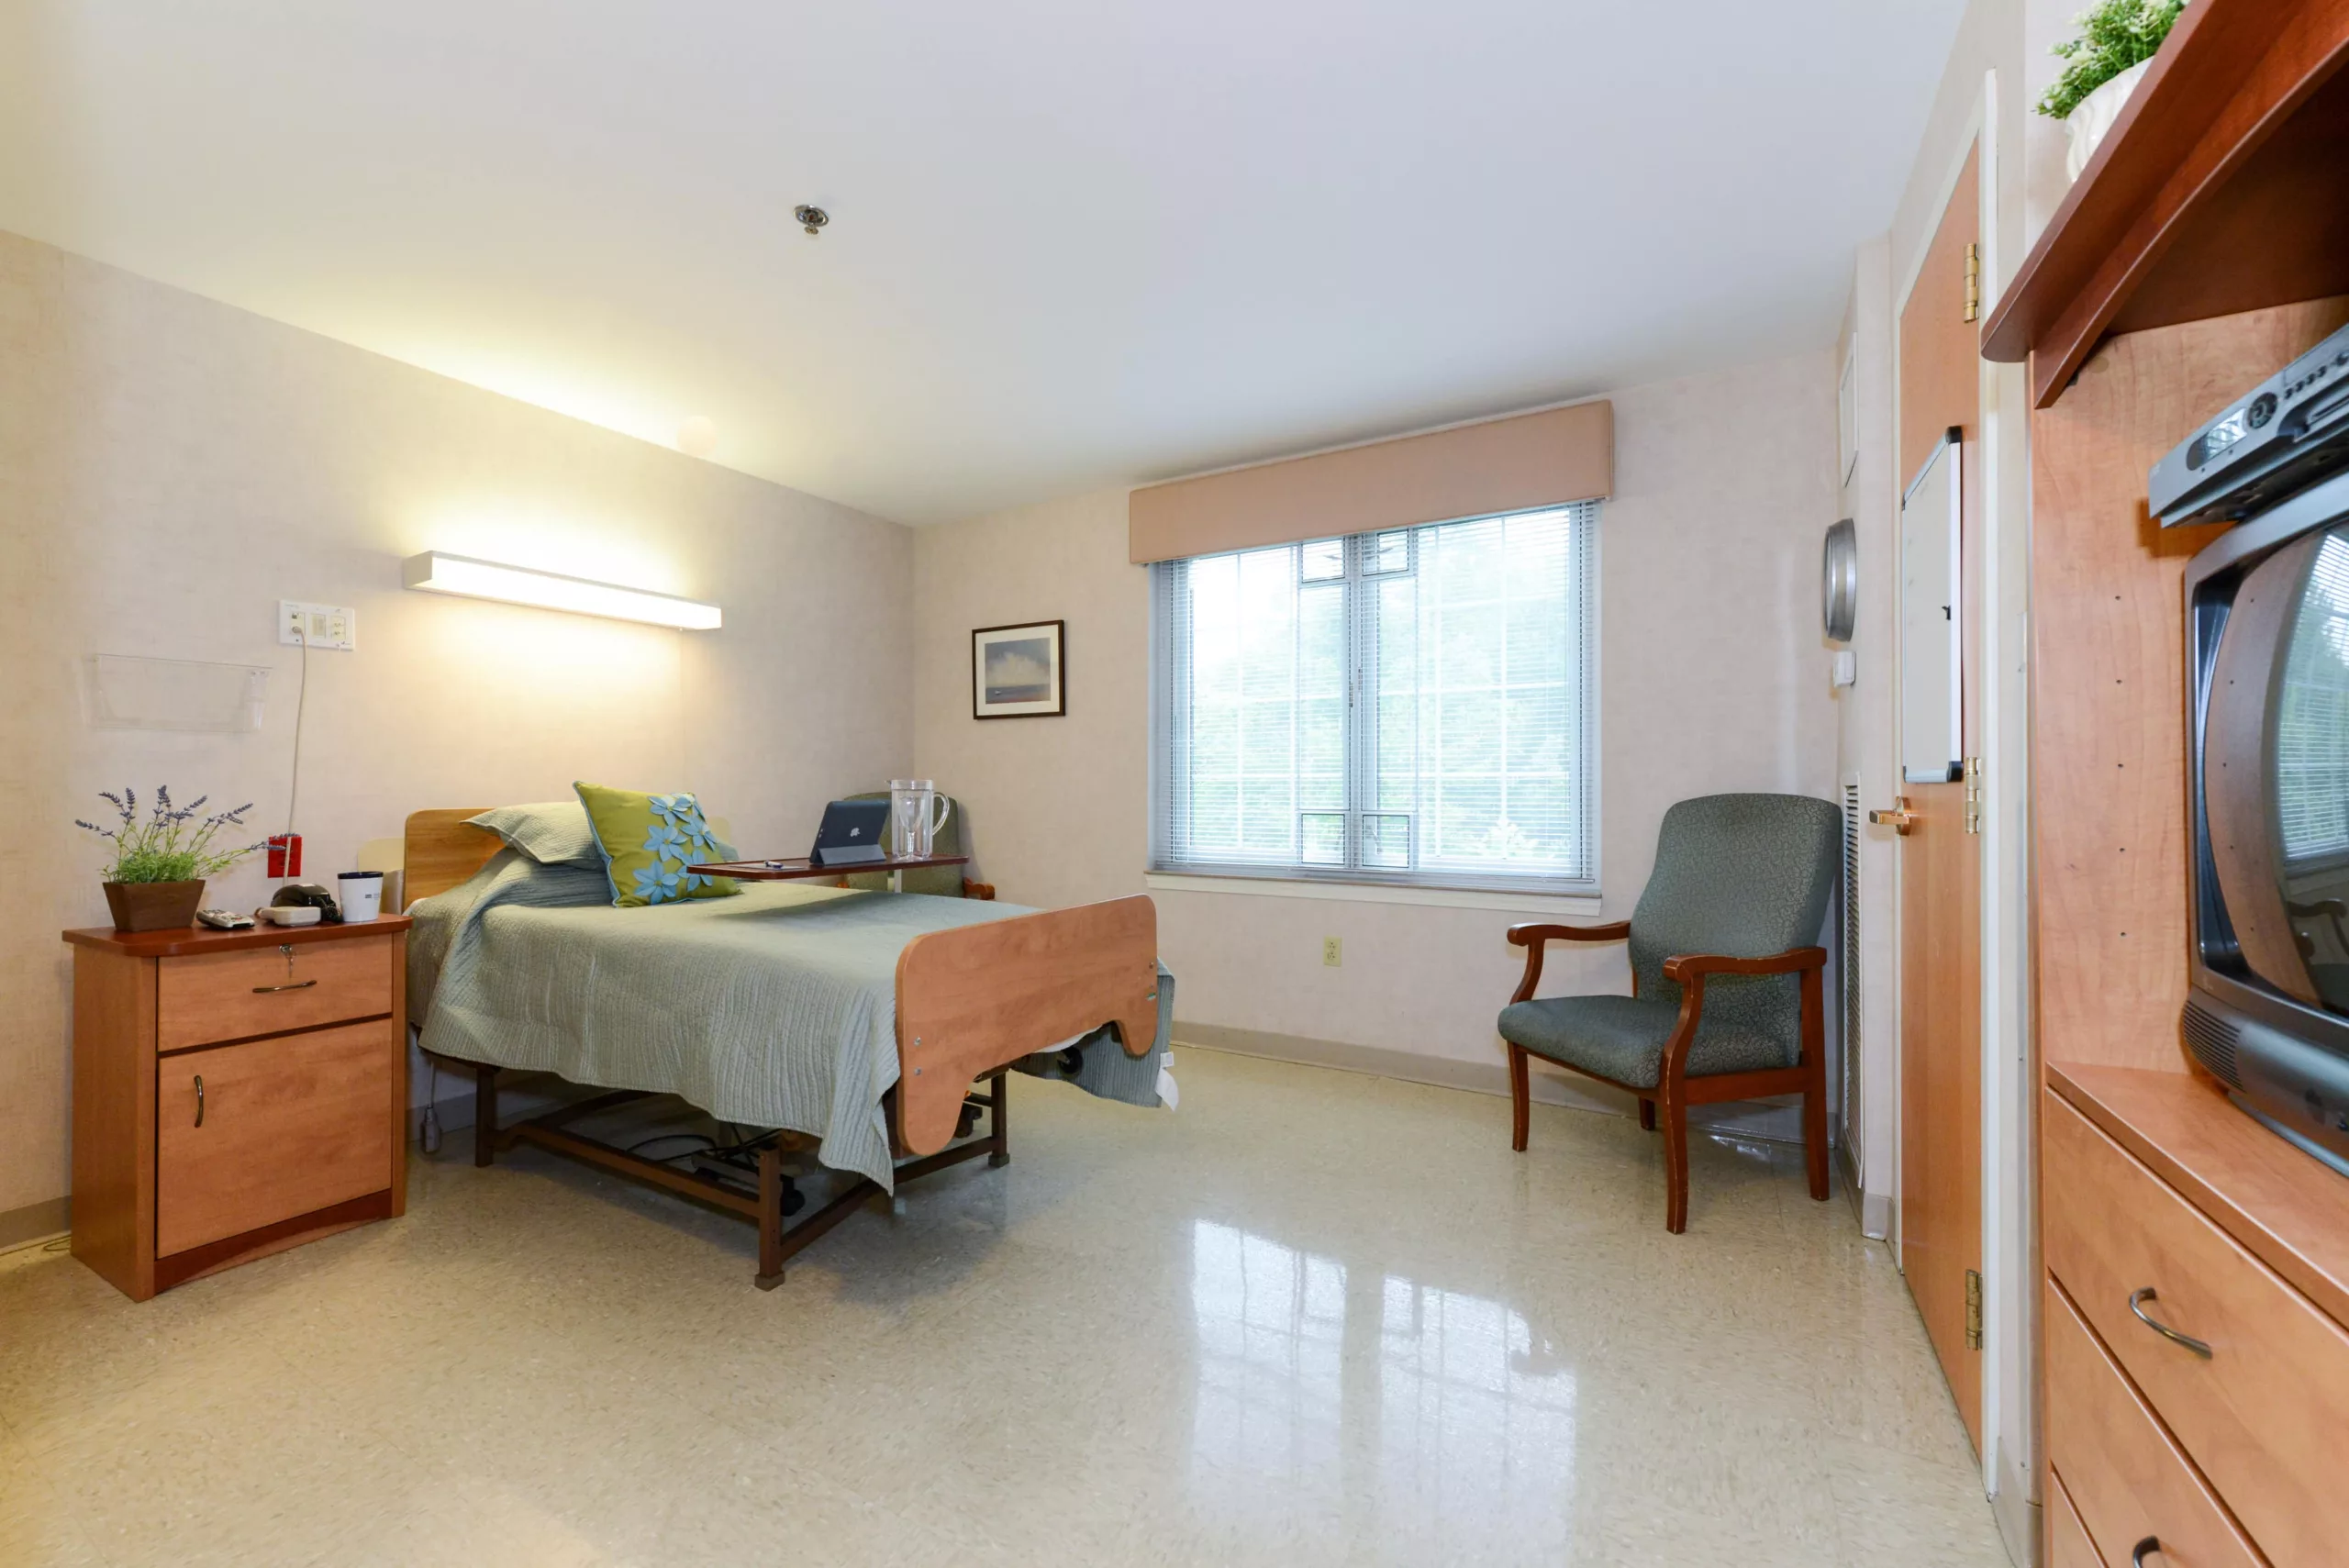
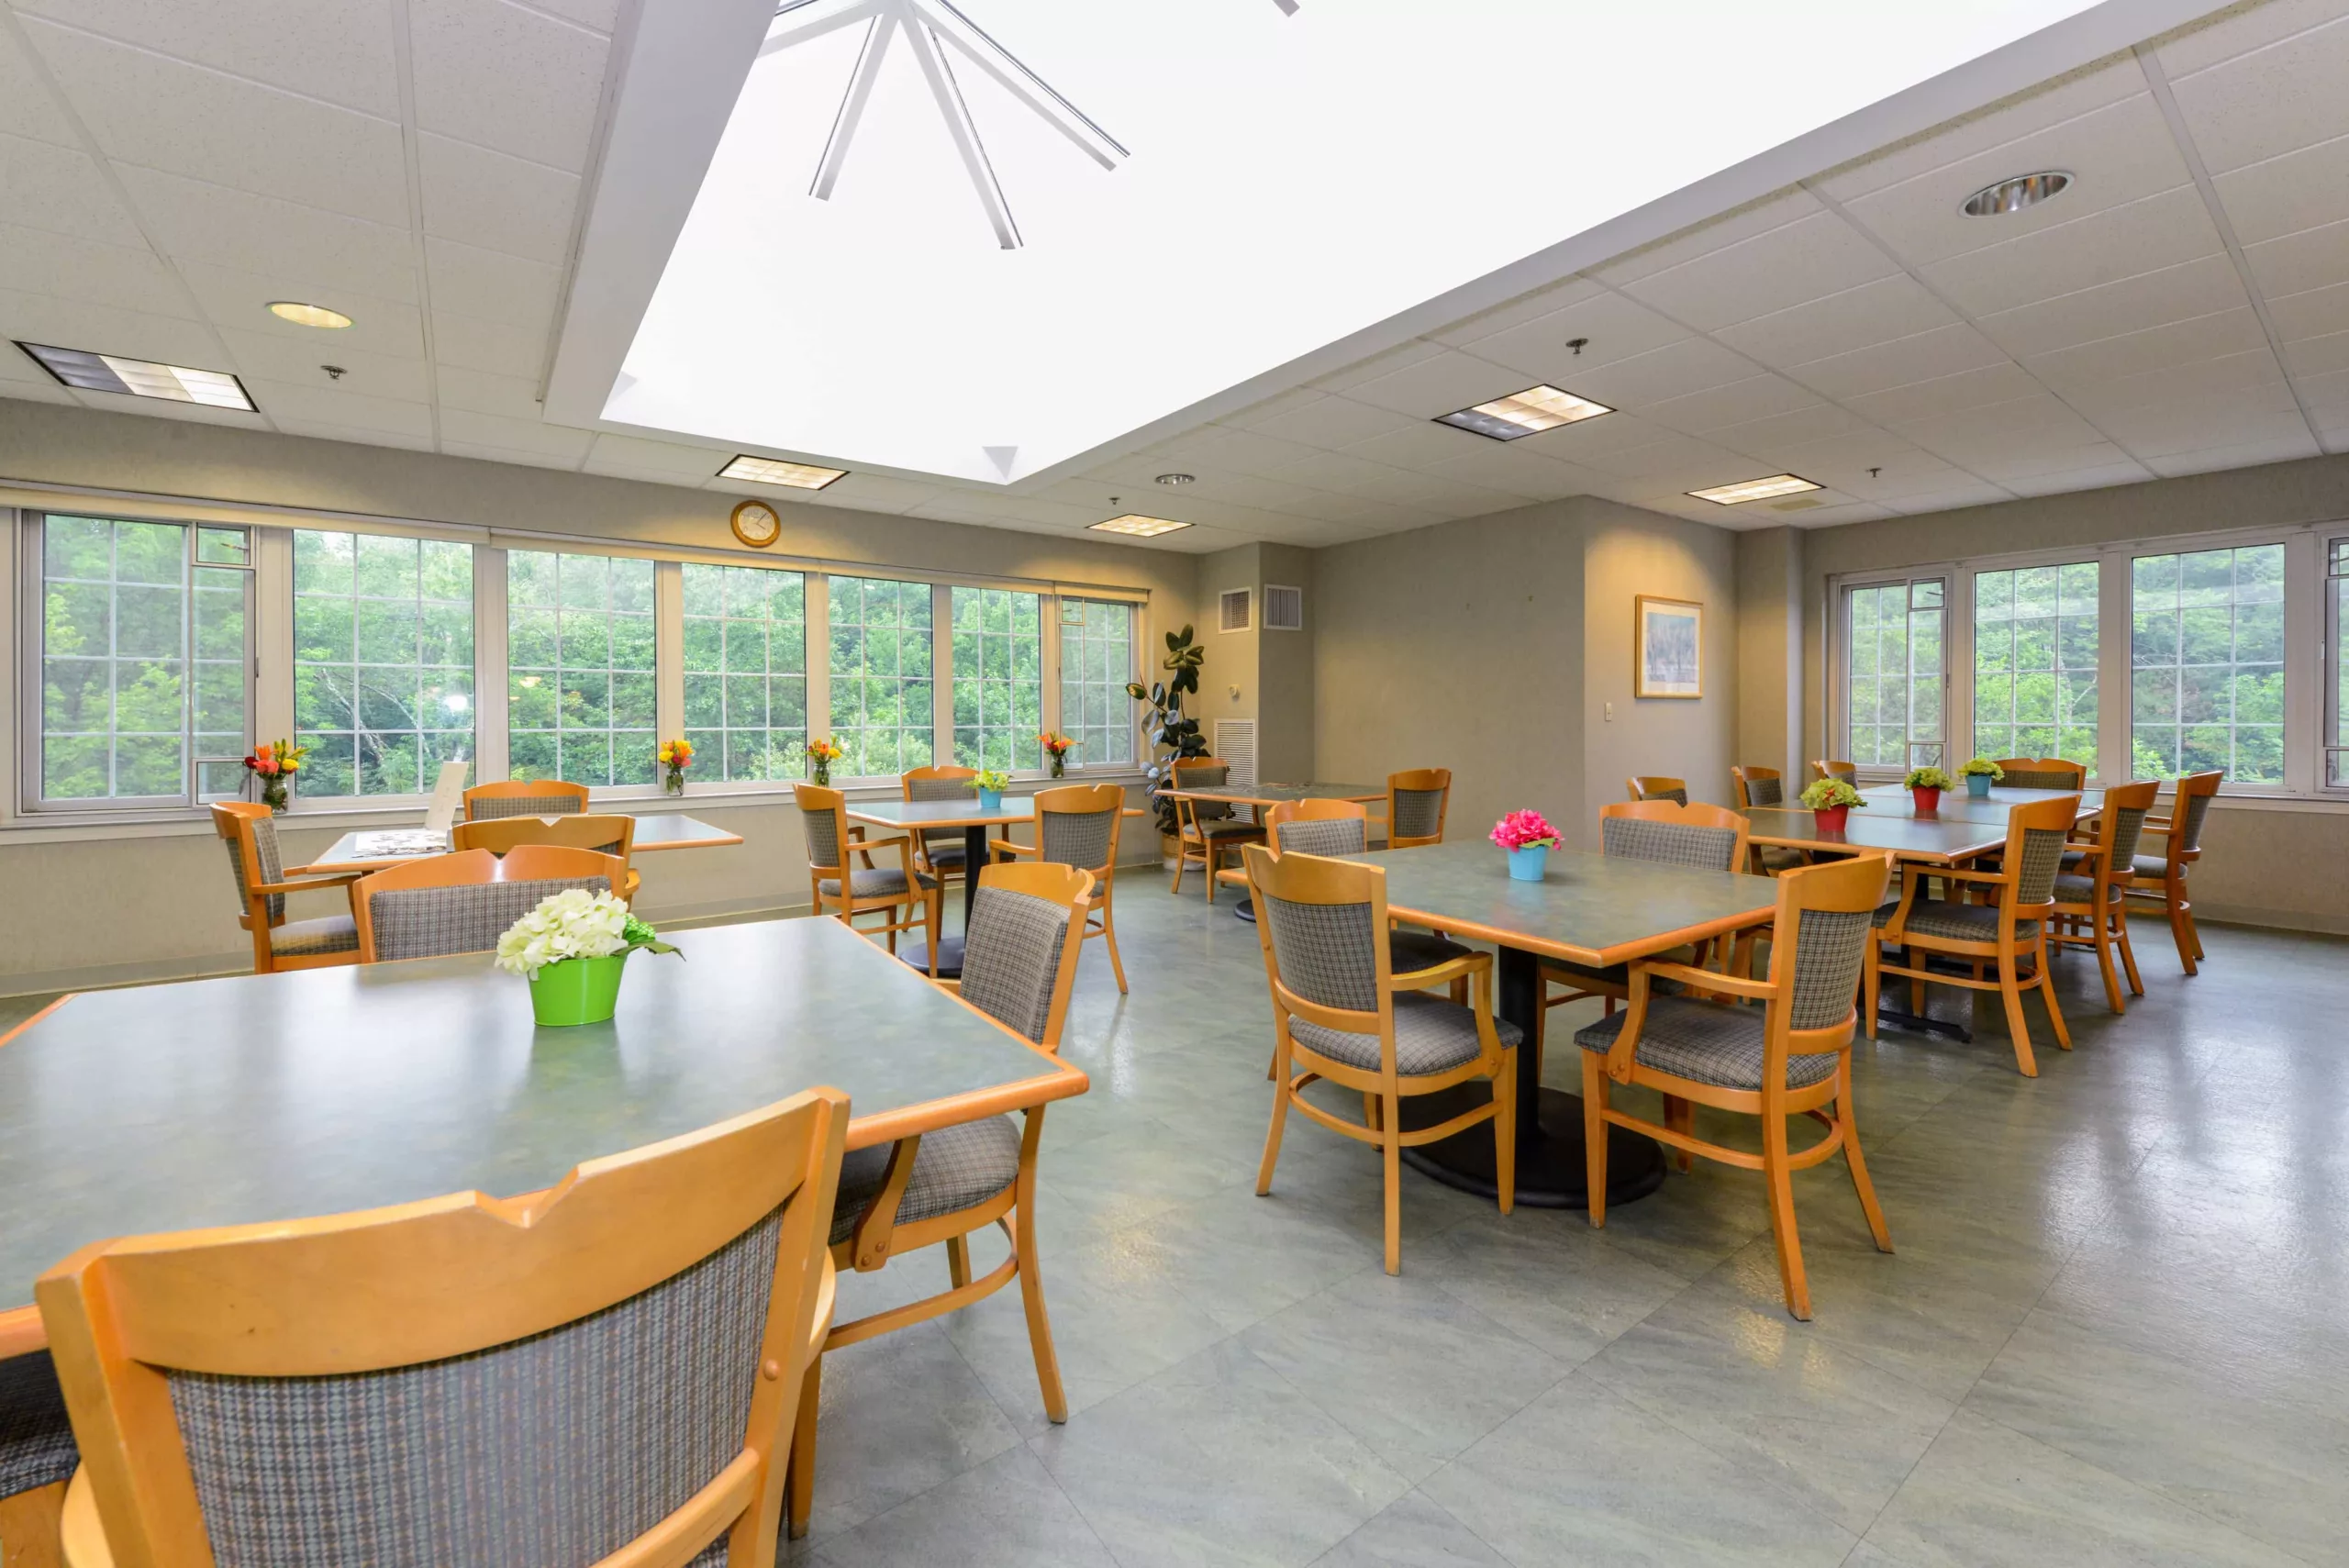
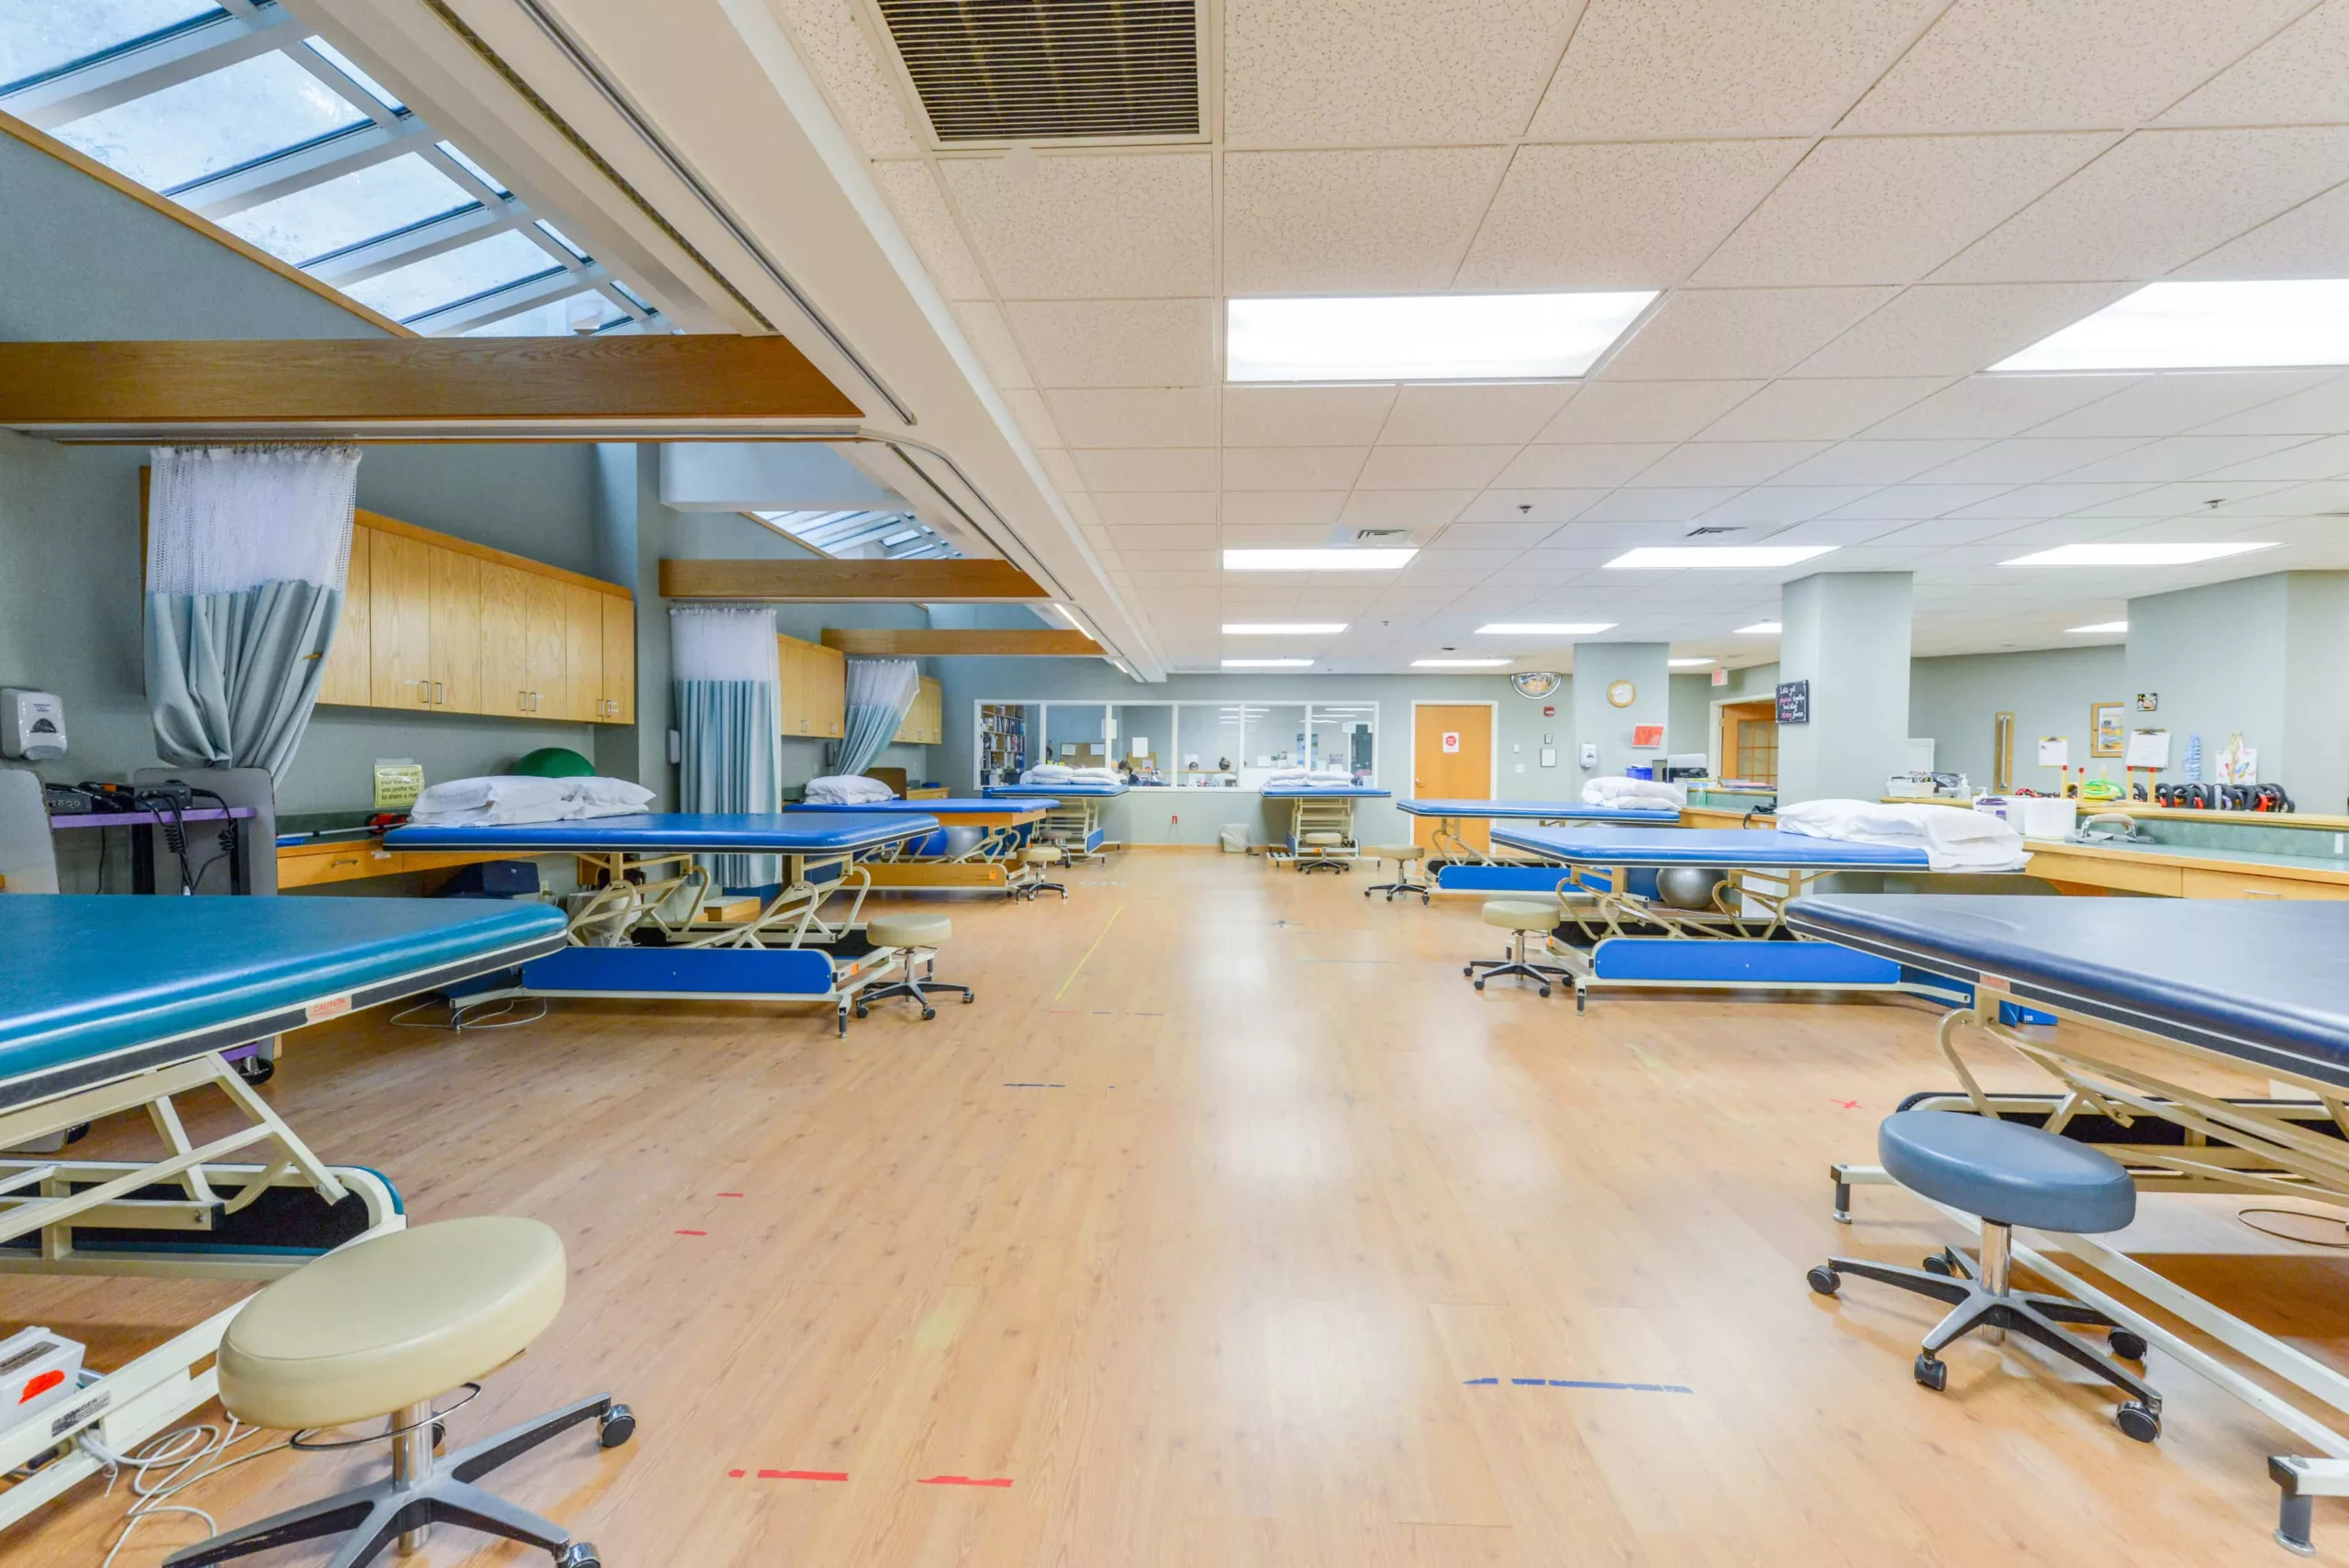
The skilled nursing facility approach is focused on specialized therapies that contribute to a speedy recovery– stroke recovery, rehabilitative therapy (speech, occupational, speech), orthopedic care, wound care, cardiac rehab, and diabetes management. The dedicated team of caregivers strives to meet and follow a resident’s individualized care plan for a maximum healing journey. Amenities include a library, a courtyard, a family visitation room, daily meals provided, and a hair salon.

(203) 830-4180

Managed by Erin Healy

Administrator

Erin Healy, Administrator at Bethel Health Care Center, leads the team by upholding core values and streamlining operations to improve patient care. She brings two decades of healthcare experience, including 13 years with National Health Care, and has held leadership roles such as Executive Director and Assistant Administrator. Erin holds her LNHA from the University of Connecticut.

Quality ratings

Measured by Centers for Medicare & Medicaid Services (CMS)

Overall rating Info The Overall CMS Rating combines results from health inspections, staffing levels and quality measures. Health inspections carry the most weight. Staffing and quality scores can increase or decrease the final rating based on performance compared to state and national standards.
3/5
Connecticut average: 3.4/5
Health Inspection Info Based on the results of the facility's three most recent standard inspections and any complaint investigations. CMS reviews the number, scope, and severity of deficiencies, with more recent findings weighted more heavily.
3/5
Connecticut average: 3.1/5
Staffing Info Measures average nursing staff hours per resident per day, including Registered Nurses (RNs) and total nursing staff. Ratings are adjusted based on the level of care residents require and are compared to state and national benchmarks.
3/5
Connecticut average: 3.4/5
Quality Measures Info Based on clinical and physical health indicators reported to CMS, such as hospital readmissions, falls, pressure ulcers, and improvements in mobility. These measures reflect how well residents' health needs are being managed.
4/5
Connecticut average: 3.6/5

Nursing care per resident

Info This shows how many total hours of nursing staff time are available per resident each day. Higher numbers usually mean more staff support.
3h 41m per day

This home provides 9% less nursing time per resident than the Connecticut average.

Connecticut average: 4h 4m per day

Staffing hours breakdown

Info Hours of care per resident per day, broken down by staff type. Data from CMS Medicare.
Staff type Facility State avg National avg
Registered Nurse (RN) Info Registered nurse hours per resident per day. 42m per day 42m per day 41m per day
Nurse Aide Info Nurse aide hours per resident per day. 2h 25m per day 2h 17m per day 2h 21m per day
Total Nursing (Weekend) Info Total number of nurse staff hours per resident per day on weekends. 3h 37m per day 3h 25m per day 3h 26m per day
Physical Therapist Info Physical therapist staff hours per resident per day. 4m per day 5m per day 4m per day
RN (Weekend) Info Registered nurse hours per resident per day on weekends. 20m per day 28m per day 29m per day

Capacity and availability

Medium-capacity home

Offers a balance of services and community atmosphere.

Total beds 175

This home usually has limited availability

Occupancy is moderate, suggesting balanced demand.

Similar demand to the Connecticut average
Occupancy rate 87.4%
Residents per day (avg) 153
Occupancy rate
87.4%
Residents per day (avg)
153

Who this home usually serves

TYPE OF STAY

Mostly short-term rehab stays

Most residents typically stay for a few weeks or months before returning home or moving on.

Might be optimal for
Short stays Recovery Medicare-covered care

Breakdown by payment type

Medicare

95% of new residents, usually for short-term rehab.

Typical stay 11 days

Private pay

5% of new residents, often for short stays.

Typical stay 10 - 11 months

Finances and operations

Privately-owned community
Operated by a business corporation.
Home revenue
$35.8M
Operating loss
-$1.8M
Privately-owned community Operated by a business corporation.
Home revenue
$35,843,097.00
Operating loss
$-1,840,766.00
Payroll costs Info The portion of the home's budget spent on staff, including nurses, caregivers, and other employees who support care and operations.
$11.3M
31.7% of revenue
Other operating costs Info All remaining costs needed to run the home, such as food, utilities, building maintenance, supplies and administrative expenses.
$26.3M
Total costs $37.7M
Years in operation
16 years in operation
A community with a solid operating history and experience delivering ongoing care.
Walk Score
Walk Score: 8 / 100
Car-dependent. Most errands require a car, with limited nearby walkable options.

Services

Cardiac; Orthopedic And Stroke
Hospice
Iv Therapy
Pain Management
Peritoneal Dialysis
Pulmonary Rehabilitation
Recreation
Rehabilitation Therapy

About this community

Occupancy

Occupancy rate
95%
In line with Connecticut average
Occupied beds
153 / 161
Average residents 102 per day

License details

Facility type
Chronic & Convalescent Nursing Home
Status Active
Issuance January 1, 2010
Expiration December 31, 2027

Additional licensing details

License number: 2218C
Awards: 5 Stars Quality Measure from the Centers for Medicaid and Medicare Services (CMS), McKnight’s Excellence in Technology Award for partnership with Circadia Health, Certified Great Place to Work

Room costs

Private Room (35 rooms) $650 per day
Semi-Private Room (126 rooms) $605 per day

Staffing

Key information about the people who lead and staff this community.

Languages Spoken

Chinese Filipino Indian Italian Mandarin Portuguese Spanish Vietnamese

Staff Composition (State Data)

Admin
3 FTE
Registered Nurse
17 FTE
Licensed Practical Nurse
31 FTE
Nursing Assistant
61 FTE
Recreation
4 FTE
Social Services
3 FTE
Food Service Supervisor
2 FTE
Physical Therapy
3 FTE
Occupational Therapy
4 FTE
Speech Therapy
2 FTE
Dietary
19 FTE
Other Staff
25 FTE

Care Services

Accepts Medicaid
Accepts Medicare
Doctor on Staff
Nursing Services
Rehabilitation Services
Respite Care
Skilled Nursing
Licensed Nurses/CNAs
24-Hour Staffing
Short-Term Rehab

All Levels of Care

Short-Term Care
Long-Term Care
Rehabilitation Services

Additional Policies & Features

Religious Affiliation: No Affiliation
Religious Services: All Denominations, Catholic, Chaplain Service, Jehovah\'s Witness, Jewish, Protestant

Amenities & Lifestyle

24-hour skilled nursing care
medication management
access to in-house primary care and specialty physicians
nurse practitioners provide clinical oversight
daily recreation programs
spiritual programs
3 meals a day
plus an always available menu
nutritional needs management
restorative care

Programs & Activities

Specific Programs
Short-Term Care Services, Advanced Capabilities and Programs, Long-Term Care Services, Respite Care, Palliative Care, Hospice Care

Pricing & Financial Information

Dining & Nutrition

Meals Included
Yes

Types of Care at Bethel Health Care Center

Assisted Living Nursing Home
Contact Bethel Health Care Center

Access & Eligibility

Ways to qualify for care at this community, including accepted programs and payment options.

Medicaid Accepted

This facility is certified for eligible Medicaid services.

Medicare Accepted

This facility is certified for eligible Medicare services.

Payment & Funding Options

Medicaid Medicare Long-term care insurance

Inspection History

In Connecticut, the Department of Public Health, Facility Licensing and Investigations Section conducts mandatory inspections and unannounced surveys to monitor the quality of care in long-term facilities.

12 visits/inspections

9 routine inspections

Breakdown by inspection type
  • 3 licensing inspections
  • 11 plans of correction
  • 8 statements of deficiencies

Results

13 with issues

6 without issues

Connecticut average: 13 visits/inspections

Latest inspection

Date:September 22, 2025

Inspection history

03-03-2025 Inspection Report
04-06-2020 Plan of Correction
04-11-2023 Plan of Correction
05-05-2021 Statement of Deficiencies
05-13-2020 Plan of Correction
06-08-2023 Inspection Report
07-05-2020 Statement of Deficiencies
07-14-2020 Inspection Report
07-14-2020 Plan of Correction
07-22-2025 Inspection Report
07-22-2025 Plan of Correction
07-24-2020 Statement of Deficiencies
07-31-2020 Statement of Deficiencies
08-08-2022 Plan of Correction
08-13-2019 Plan of Correction
08-27-2021 Inspection Report
08-27-2021 Plan of Correction
09-06-2023 Inspection Report
09-22-2025 Inspection Report
10-06-2020 Statement of Deficiencies
10-08-2020 Statement of Deficiencies
10-27-2020 Statement of Deficiencies
11-04-2024 Inspection Report
12-14-2023 Inspection Report
12-23-2020 Statement of Deficiencies

61 deficiencies

Deficiencies indicate regulatory issues. A higher number implies the facility had several areas requiring improvement.

Inspection Report Summary for Bethel Health Care Center

The most recent inspection on September 22, 2025, identified deficiencies related to previously cited violations that were reported as corrected by August 28, 2025. Earlier inspections showed a pattern of deficiencies involving resident care issues such as verbal abuse, nutrition and weight monitoring, medication administration, infection control, and documentation errors. Complaint investigations substantiated concerns about verbal abuse, inadequate incontinent care, and infection control lapses, while many complaint surveys found no deficiencies. Enforcement actions such as fines or license suspensions were not listed in the available reports. The facility’s record shows some improvement in addressing prior deficiencies, though issues related to resident care and infection control have recurred over time.

Health Inspection History

Inspections
Total health inspections 5

Connecticut average 5.7


Last Health inspection on Jul 2025

Total health citations 31

Connecticut average 32

Citations per inspection
6.2

Connecticut average 5.82


Health citations are formal notices following inspections when they fail to comply with safety and care standards.

27 of 31 citations resulted from standard inspections; 3 of 31 resulted from complaint investigations; and 1 of 31 came from combined inspections (standard and complaint).

Breakdown of citation severity (last 3 years)
Critical Health citations More info 0
100% better than Connecticut average

Connecticut average: 0.3


Serious Health citations More info 2
186% worse than Connecticut average

Connecticut average: 0.7

0 critical citations More info Connecticut average: 0.3

2 serious citations More info Connecticut average: 0.7

29 moderate citations More info Connecticut average: 28.8

0 minor citations More info Connecticut average: 2.3
Citations history (last 3 years)
Pharmacy moderate citation Info Issues related to medication management, including how drugs are stored, administered, and monitored. Jul 22, 2025
Corrected

Quality of Care moderate citation Info Issues related to how well residents receive appropriate treatment and support for their medical and daily care needs. Jul 22, 2025
Corrected

Quality of Care moderate citation Info Issues related to how well residents receive appropriate treatment and support for their medical and daily care needs. Jul 22, 2025
Corrected

Quality of Care moderate citation Info Issues related to how well residents receive appropriate treatment and support for their medical and daily care needs. Jul 22, 2025
Corrected

Compare Nursing Homes around Danbury The information below is reported by the Connecticut Department of Public Health, Facility Licensing and Investigations Section.

5 facilities compared · CMS & CT Dept. of Health data · Updated Mar 2026

Hancock Hall
AL

Assisted Living A licensed, long-term care setting for seniors or individuals with disabilities who need help with daily activities — like bathing, dressing, and medication management — but not 24-hour skilled nursing. Offers housing, meals, and around-the-clock support while aiming to maximize resident independence.

IL

Independent Living Lifestyle-focused communities for older adults offering dining, activities, and transportation with minimal personal care. Best for active, independent seniors who want community without medical support.

MC

Memory Care Secured, specialized care for people living with Alzheimer's or dementia. Staff trained in cognitive impairment, with higher staff-to-resident ratios and an environment designed to reduce confusion and wandering risk.

NH

Nursing Home Licensed facility providing 24/7 skilled nursing care for residents with complex, ongoing medical needs. Staffed by RNs, LPNs, and CNAs. Inspected and star-rated annually by CMS. Accepts Medicare (short-term rehab) and Medicaid (long-term care).

Danbury
96
91.1%
+8%
3.59
-17%
-10%
0
12
0
91
-
20
-
$17,5M
$6,2M
35.5%
75414
Filosa Nursing Home and Rehabilitation Center
NH

Nursing Home Licensed facility providing 24/7 skilled nursing care for residents with complex, ongoing medical needs. Staffed by RNs, LPNs, and CNAs. Inspected and star-rated annually by CMS. Accepts Medicare (short-term rehab) and Medicaid (long-term care).

AL

Assisted Living A licensed, long-term care setting for seniors or individuals with disabilities who need help with daily activities — like bathing, dressing, and medication management — but not 24-hour skilled nursing. Offers housing, meals, and around-the-clock support while aiming to maximize resident independence.

Danbury
64
93.5%
+11%
3.24
+8%
-18%
0
16
0
60
A+
50
Danbury Opco Llc
$11,5M
$4,3M
37.7%
75074
Glen Hill Center
NH

Nursing Home Licensed facility providing 24/7 skilled nursing care for residents with complex, ongoing medical needs. Staffed by RNs, LPNs, and CNAs. Inspected and star-rated annually by CMS. Accepts Medicare (short-term rehab) and Medicaid (long-term care).

AL

Assisted Living A licensed, long-term care setting for seniors or individuals with disabilities who need help with daily activities — like bathing, dressing, and medication management — but not 24-hour skilled nursing. Offers housing, meals, and around-the-clock support while aiming to maximize resident independence.

Danbury
100
86.6%
+3%
2.89
-33%
-27%
0
31
0
92
-
63
-
$21,6M
$5,8M
27.1%
75031
Bethel Health Care Center
NH

Nursing Home Licensed facility providing 24/7 skilled nursing care for residents with complex, ongoing medical needs. Staffed by RNs, LPNs, and CNAs. Inspected and star-rated annually by CMS. Accepts Medicare (short-term rehab) and Medicaid (long-term care).

AL

Assisted Living A licensed, long-term care setting for seniors or individuals with disabilities who need help with daily activities — like bathing, dressing, and medication management — but not 24-hour skilled nursing. Offers housing, meals, and around-the-clock support while aiming to maximize resident independence.

Bethel
175
85.7%
+2%
3.68
-41%
-7%
2
31
2
153
-
8
Bethel Investors, Llc
$35,6M
$11,3M
31.9%
75400
Civita Care Center at Danbury
NH

Nursing Home Licensed facility providing 24/7 skilled nursing care for residents with complex, ongoing medical needs. Staffed by RNs, LPNs, and CNAs. Inspected and star-rated annually by CMS. Accepts Medicare (short-term rehab) and Medicaid (long-term care).

AL

Assisted Living A licensed, long-term care setting for seniors or individuals with disabilities who need help with daily activities — like bathing, dressing, and medication management — but not 24-hour skilled nursing. Offers housing, meals, and around-the-clock support while aiming to maximize resident independence.

Danbury
120
69.2%
-18%
6.24
-43%
+57%
2
47
1
112
-
74
-
$10,8M
$4,4M
40.5%
75274

Places of interest near Bethel Health Care Center

Address 4.7 miles from city center — 3.66 miles to nearest hospital (Yale New Haven Health Urgent Care Brookfield)
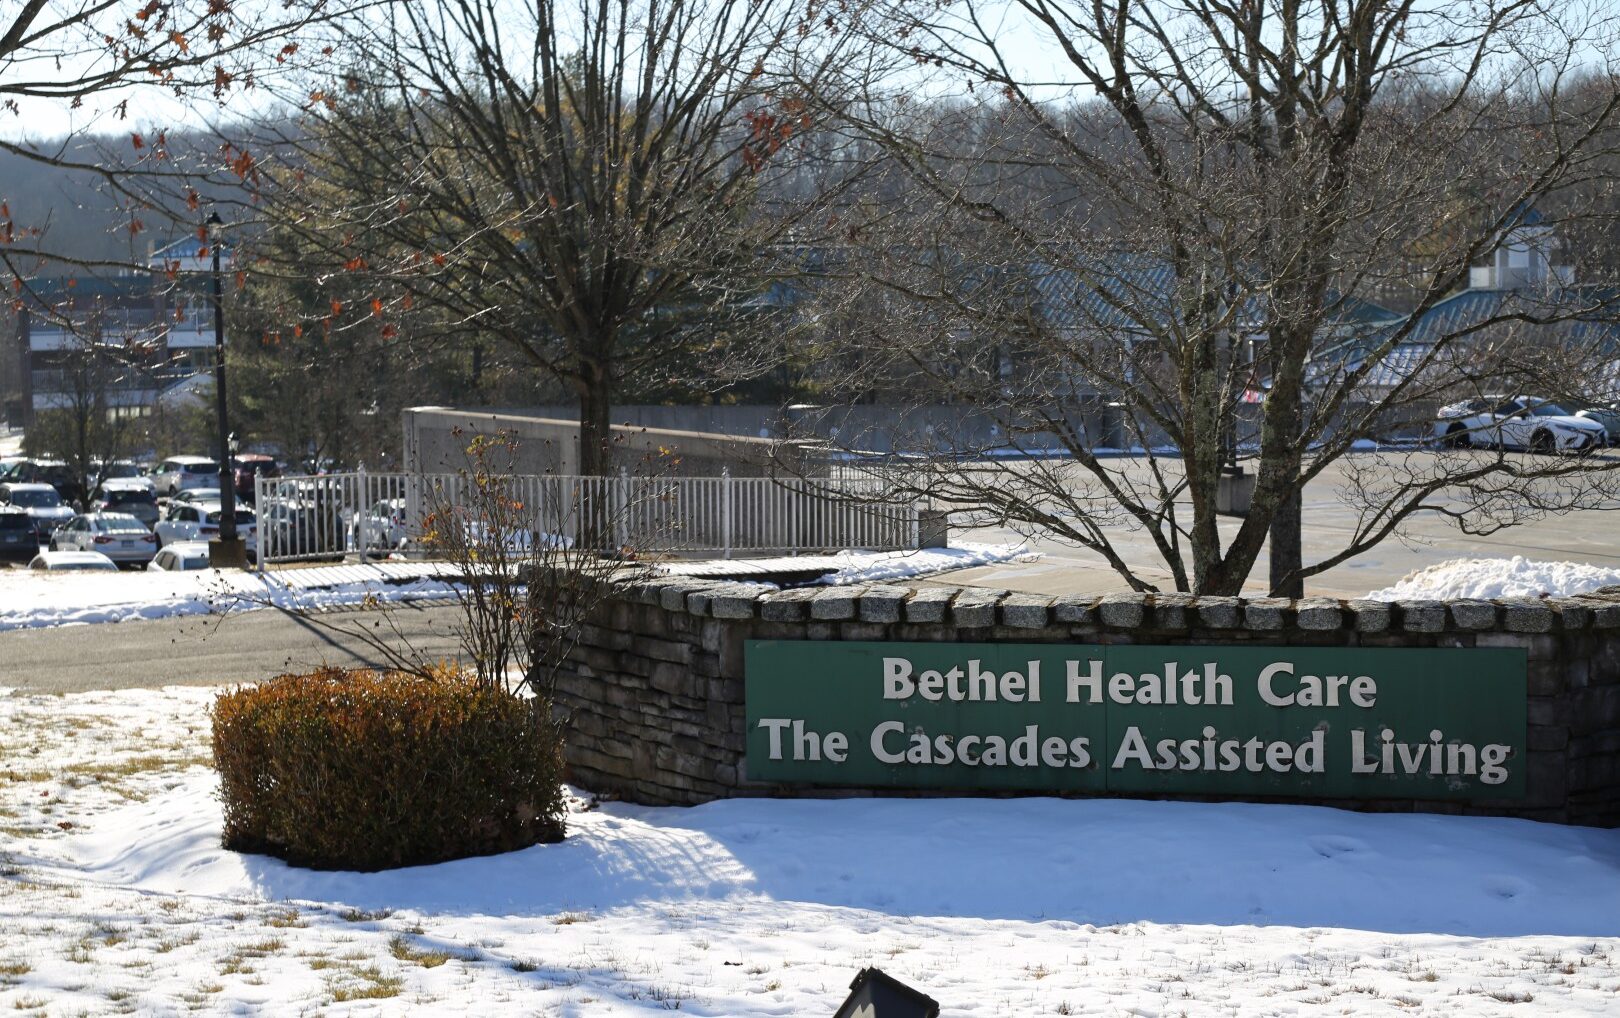
Address 13 Park Lawn Dr, Bethel, CT 06801

Calculate Travel Distance to Bethel Health Care Center

Add your location

Address

Staffing Data (Q2 2025)

This data corresponds to Q2 2025 and is based on CMS Payroll-Based Journal.

Total staff 306
Employees 168
Contractors 138
Staff to resident ratio 2.07:1
10% better than Connecticut average

Connecticut average ratio: 1.88:1

Avg staff/day 90
Average shift 8 hours
7% better than Connecticut average

Connecticut average: 7.5 hours

Total staff hours (quarter) 65,224
Nursing staff breakdown
Registered Nurse

Manages medical care and health needs.

Total count 20
Average shift length Info Average shift length. Calculated as total hours divided by days worked and average staff per day. 7.5 hours

This role is partially covered by contractors.

Licensed Practical Nurse

Assists with medical care and medications.

Total count 81
Average shift length Info Average shift length. Calculated as total hours divided by days worked and average staff per day. 8 hours

This role is partially covered by contractors.

Certified Nursing Assistant

Helps with daily care and mobility.

Total count 132
Average shift length Info Average shift length. Calculated as total hours divided by days worked and average staff per day. 8.3 hours

This role is partially covered by contractors.

Contractor staffing

Total hours from contractors

13.2%

8,626 contractor hours this quarter

Certified Nursing Assistant: 50 Licensed Practical Nurse: 44 Physical Therapy Assistant: 7 Respiratory Therapy Technician: 6 Occupational Therapy Assistant: 6 Qualified Social Worker: 5 Registered Nurse: 5 Clinical Nurse Specialist: 5 Physical Therapy Aide: 3 Other Physician: 3 Medical Director: 2 Speech Language Pathologist: 2
Staff by category
Certified Nursing Assistant825013230,80191100%8.3
Licensed Practical Nurse37448114,23891100%8
Registered Nurse155206,76491100%7.5
Clinical Nurse Specialist75123,1486875%8
Physical Therapy Assistant0771,3348897%7.2
Physical Therapy Aide0331,2906875%7.7
Other Dietary Services Staff4041,2218796%7.8
Qualified Social Worker0558496571%7.9
Respiratory Therapy Technician0667856976%5.7
Nurse Aide in Training150156213437%5.4
Administrator1015046369%8
Nurse Practitioner1014886167%8
RN Director of Nursing1014886167%8
Dental Services Staff1014655965%7.9
Other Social Services Staff1014565763%8
Mental Health Service Worker1014405560%8
Qualified Activities Professional1014324853%9
Occupational Therapy Aide1013764752%8
Speech Language Pathologist0223654044%9.1
Occupational Therapy Assistant066803336%2.3
Medical Director022452629%1.7
Other Physician033362325%1.5
132 Certified Nursing Assistant
% of Days 100%
81 Licensed Practical Nurse
% of Days 100%
20 Registered Nurse
% of Days 100%
12 Clinical Nurse Specialist
% of Days 75%
7 Physical Therapy Assistant
% of Days 97%
3 Physical Therapy Aide
% of Days 75%
4 Other Dietary Services Staff
% of Days 96%
5 Qualified Social Worker
% of Days 71%
6 Respiratory Therapy Technician
% of Days 76%
15 Nurse Aide in Training
% of Days 37%
1 Administrator
% of Days 69%
1 Nurse Practitioner
% of Days 67%
1 RN Director of Nursing
% of Days 67%
1 Dental Services Staff
% of Days 65%
1 Other Social Services Staff
% of Days 63%
1 Mental Health Service Worker
% of Days 60%
1 Qualified Activities Professional
% of Days 53%
1 Occupational Therapy Aide
% of Days 52%
2 Speech Language Pathologist
% of Days 44%
6 Occupational Therapy Assistant
% of Days 36%
2 Medical Director
% of Days 29%
3 Other Physician
% of Days 25%

Facility Characteristics

Source: CMS Long-Term Care Facility Characteristics (Data as of Jan 2026)

Total census
148 residents
Residents by payment source
Medicare
20 residents (13.5%)
Medicaid
97 residents (65.5%)
Private pay or other
31 residents (20.9%)
Programs & Services
Residents' Group

Residents meet regularly to discuss policies, care quality, and activities

Family Member Group

Family members meet regularly to discuss policies, care quality, and activities

Nurse Aide Training

State-approved Nurse Aide Training and Competency Evaluation Program on-site

Active Family Council

Organized group of family members that meets regularly to discuss facility policies, resident care, and activities.

Active Resident Council

Organized group of residents that meets regularly to discuss facility policies, quality of life, and activities.

Quality of care over time

These measures show how residents usually do over time at this home, based on health outcomes and preventive care.

High-risk clinical events score Info A composite score based on pressure ulcers, falls with injury, weight loss, walking ability decline, and activities of daily living decline. 8.4
19% better than Connecticut average

Connecticut average: 10.4

Functional decline score Info A composite score based on activities of daily living decline, walking ability decline, and incontinence. 18.5
12% better than Connecticut average

Connecticut average: 21.1

Long-stay resident measures
Significantly above average Connecticut avg: 3.2 Info CMS star rating based on long-stay quality measure performance. 5 stars = significantly above average, 1 star = significantly below average.
Need for Help with Daily Activities Increased Info Percent of long-stay residents whose need for help with daily activities has increased 14.5%
23% better than Connecticut average

Connecticut average: 18.9%

Walking Ability Worsened Info Percent of long-stay residents whose ability to move independently worsened 12.0%
38% better than Connecticut average

Connecticut average: 19.2%

Low Risk Residents with Bowel/Bladder Incontinence Info Percent of low risk long-stay residents who lose control of their bowels or bladder 29.1%
17% worse than Connecticut average

Connecticut average: 24.9%

Falls with Major Injury Info Percent of long-stay residents experiencing one or more falls with major injury 2.6%
26% better than Connecticut average

Connecticut average: 3.5%

High Risk Residents with Pressure Ulcers Info Percent of long-stay high risk residents with pressure ulcers 4.2%
8% better than Connecticut average

Connecticut average: 4.6%

Urinary Tract Infection Info Percent of long-stay residents with a urinary tract infection 0.9%
48% better than Connecticut average

Connecticut average: 1.7%

Lost Too Much Weight Info Percent of long-stay residents who lose too much weight 8.8%
40% worse than Connecticut average

Connecticut average: 6.3%

Depressive Symptoms Info Percent of long-stay residents who have depressive symptoms 39.6%
161% worse than Connecticut average

Connecticut average: 15.2%

Antipsychotic Use Info Percent of long-stay residents who received an antipsychotic medication 21.5%
25% worse than Connecticut average

Connecticut average: 17.2%

Pneumococcal Vaccine Info Percent of long-stay residents assessed and appropriately given the pneumococcal vaccine 98.5%
13% better than Connecticut average

Connecticut average: 87.5%

Influenza Vaccine Info Percent of long-stay residents assessed and appropriately given the seasonal influenza vaccine 93.9%
In line with Connecticut average

Connecticut average: 93.5%

Hospitalizations per 1,000 days Info Number of hospitalizations per 1,000 long-stay resident days. 2.05
In line with Connecticut average

Connecticut average: 2.10

ED visits per 1,000 days Info Number of outpatient emergency department visits per 1,000 long-stay resident days. 0.59
61% better than Connecticut average

Connecticut average: 1.53

Short-stay resident measures
Average Connecticut avg: 3.3 Info CMS star rating based on short-stay quality measure performance. 5 stars = much above average, 1 star = much below average.
Pneumococcal Vaccine Info Percent of short-stay residents assessed and appropriately given the pneumococcal vaccine 96.1%
37% better than Connecticut average

Connecticut average: 70.1%

Antipsychotic medication increase Info Percent of short-stay residents who newly received an antipsychotic medication 0.4%
77% better than Connecticut average

Connecticut average: 1.5%

Influenza Vaccine Info Percent of short-stay residents assessed and appropriately given the seasonal influenza vaccine 85.4%
22% better than Connecticut average

Connecticut average: 69.8%

Re-hospitalized after SNF stay Info Percentage of short-stay residents who were re-hospitalized after their nursing home admission. 23.1%
8% better than Connecticut average

Connecticut average: 25.0%

Emergency department visits Info Percentage of short-stay residents who had an outpatient emergency department visit. 12.6%
14% worse than Connecticut average

Connecticut average: 11.1%

Falls with major injury Info Percentage of SNF residents who experience falls with major injury during their stay. 0.4%
49% better than Connecticut average

Connecticut average: 0.8%

Ability to care for self at discharge Info Percentage of residents at or above expected ability to care for themselves at discharge. 49.1%
8% worse than Connecticut average

Connecticut average: 53.7%

Successful return to home or community Info Rate of successful return to home or community from a skilled nursing facility. 45.3%
10% worse than Connecticut average

Connecticut average: 50.6%

Penalties and fines

Federal penalties imposed by CMS for regulatory violations, including civil money penalties (fines) and denials of payment for new Medicare/Medicaid admissions.

Source: CMS Penalties Database (Data as of Jan 2026)

Total fines amount $16K
63% lower than Connecticut average

Connecticut average: $44K

Number of fines 2
15% more fines than Connecticut average

Connecticut average: 1.7

Payment Denials Info Serious action where Medicare and/or Medicaid temporarily stops payments for new residents until issues are fixed. 0
100% fewer payment denials than Connecticut average

Connecticut average: 0.1

Fines amount comparison
This facility $16K
Connecticut average $44K
Penalty History

Penalties are imposed by CMS for violations of federal nursing home regulations.

Civil Money Penalty Info Fines imposed for noncompliance, which can be assessed per day or per instance of violation. May 10, 2024
$8K
Civil Money Penalty Info Fines imposed for noncompliance, which can be assessed per day or per instance of violation. May 10, 2024
$8K

Last updated: Jan 2026

Guides for Better Senior Living

Care Cost Calculator: See Prices in Your Area

Nursing Home Data Explorer

Don’t Wait Too Long: 7 Red Flag Signs Your Parent Needs Assisted Living Now

The True Cost of Assisted Living in 2025 – And How Families Are Paying For It

Understanding Senior Living Costs: Pricing Models, Discounts & Financial Assistance

Financial Aid for Connecticut Seniors

Get financial aid guidance

Connecticut Home Care Program for Elders

CHCPE

Age 65+, Connecticut resident, at risk of nursing home placement.

State-funded: ~$1,600/month; Medicaid: ~$2,829/month (300% FBR).

$1,600 (state), $2,000 (Medicaid, individual).

Two tiers (state and Medicaid); waitlists possible.

Statewide Respite Care Program

CT Respite Care

Caregiver of senior with dementia, Connecticut resident.

~$2,500/month (individual, varies).

$40,000 (individual).

Limited to dementia caregivers; capped funding.

Congregate Housing Services Program (CHSP)

Connecticut Congregate Housing Services Program

Age 62+, Connecticut resident, frail but not needing 24/7 care, resides in CHSP-eligible housing.

~$41,000/year (individual, adjusted annually).

Not specified; focus is income-based.

Limited to 14 state-subsidized sites; participants pay 10% of service costs.

Medicare Savings Program (MSP)

Connecticut Medicare Savings Program

Age 65+ or disabled, Connecticut resident, enrolled in Medicare Part A/B.

~$2,510/month (individual, QMB); ~$3,380/month (SLMB); ~$3,598/month (ALMB)—adjusted annually.

None since 2023 policy change.

Three tiers (Qualified Medicare Beneficiary, Specified Low-Income, Additional Low-Income); no asset test.

Senior Community Service Employment Program (SCSEP)

Connecticut SCSEP (federally funded, state-administered)

Age 55+, unemployed, low-income, Connecticut resident.

~$1,983/month (125% FPL, individual).

Not specified; income-focused.

Priority for veterans, rural residents; limited slots (~500/year).

Tour Icon
Planning a tour? Check our touring checklist.
Chat Icon
Thinking of living here? We can help you speak to a current resident