


Beyond Blessedd Assisted Living Facility
Assisted Living, Home Care, Memory Care & Respite Care · Baltimore, MD
Beyond Blessedd Assisted Living Facility
Assisted Living, Home Care, Memory Care & Respite Care · Baltimore, MD
Overview of Beyond Blessedd Assisted Living Facility
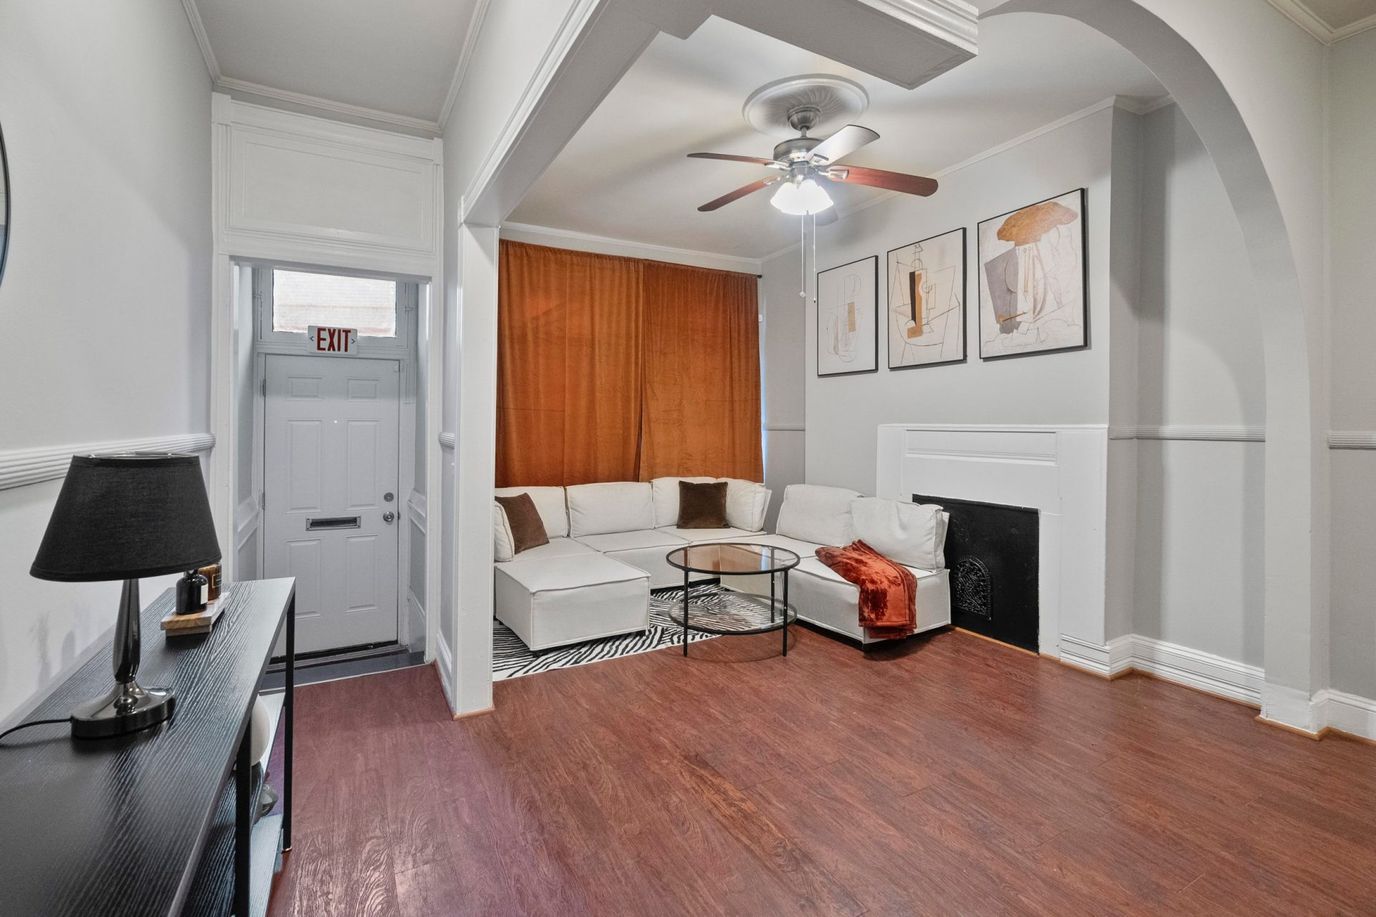
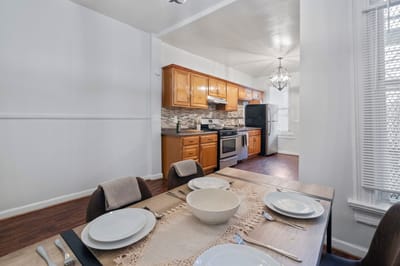
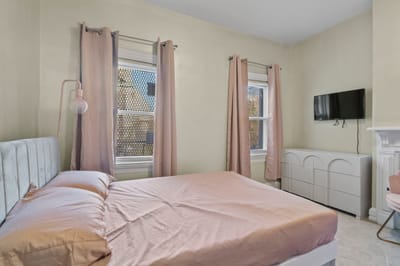
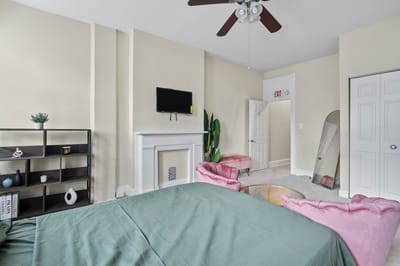
Celebrate your golden years in the nurturing environment of Beyond Blessedd Assisted Living Facility in Baltimore, MD. The community is purposely built to accommodate those needing extra care and support through their personalized assisted living services. From personal care to medication management, they provide all the support you’ll need to stay on track with your well-being.
The community prioritizes residents’ nutrition by providing nutritionally balanced meals approved by attending physicians. Stay connected and active with a range of recreational, religious, and social activities held regularly. Here, you can comfortably live your best life amidst a community tailored to your every need.
8-bed community Rank #315 / 697Bed count — State benchmarkedThis home is ranked 315th out of 697 homes in Maryland. Shows this facility's certified or reported bed count compared to other Maryland facilities. Larger communities may offer more amenities, programs, and on-site services for residents and families.Rankings are based only on facilities in Maryland that report data for that category. Facilities without available data are excluded from the ranking.Click the rank badge to see the full State ranking.Click here to see the full State ranking.
A smaller, more intimate setting that may offer a quieter environment and closer staff-resident interactions.
Walk Score: 78 / 100 Rank #107 / 985Walk Score — State benchmarkedThis home is ranked 107th out of 985 homes in Maryland. Shows how walkable this facility's neighborhood is compared to the average Walk Score across Maryland facilities. Higher scores benefit residents, families, and staff.Rankings are based only on facilities in Maryland that report data for that category. Facilities without available data are excluded from the ranking.Click the rank badge to see the full State ranking.Click here to see the full State ranking.
Very walkable. Most errands can be accomplished on foot, and many essentials are within a short walk.
Specific ProgramsTransitional Housing, Mentorship & Consulting, Donate & Volunteer, Partnerships & Sponsorships
What does this home offer?
Pets Allowed
Housing Options: Private Rooms
Building Type: 3-story
Housekeeping Services
Transportation Services
Recreational Activities
Places of interest near Beyond Blessedd Assisted Living Facility
![]() 1.6 miles from city center
1.6 miles from city center
![]() Estimated distance in miles from Baltimore's city center to Beyond Blessedd Assisted Living Facility's address, calculated via Google Maps.
Estimated distance in miles from Baltimore's city center to Beyond Blessedd Assisted Living Facility's address, calculated via Google Maps.
Calculate Travel Distance to Beyond Blessedd Assisted Living Facility
Add your location
Compare Assisted Living around Baltimore
The information below is reported by the Maryland Department of Health, Office of Health Care Quality.
|
|
|
|
|
|
|
|
|
|
|
|
|
|
|
|
|
|
|
|---|---|---|---|---|---|---|---|---|---|---|---|---|---|---|---|---|---|
| Sunrise of Annapolis |
AL
MC
|
Annapolis |
106
Facility
106
MD AVG
43
Rank
#105 / 697
| Yes |
38
Facility
38
MD AVG
43
Rank
#542 / 985
| Studio / 1 Bed / 2 Bed |
30
Facility
30
MD AVG
21
Rank
#44 / 208
| - |
31%
Male Residents — State Benchmarked 31% of residents are male, compared to the Maryland average of 31%. This facility caters to a majority female resident pool (69% female), consistent with the broader assisted living trend where women significantly outnumber men. |
69%
Female Residents — State Benchmarked 69% of residents are female, compared to the Maryland average of 69%. Women comprise the large majority, consistent with national assisted living demographics where women live longer and enter care facilities at higher rates. |
90%
White Residents — State Benchmarked 90% of residents are reported as White, compared to the Maryland average of 81%. A higher White share than is typical for assisted living in Maryland in this dataset — compare with peer facilities for local context. |
6%
African American Residents — State Benchmarked 6% of residents are reported as African American or Black, compared to the Maryland average of 13%. In line with the Maryland average for African American residents among facilities reporting this breakdown. |
4%
Other Ethnicity Residents — State Benchmarked 4% of residents fall into categories other than White or African American (combined), compared to the Maryland average of 6%. This column aggregates Hispanic, Asian, multiracial, and any other labeled groups that are not classified as White or African American. Reported subgroups in this total: American Indian (1%), Hawaiian/Pacific Islander (1%), Hispanic (1%). |
12%
Residents Age 65–74 — State Benchmarked 12% of residents are 65–74, compared to the Maryland average of 13%. In line with the statewide profile for this youngest senior bracket in assisted living. |
22%
Residents Age 75–84 — State Benchmarked 22% of residents are 75–84, compared to the Maryland average of 31%. Below the state norm — the resident mix may skew either younger or older than this typical middle bracket. |
65%
Residents Age 85–94 — State Benchmarked 65% of residents are 85–94, compared to the Maryland average of 44%. A high concentration of very elderly residents signals a higher-acuity facility with experience caring for advanced age-related needs. |
- |
| Brightview Towson |
AL
MC
|
Towson (Loch Raven) |
100
Facility
100
MD AVG
43
Rank
#117 / 697
| No |
92
Facility
92
MD AVG
43
Rank
#17 / 985
| Studio / 1 Bed / 2 Bed |
14
Facility
14
MD AVG
21
Rank
#138 / 208
| - |
28%
Male Residents — State Benchmarked 28% of residents are male, compared to the Maryland average of 31%. This facility caters to a majority female resident pool (72% female), consistent with the broader assisted living trend where women significantly outnumber men. |
72%
Female Residents — State Benchmarked 72% of residents are female, compared to the Maryland average of 69%. Women comprise the large majority, consistent with national assisted living demographics where women live longer and enter care facilities at higher rates. |
0%
White Residents — State Benchmarked 0% of residents are reported as White, compared to the Maryland average of 81%. A lower White share than the Maryland average — the community may draw a more diverse resident mix relative to other facilities in Maryland. |
0%
African American Residents — State Benchmarked 0% of residents are reported as African American or Black, compared to the Maryland average of 13%. A lower African American share than is typical in Maryland; local markets still vary widely. |
100%
Other Ethnicity Residents — State Benchmarked 100% of residents fall into categories other than White or African American (combined), compared to the Maryland average of 6%. This column aggregates Hispanic, Asian, multiracial, and any other labeled groups that are not classified as White or African American. Reported subgroups in this total: Other (100%). |
- | - | - | - |
| Brightview Mays Chapel Ridge |
AL
IL
MC
|
Timonium (Dixon Hill) |
89
Facility
89
MD AVG
43
Rank
#160 / 697
| No |
52
Facility
52
MD AVG
43
Rank
#402 / 985
| Studio / 1 Bed / 2 Bed |
50
Facility
50
MD AVG
21
Rank
#1 / 208
| A+ |
13%
Male Residents — State Benchmarked 13% of residents are male, compared to the Maryland average of 31%. This facility caters to a majority female resident pool (87% female), consistent with the broader assisted living trend where women significantly outnumber men. |
87%
Female Residents — State Benchmarked 87% of residents are female, compared to the Maryland average of 69%. Women comprise the large majority, consistent with national assisted living demographics where women live longer and enter care facilities at higher rates. |
99%
White Residents — State Benchmarked 99% of residents are reported as White, compared to the Maryland average of 81%. A higher White share than is typical for assisted living in Maryland in this dataset — compare with peer facilities for local context. |
0%
African American Residents — State Benchmarked 0% of residents are reported as African American or Black, compared to the Maryland average of 13%. A lower African American share than is typical in Maryland; local markets still vary widely. |
1%
Other Ethnicity Residents — State Benchmarked 1% of residents fall into categories other than White or African American (combined), compared to the Maryland average of 6%. This column aggregates Hispanic, Asian, multiracial, and any other labeled groups that are not classified as White or African American. Reported subgroups in this total: Asian (1%). |
3%
Residents Age 65–74 — State Benchmarked 3% of residents are 65–74, compared to the Maryland average of 13%. Fewer younger seniors suggests the resident population skews older, likely requiring higher acuity care and more hands-on support. |
30%
Residents Age 75–84 — State Benchmarked 30% of residents are 75–84, compared to the Maryland average of 31%. This is the second most common age bracket in assisted living, representing residents with moderate care needs. |
48%
Residents Age 85–94 — State Benchmarked 48% of residents are 85–94, compared to the Maryland average of 44%. This is typically the most common age bracket in assisted living — this facility is in line with the statewide norm. |
18%
Residents Age 95+ — State Benchmarked 18% of residents are 95 or older, compared to the Maryland average of 16%. In line with the statewide profile for the oldest resident bracket. |
| Caritas House Assisted Living |
AL
NH
HOS
PC
|
Baltimore (Violetville) |
60
Facility
60
MD AVG
43
Rank
#209 / 697
| No |
50
Facility
50
MD AVG
43
Rank
#419 / 985
| Studio |
23
Facility
23
MD AVG
21
Rank
#100 / 208
| A |
31%
Male Residents — State Benchmarked 31% of residents are male, compared to the Maryland average of 31%. This facility caters to a majority female resident pool (69% female), consistent with the broader assisted living trend where women significantly outnumber men. |
69%
Female Residents — State Benchmarked 69% of residents are female, compared to the Maryland average of 69%. Women comprise the large majority, consistent with national assisted living demographics where women live longer and enter care facilities at higher rates. |
93%
White Residents — State Benchmarked 93% of residents are reported as White, compared to the Maryland average of 81%. A higher White share than is typical for assisted living in Maryland in this dataset — compare with peer facilities for local context. |
5%
African American Residents — State Benchmarked 5% of residents are reported as African American or Black, compared to the Maryland average of 13%. In line with the Maryland average for African American residents among facilities reporting this breakdown. |
2%
Other Ethnicity Residents — State Benchmarked 2% of residents fall into categories other than White or African American (combined), compared to the Maryland average of 6%. This column aggregates Hispanic, Asian, multiracial, and any other labeled groups that are not classified as White or African American. Reported subgroups in this total: Hispanic (2%). |
12%
Residents Age 65–74 — State Benchmarked 12% of residents are 65–74, compared to the Maryland average of 13%. In line with the statewide profile for this youngest senior bracket in assisted living. |
38%
Residents Age 75–84 — State Benchmarked 38% of residents are 75–84, compared to the Maryland average of 31%. A high concentration in this mid-range bracket, where residents typically need moderate support with daily activities. |
41%
Residents Age 85–94 — State Benchmarked 41% of residents are 85–94, compared to the Maryland average of 44%. This is typically the most common age bracket in assisted living — this facility is in line with the statewide norm. |
9%
Residents Age 95+ — State Benchmarked 9% of residents are 95 or older, compared to the Maryland average of 16%. Most residents here have not yet reached the oldest-old bracket, suggesting a younger overall community. |
| Beyond Blessedd Assisted Living Facility |
AL
HC
MC
RC
|
Baltimore (Upton) |
8
Facility
8
MD AVG
43
Rank
#315 / 697
| Yes |
78
Facility
78
MD AVG
43
Rank
#107 / 985
| Private Rooms | - | - | - | - | - | - | - | - | - | - | - |
Financial Assistance for
Assisted Living in Maryland
Beyond Blessedd Assisted Living Facility is located in Baltimore, Maryland.
Here are the financial assistance programs available to residents in Maryland.
Frequently Asked Questions about Beyond Blessedd Assisted Living Facility
What neighborhood is Beyond Blessedd Assisted Living Facility in?
Beyond Blessedd Assisted Living Facility is in the Upton neighborhood of Baltimore.
Is Beyond Blessedd Assisted Living Facility in a walkable area?
Beyond Blessedd Assisted Living Facility has a walk score of 78. Very walkable. Most errands can be accomplished on foot, and many essentials are within a short walk.
How many beds does Beyond Blessedd Assisted Living Facility have?
Beyond Blessedd Assisted Living Facility has 8 beds.
Are there photos of Beyond Blessedd Assisted Living Facility?
Yes — there are 4 photos of Beyond Blessedd Assisted Living Facility in the photo gallery on this page.
What is the address of Beyond Blessedd Assisted Living Facility?
Beyond Blessedd Assisted Living Facility is located at 756 Dolphin St, Baltimore, MD 21217.
What is the phone number of Beyond Blessedd Assisted Living Facility?
(443) 984-9540 will put you in contact with the team at Beyond Blessedd Assisted Living Facility.
Guides for Better Senior Living
Care Cost Calculator: See Prices in Your Area
Assisted Living Explorer
Don’t Wait Too Long: 7 Red Flag Signs Your Parent Needs Assisted Living Now
The True Cost of Assisted Living in 2025 – And How Families Are Paying For It
Understanding Senior Living Costs: Pricing Models, Discounts & Financial Assistance
Updated on
