


Brightview Hunt Valley
Assisted Living, Independent Living & Memory Care · Baltimore, MD

Brightview Hunt Valley
Assisted Living, Independent Living & Memory Care · Baltimore, MD
Overview of Brightview Hunt Valley
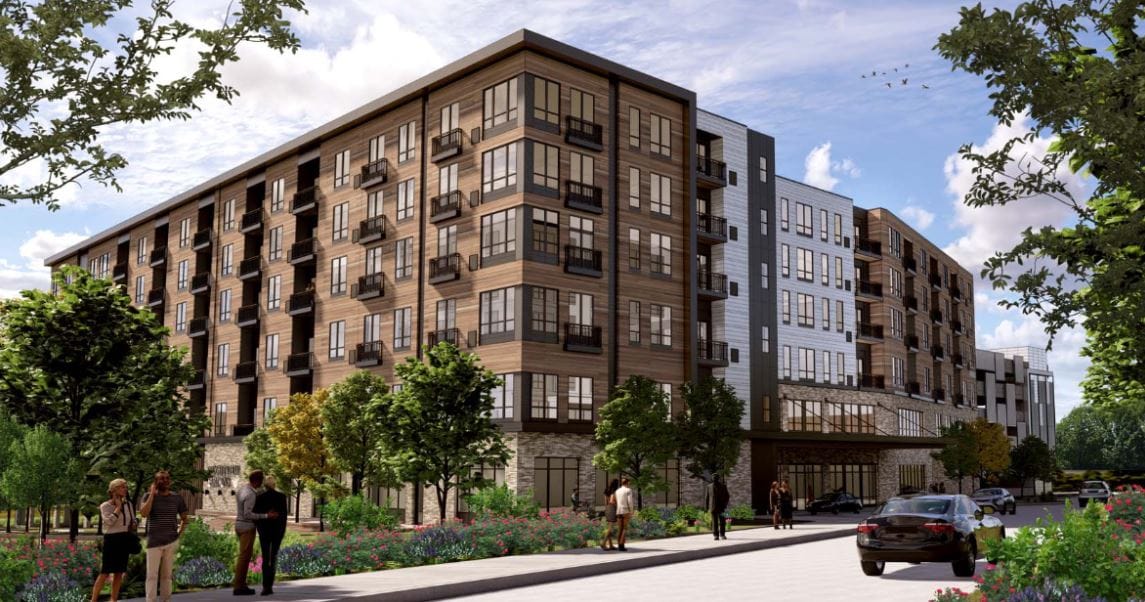
Located in the peaceful community of Hunt Valley, MD, the Brightview Hunt Valley is a dedicated senior living community that offers independent living, assisted living, and memory care services. Here, residents can select from a wide range of accommodations with varying floor plans including deluxe studio, one-bedroom, and two-bedroom. This community is dedicated to providing extraordinary care and services to ensure comfort and security among its residents. As for memory care, those with cognitive conditions receive high-quality and innovative services through its thoughtfully designed Wellspring Village Neighborhood.
Having a highly equipped and compassionate team, residents can enjoy a wide array of top-notch amenities and services such as delectable and nutritious chef-prepared meals and interactive daily social activities programs. Embrace health and wellness through its fitness programs. Meet new people and create unforgettable memories together. At Brightview Hunt Valley, seniors can surely enjoy a worry-free living experience.
95-bed community Rank #148 / 697Bed count — State benchmarkedThis home is ranked 148th out of 697 homes in Maryland. Shows this facility's certified or reported bed count compared to other Maryland SNFs. Larger communities may offer more amenities, programs, and on-site services for residents and families.Click the rank badge to see the full State ranking.Click here to see the full State ranking.
A larger shared setting that may offer more common spaces and organized community services.
Walk Score: 49 / 100 Rank #431 / 985Walk Score — State benchmarkedThis home is ranked 431st out of 985 homes in Maryland. Shows how walkable this facility's neighborhood is compared to the average Walk Score across Maryland SNFs. Higher scores benefit residents, families, and staff.Click the rank badge to see the full State ranking.Click here to see the full State ranking.
Somewhat walkable. A few nearby services may be reachable on foot, but most trips require transportation.
About this community
AwardsBest Workplace in Aging Services, Ranked by FORTUNE Magazine for seven consecutive years (2019 - 2025)
Facility TypeAl
CountyBaltimore
Emergency Systems24-hour emergency call system
Staffing
Key information about the people who lead and staff this community.
No CNA training program
Respite Care
Licensed Nurses/CNAs
No mild Alzheimer's level
No moderate Alzheimer's level
No severe Alzheimer's level
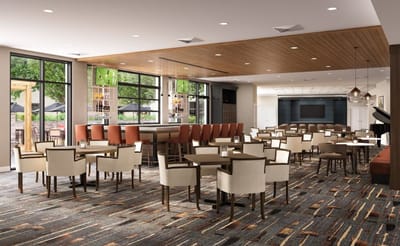
Chef-Prepared Meals
Dining Rooms
Café
Juice Bar
Private Dining
Beauty Salon
Fitness Room
Art Studio
Stocked Library
Movie Theater
Pub
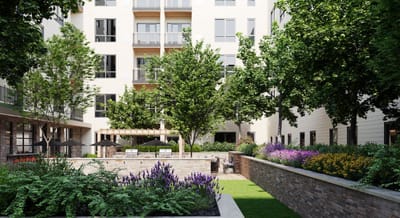
Outdoor Gardens And Courtyard
ActivitiesVibrant calendar of events, presentations, and classes available.
Branded ProgramsBright Minds Program
Wellness ProgramSPICE in Motion fitness classes
Specific ProgramsDaily programs and activities.
Food DescriptionChef-prepared meals daily with dining rooms, café, juice bar, and private dining.
Brightview Harrison – Menu
Download Menu PDFWhat does this home offer?
Housing Options: Studio / 1 Bed / 2 Bed
Building Type: Mid-rise
Transportation Services
Fitness and Recreation
Over 10 years of experience
Katie A. is the Community Executive Director at Brightview Hunt Valley. She has been with Brightview for over 10 years, starting as a concierge and progressing through several community director roles. Katie now leads the community with her extensive experience and dedication to vibrant senior living.
Places of interest near Brightview Hunt Valley
![]() 17.9 miles from city center
17.9 miles from city center
![]() Estimated distance in miles from Cockeysville's city center to Brightview Hunt Valley's address, calculated via Google Maps.
Estimated distance in miles from Cockeysville's city center to Brightview Hunt Valley's address, calculated via Google Maps.
Calculate Travel Distance to Brightview Hunt Valley
Add your location
Financial Assistance for
Assisted Living in Maryland
Brightview Hunt Valley is located in Cockeysville, Maryland.
Here are the financial assistance programs available to residents in Maryland.
Compare Assisted Living around Baltimore
The information below is reported by the Maryland Department of Health, Office of Health Care Quality.
Filter by care type
| Sunrise of Annapolis |
AL Assisted Living A licensed, long-term care setting for seniors or individuals with disabilities who need help with daily activities — like bathing, dressing, and medication management — but not 24-hour skilled nursing. Offers housing, meals, and around-the-clock support while aiming to maximize resident independence.
MC Memory Care Secured, specialized care for people living with Alzheimer's or dementia. Staff trained in cognitive impairment, with higher staff-to-resident ratios and an environment designed to reduce confusion and wandering risk. | Annapolis | 106
Facility
106
MD AVG
44
Rank
#110 / 697 | Yes |
38
Facility
38
MD AVG
43
Rank
#542 / 985 | Studio / 1 Bed / 2 Bed | 30
Facility
30
MD AVG
21
Rank
#44 / 208 |
31% Male Residents — State Benchmarked 31% of residents are male, compared to the Maryland average of 31%. This facility caters to a majority female resident pool (69% female), consistent with the broader assisted living trend where women significantly outnumber men. |
69% Female Residents — State Benchmarked 69% of residents are female, compared to the Maryland average of 69%. Women comprise the large majority, consistent with national assisted living demographics where women live longer and enter care facilities at higher rates. |
90% White Residents — State Benchmarked 90% of residents are reported as White, compared to the Maryland average of 81%. A higher White share than is typical for assisted living in Maryland in this dataset — compare with peer facilities for local context. |
6% African American Residents — State Benchmarked 6% of residents are reported as African American or Black, compared to the Maryland average of 13%. In line with the Maryland average for African American residents among facilities reporting this breakdown. |
4% Other Ethnicity Residents — State Benchmarked 4% of residents fall into categories other than White or African American (combined), compared to the Maryland average of 6%. This column aggregates Hispanic, Asian, multiracial, and any other labeled groups that are not classified as White or African American. Reported subgroups in this total: American Indian (1%), Hawaiian/Pacific Islander (1%), Hispanic (1%). |
12% Residents Age 65–74 — State Benchmarked 12% of residents are 65–74, compared to the Maryland average of 13%. In line with the statewide profile for this youngest senior bracket in assisted living. |
22% Residents Age 75–84 — State Benchmarked 22% of residents are 75–84, compared to the Maryland average of 31%. Below the state norm — the resident mix may skew either younger or older than this typical middle bracket. |
65% Residents Age 85–94 — State Benchmarked 65% of residents are 85–94, compared to the Maryland average of 44%. A high concentration of very elderly residents signals a higher-acuity facility with experience caring for advanced age-related needs. | - |
| Sunrise of Severna Park |
AL Assisted Living A licensed, long-term care setting for seniors or individuals with disabilities who need help with daily activities — like bathing, dressing, and medication management — but not 24-hour skilled nursing. Offers housing, meals, and around-the-clock support while aiming to maximize resident independence. | Severna Park (Mckinsey Road) | 100
Facility
100
MD AVG
44
Rank
#120 / 697 | Yes |
70
Facility
70
MD AVG
43
Rank
#184 / 985 | Studio / 1 Bed / 2 Bed | 29
Facility
29
MD AVG
21
Rank
#48 / 208 |
29% Male Residents — State Benchmarked 29% of residents are male, compared to the Maryland average of 31%. This facility caters to a majority female resident pool (71% female), consistent with the broader assisted living trend where women significantly outnumber men. |
71% Female Residents — State Benchmarked 71% of residents are female, compared to the Maryland average of 69%. Women comprise the large majority, consistent with national assisted living demographics where women live longer and enter care facilities at higher rates. |
99% White Residents — State Benchmarked 99% of residents are reported as White, compared to the Maryland average of 81%. A higher White share than is typical for assisted living in Maryland in this dataset — compare with peer facilities for local context. |
1% African American Residents — State Benchmarked 1% of residents are reported as African American or Black, compared to the Maryland average of 13%. A lower African American share than is typical in Maryland; local markets still vary widely. |
0% Other Ethnicity Residents — State Benchmarked 0% of residents fall into categories other than White or African American (combined), compared to the Maryland average of 6%. This column aggregates Hispanic, Asian, multiracial, and any other labeled groups that are not classified as White or African American. |
6% Residents Age 65–74 — State Benchmarked 6% of residents are 65–74, compared to the Maryland average of 13%. Fewer younger seniors suggests the resident population skews older, likely requiring higher acuity care and more hands-on support. |
29% Residents Age 75–84 — State Benchmarked 29% of residents are 75–84, compared to the Maryland average of 31%. This is the second most common age bracket in assisted living, representing residents with moderate care needs. |
56% Residents Age 85–94 — State Benchmarked 56% of residents are 85–94, compared to the Maryland average of 44%. A high concentration of very elderly residents signals a higher-acuity facility with experience caring for advanced age-related needs. |
8% Residents Age 95+ — State Benchmarked 8% of residents are 95 or older, compared to the Maryland average of 16%. Most residents here have not yet reached the oldest-old bracket, suggesting a younger overall community. |
| Brightview White Marsh |
AL Assisted Living A licensed, long-term care setting for seniors or individuals with disabilities who need help with daily activities — like bathing, dressing, and medication management — but not 24-hour skilled nursing. Offers housing, meals, and around-the-clock support while aiming to maximize resident independence.
MC Memory Care Secured, specialized care for people living with Alzheimer's or dementia. Staff trained in cognitive impairment, with higher staff-to-resident ratios and an environment designed to reduce confusion and wandering risk. | Nottingham | 99
Facility
99
MD AVG
44
Rank
#133 / 697 | No |
49
Facility
49
MD AVG
43
Rank
#431 / 985 | Studio / 1 Bed / 2 Bed | 25
Facility
25
MD AVG
21
Rank
#83 / 208 |
17% Male Residents — State Benchmarked 17% of residents are male, compared to the Maryland average of 31%. This facility caters to a majority female resident pool (83% female), consistent with the broader assisted living trend where women significantly outnumber men. |
83% Female Residents — State Benchmarked 83% of residents are female, compared to the Maryland average of 69%. Women comprise the large majority, consistent with national assisted living demographics where women live longer and enter care facilities at higher rates. |
98% White Residents — State Benchmarked 98% of residents are reported as White, compared to the Maryland average of 81%. A higher White share than is typical for assisted living in Maryland in this dataset — compare with peer facilities for local context. |
2% African American Residents — State Benchmarked 2% of residents are reported as African American or Black, compared to the Maryland average of 13%. A lower African American share than is typical in Maryland; local markets still vary widely. |
0% Other Ethnicity Residents — State Benchmarked 0% of residents fall into categories other than White or African American (combined), compared to the Maryland average of 6%. This column aggregates Hispanic, Asian, multiracial, and any other labeled groups that are not classified as White or African American. |
3% Residents Age 65–74 — State Benchmarked 3% of residents are 65–74, compared to the Maryland average of 13%. Fewer younger seniors suggests the resident population skews older, likely requiring higher acuity care and more hands-on support. |
17% Residents Age 75–84 — State Benchmarked 17% of residents are 75–84, compared to the Maryland average of 31%. Below the state norm — the resident mix may skew either younger or older than this typical middle bracket. |
51% Residents Age 85–94 — State Benchmarked 51% of residents are 85–94, compared to the Maryland average of 44%. A high concentration of very elderly residents signals a higher-acuity facility with experience caring for advanced age-related needs. |
29% Residents Age 95+ — State Benchmarked 29% of residents are 95 or older, compared to the Maryland average of 16%. A high proportion of the oldest-old suggests strong end-of-life care experience and very-high-acuity capabilities. |
| Brightview Hunt Valley |
AL Assisted Living A licensed, long-term care setting for seniors or individuals with disabilities who need help with daily activities — like bathing, dressing, and medication management — but not 24-hour skilled nursing. Offers housing, meals, and around-the-clock support while aiming to maximize resident independence.
IL Independent Living Lifestyle-focused communities for older adults offering dining, activities, and transportation with minimal personal care. Best for active, independent seniors who want community without medical support.
MC Memory Care Secured, specialized care for people living with Alzheimer's or dementia. Staff trained in cognitive impairment, with higher staff-to-resident ratios and an environment designed to reduce confusion and wandering risk. | Cockeysville (Hunt Valley) | 95
Facility
95
MD AVG
44
Rank
#148 / 697 | No |
49
Facility
49
MD AVG
43
Rank
#431 / 985 | Studio / 1 Bed / 2 Bed | - | - | - | - | - | - | - | - | - | - |
| Symphony Manor |
AL Assisted Living A licensed, long-term care setting for seniors or individuals with disabilities who need help with daily activities — like bathing, dressing, and medication management — but not 24-hour skilled nursing. Offers housing, meals, and around-the-clock support while aiming to maximize resident independence.
IL Independent Living Lifestyle-focused communities for older adults offering dining, activities, and transportation with minimal personal care. Best for active, independent seniors who want community without medical support. | Baltimore (Roland Park) | 69
Facility
69
MD AVG
44
Rank
#198 / 697 | Yes |
71
Facility
71
MD AVG
43
Rank
#175 / 985 | Studio / 1 Bed / 2 Bed | 15
Facility
15
MD AVG
21
Rank
#132 / 208 |
21% Male Residents — State Benchmarked 21% of residents are male, compared to the Maryland average of 31%. This facility caters to a majority female resident pool (79% female), consistent with the broader assisted living trend where women significantly outnumber men. |
79% Female Residents — State Benchmarked 79% of residents are female, compared to the Maryland average of 69%. Women comprise the large majority, consistent with national assisted living demographics where women live longer and enter care facilities at higher rates. |
79% White Residents — State Benchmarked 79% of residents are reported as White, compared to the Maryland average of 81%. Close to the average for this category among assisted living facilities in Maryland with reported race/ethnicity data. |
19% African American Residents — State Benchmarked 19% of residents are reported as African American or Black, compared to the Maryland average of 13%. In line with the Maryland average for African American residents among facilities reporting this breakdown. |
1% Other Ethnicity Residents — State Benchmarked 1% of residents fall into categories other than White or African American (combined), compared to the Maryland average of 6%. This column aggregates Hispanic, Asian, multiracial, and any other labeled groups that are not classified as White or African American. Reported subgroups in this total: Asian (1%). |
15% Residents Age 65–74 — State Benchmarked 15% of residents are 65–74, compared to the Maryland average of 13%. In line with the statewide profile for this youngest senior bracket in assisted living. |
44% Residents Age 75–84 — State Benchmarked 44% of residents are 75–84, compared to the Maryland average of 31%. A high concentration in this mid-range bracket, where residents typically need moderate support with daily activities. |
18% Residents Age 85–94 — State Benchmarked 18% of residents are 85–94, compared to the Maryland average of 44%. The population here skews younger than the statewide norm, which may indicate a more active, lower-acuity community. |
24% Residents Age 95+ — State Benchmarked 24% of residents are 95 or older, compared to the Maryland average of 16%. A high proportion of the oldest-old suggests strong end-of-life care experience and very-high-acuity capabilities. |
Frequently Asked Questions about Brightview Hunt Valley
What neighborhood is Brightview Hunt Valley in?
Brightview Hunt Valley is in the Hunt Valley neighborhood of Cockeysville.
Is Brightview Hunt Valley in a walkable area?
Brightview Hunt Valley has a walk score of 49. Somewhat walkable. A few nearby services may be reachable on foot, but most trips require transportation.
How many beds does Brightview Hunt Valley have?
Brightview Hunt Valley has 95 beds.
Are there photos of Brightview Hunt Valley?
Yes — there are 4 photos of Brightview Hunt Valley in the photo gallery on this page.
What is the phone number of Brightview Hunt Valley?
(410) 527-9999 will put you in contact with the team at Brightview Hunt Valley.
What county is Brightview Hunt Valley located in?
Brightview Hunt Valley is in Baltimore County.
Is Brightview Hunt Valley Medicare or Medicaid certified?
Brightview Hunt Valley is not currently listed as a CMS-certified provider of Medicare or Medicaid.
Guides for Better Senior Living
Care Cost Calculator: See Prices in Your Area
Nursing Home Data Explorer
Don’t Wait Too Long: 7 Red Flag Signs Your Parent Needs Assisted Living Now
The True Cost of Assisted Living in 2025 – And How Families Are Paying For It
Understanding Senior Living Costs: Pricing Models, Discounts & Financial Assistance
Contact Us

Published on
Updated on
Feedback
Write a review for Brightview Hunt Valley
Rate your overall experience with this community
Explore Open Rooms
1
Contact details
2
What type of senior care service are you looking for?
3
What budget do you have in mind for senior care?
4
How soon do you need to find care?
5
Additional details
Thank you for your interest!
Our team will be in touch shortly to help with next steps.
Need Help?
Let us help you or a loved one find the perfect senior home.
