


Brightview West End
Assisted Living, Independent Living & Memory Care · Rockville, MD
Brightview West End
Assisted Living, Independent Living & Memory Care · Rockville, MD
Overview of Brightview West End
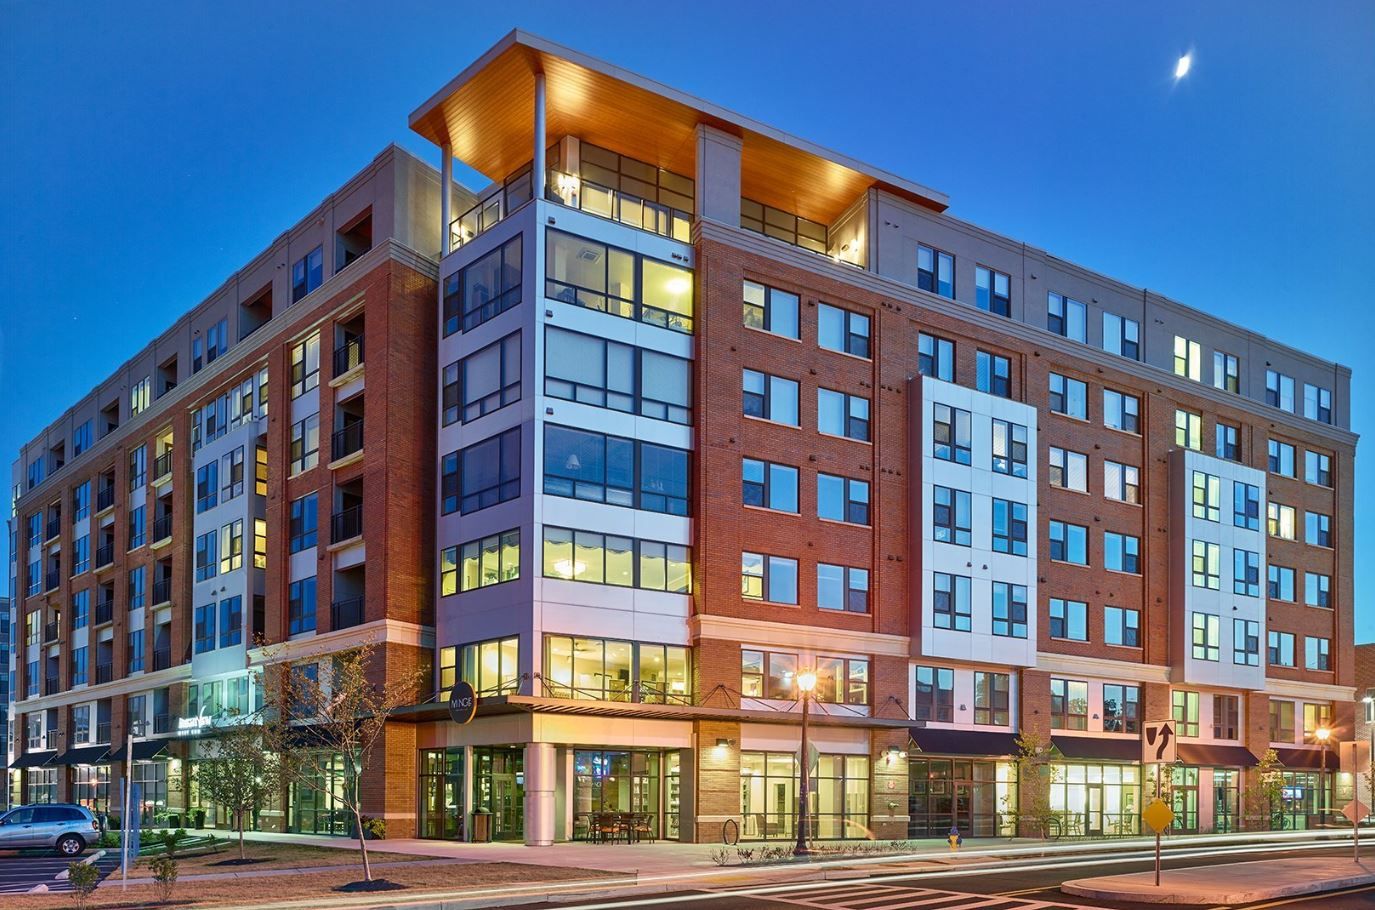
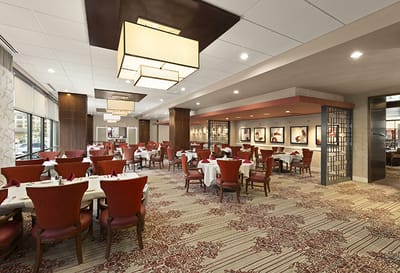
Set in the bustling city of Rockville, MD, Brightview West End is a dedicated senior living community that offers independent living, assisted living, memory care, or enhanced care for residents needing a higher level of care. Residents can comfortably enjoy their personal time in the comfort of beautifully designed apartments, ranging from deluxe studios to one and two bedroom apartments. The community makes residents’ lives much easier through their wide array of services, including 24-hour concierge services, housekeeping and maintenance.
At Brightview West End, residents stay connected with a wide range of activities and amenities. Residents enjoy spending their time playing cards, doing movie marathons with friends, or reading their favorite book at the comfort of their apartments. With emergency call systems, secured entry systems, and 24-hour on-site team members, residents have peace of mind knowing they are in a safe and secured environment.
98-bed community Rank #138 / 697Bed count — State benchmarkedThis home is ranked 138th out of 697 homes in Maryland. Shows this facility's certified or reported bed count compared to other Maryland SNFs. Larger communities may offer more amenities, programs, and on-site services for residents and families.Click the rank badge to see the full State ranking.Click here to see the full State ranking.
A larger shared setting that may offer more common spaces and organized community services.
8 years in operation Rank #162 / 208Years in operation — State benchmarkedThis home is ranked 162nd out of 208 homes in Maryland. Shows how long this facility has been in operation compared to other Maryland SNFs. Longer operating histories may benefit residents, families, and staff.Click the rank badge to see the full State ranking.Click here to see the full State ranking.
An established community with some operational experience and growing routines.
Walk Score: 89 / 100 Rank #32 / 985Walk Score — State benchmarkedThis home is ranked 32nd out of 985 homes in Maryland. Shows how walkable this facility's neighborhood is compared to the average Walk Score across Maryland SNFs. Higher scores benefit residents, families, and staff.Click the rank badge to see the full State ranking.Click here to see the full State ranking.
Very walkable. Most errands can be accomplished on foot, and many essentials are within a short walk.
About this community
Facility TypeAl
CountyMontgomery
AccreditationsBest Workplace in Aging Services, Brightview on U.S. News & World Report 2025 Best Senior Living Ratings
Brightview West End is legally operated by Brightview Senior Living.
Profit StatusTrue
Apartment
$286 - $447 per day
Hospice Affiliations
Staffing
Key information about the people who lead and staff this community.
No CNA training program
Dedicated Alzheimer's Unit
Mild Alzheimer's Level
Moderate Alzheimer's Level
Severe Alzheimer's Level
Enhanced Care
ActivitiesSample Program Calendar available.
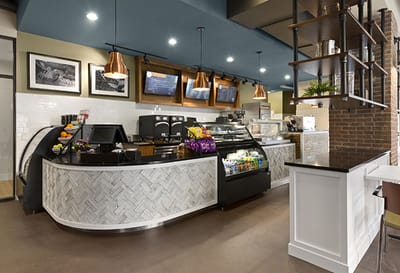
Food DescriptionResidents enjoy chef-prepared meals with menus designed based on local cuisine and resident interests.
Demographics
Resident demographic information for this facility.
Gender
- Female 68.4%
- Male 31.6%
Age Distribution
- 75-84 36.8%
- 85-94 33.3%
- 95+ 15.8%
- 65-74 14%
Ethnicity
- White 84.2%
- Other 5.3%
- African American 3.5%
- Asian 3.5%
- Mixed Race 3.5%
What does this home offer?
Pets Allowed
Housing Options: Studio / 1 Bed / 2 Bed
Building Type: Mid-rise
Transportation Services
Fitness and Recreation
Over 10 years of experience
Katie A. is the Community Executive Director at Brightview West End. She joined Brightview over 10 years ago, starting as a concierge and progressing through several community director roles. Katie now leads the community with extensive experience and a strong commitment to vibrant senior living.
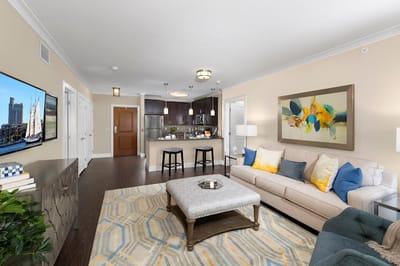
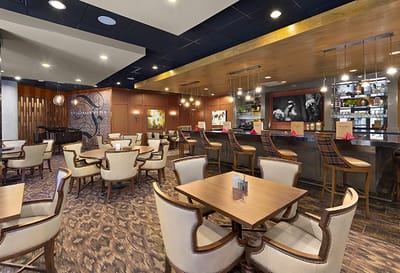
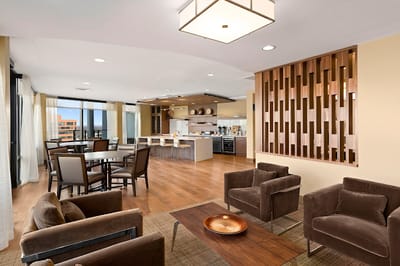
Living Spaces & Floor Plans for Brightview West End
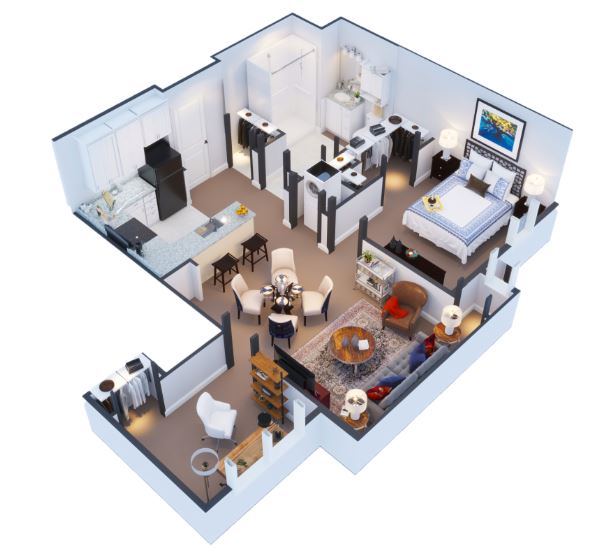
Brightview West End P2
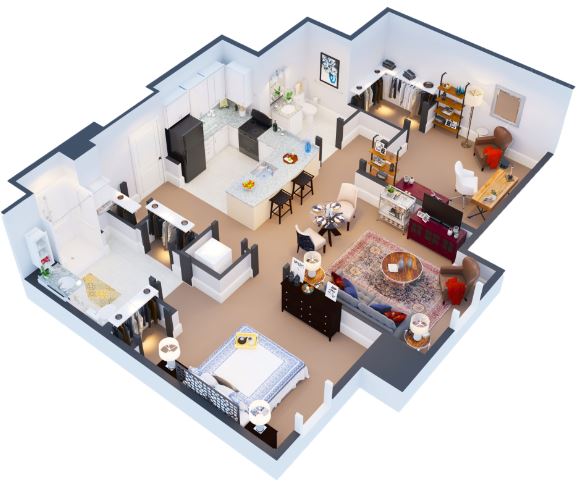
Brightview West End P3
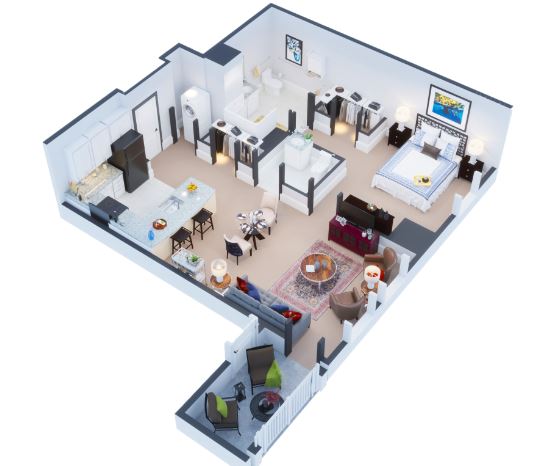
Brightview West End P4
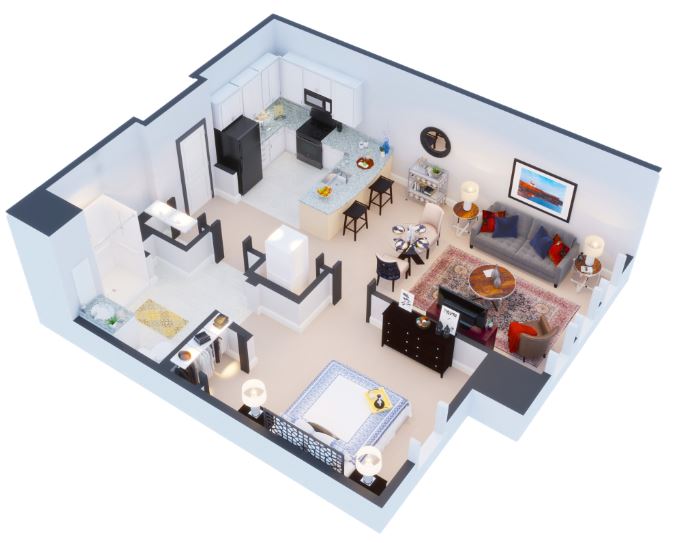
Brightview West End P1
Places of interest near Brightview West End
![]() 0.3 miles from city center
0.3 miles from city center
![]() Estimated distance in miles from Rockville's city center to Brightview West End's address, calculated via Google Maps.
— 2.57 miles to nearest hospital (Adventist HealthCare Shady Grove Medical Center)
Estimated distance in miles from Rockville's city center to Brightview West End's address, calculated via Google Maps.
— 2.57 miles to nearest hospital (Adventist HealthCare Shady Grove Medical Center)
Calculate Travel Distance to Brightview West End
Add your location
Financial Assistance for
Assisted Living in Maryland
Brightview West End is located in Rockville, Maryland.
Here are the financial assistance programs available to residents in Maryland.
Compare Assisted Living around Rockville
The information below is reported by the Maryland Department of Health, Office of Health Care Quality.
Filter by care type
| The Seneca Rockville |
AL Assisted Living A licensed, long-term care setting for seniors or individuals with disabilities who need help with daily activities — like bathing, dressing, and medication management — but not 24-hour skilled nursing. Offers housing, meals, and around-the-clock support while aiming to maximize resident independence. | Rockville (King Farm) | 156
Facility
156
MD AVG
44
Rank
#39 / 697 | Yes |
45
Facility
45
MD AVG
43
Rank
#475 / 985 | Studio / 1 Bed / 2 Bed | 4
Facility
4
MD AVG
21
Rank
#191 / 208 | - |
32% Male Residents — State Benchmarked 32% of residents are male, compared to the Maryland average of 31%. This facility caters to a majority female resident pool (68% female), consistent with the broader assisted living trend where women significantly outnumber men. |
68% Female Residents — State Benchmarked 68% of residents are female, compared to the Maryland average of 69%. Women comprise the large majority, consistent with national assisted living demographics where women live longer and enter care facilities at higher rates. |
87% White Residents — State Benchmarked 87% of residents are reported as White, compared to the Maryland average of 81%. Close to the average for this category among assisted living facilities in Maryland with reported race/ethnicity data. |
2% African American Residents — State Benchmarked 2% of residents are reported as African American or Black, compared to the Maryland average of 13%. A lower African American share than is typical in Maryland; local markets still vary widely. |
11% Other Ethnicity Residents — State Benchmarked 11% of residents fall into categories other than White or African American (combined), compared to the Maryland average of 6%. This column aggregates Hispanic, Asian, multiracial, and any other labeled groups that are not classified as White or African American. Reported subgroups in this total: Asian (10%), Hispanic (2%). |
8% Residents Age 65–74 — State Benchmarked 8% of residents are 65–74, compared to the Maryland average of 13%. Fewer younger seniors suggests the resident population skews older, likely requiring higher acuity care and more hands-on support. |
34% Residents Age 75–84 — State Benchmarked 34% of residents are 75–84, compared to the Maryland average of 31%. This is the second most common age bracket in assisted living, representing residents with moderate care needs. |
45% Residents Age 85–94 — State Benchmarked 45% of residents are 85–94, compared to the Maryland average of 44%. This is typically the most common age bracket in assisted living — this facility is in line with the statewide norm. |
13% Residents Age 95+ — State Benchmarked 13% of residents are 95 or older, compared to the Maryland average of 16%. In line with the statewide profile for the oldest resident bracket. |
| Brightview West End |
AL Assisted Living A licensed, long-term care setting for seniors or individuals with disabilities who need help with daily activities — like bathing, dressing, and medication management — but not 24-hour skilled nursing. Offers housing, meals, and around-the-clock support while aiming to maximize resident independence.
IL Independent Living Lifestyle-focused communities for older adults offering dining, activities, and transportation with minimal personal care. Best for active, independent seniors who want community without medical support.
MC Memory Care Secured, specialized care for people living with Alzheimer's or dementia. Staff trained in cognitive impairment, with higher staff-to-resident ratios and an environment designed to reduce confusion and wandering risk. | Rockville | 98
Facility
98
MD AVG
44
Rank
#138 / 697 | Yes |
89
Facility
89
MD AVG
43
Rank
#32 / 985 | Studio / 1 Bed / 2 Bed | 8
Facility
8
MD AVG
21
Rank
#162 / 208 | - |
32% Male Residents — State Benchmarked 32% of residents are male, compared to the Maryland average of 31%. This facility caters to a majority female resident pool (68% female), consistent with the broader assisted living trend where women significantly outnumber men. |
68% Female Residents — State Benchmarked 68% of residents are female, compared to the Maryland average of 69%. Women comprise the large majority, consistent with national assisted living demographics where women live longer and enter care facilities at higher rates. |
84% White Residents — State Benchmarked 84% of residents are reported as White, compared to the Maryland average of 81%. Close to the average for this category among assisted living facilities in Maryland with reported race/ethnicity data. |
4% African American Residents — State Benchmarked 4% of residents are reported as African American or Black, compared to the Maryland average of 13%. A lower African American share than is typical in Maryland; local markets still vary widely. |
12% Other Ethnicity Residents — State Benchmarked 12% of residents fall into categories other than White or African American (combined), compared to the Maryland average of 6%. This column aggregates Hispanic, Asian, multiracial, and any other labeled groups that are not classified as White or African American. Reported subgroups in this total: Other (5%), Asian (4%), Mixed Race (4%). |
14% Residents Age 65–74 — State Benchmarked 14% of residents are 65–74, compared to the Maryland average of 13%. In line with the statewide profile for this youngest senior bracket in assisted living. |
37% Residents Age 75–84 — State Benchmarked 37% of residents are 75–84, compared to the Maryland average of 31%. A high concentration in this mid-range bracket, where residents typically need moderate support with daily activities. |
33% Residents Age 85–94 — State Benchmarked 33% of residents are 85–94, compared to the Maryland average of 44%. The population here skews younger than the statewide norm, which may indicate a more active, lower-acuity community. |
16% Residents Age 95+ — State Benchmarked 16% of residents are 95 or older, compared to the Maryland average of 16%. In line with the statewide profile for the oldest resident bracket. |
| Landow House |
AL Assisted Living A licensed, long-term care setting for seniors or individuals with disabilities who need help with daily activities — like bathing, dressing, and medication management — but not 24-hour skilled nursing. Offers housing, meals, and around-the-clock support while aiming to maximize resident independence.
IL Independent Living Lifestyle-focused communities for older adults offering dining, activities, and transportation with minimal personal care. Best for active, independent seniors who want community without medical support. | Rockville (Rollins Park) | 98
Facility
98
MD AVG
44
Rank
#138 / 697 | Yes |
59
Facility
59
MD AVG
43
Rank
#327 / 985 | Studio / 1 Bed / 2 Bed | 31
Facility
31
MD AVG
21
Rank
#38 / 208 | - |
31% Male Residents — State Benchmarked 31% of residents are male, compared to the Maryland average of 31%. This facility caters to a majority female resident pool (69% female), consistent with the broader assisted living trend where women significantly outnumber men. |
69% Female Residents — State Benchmarked 69% of residents are female, compared to the Maryland average of 69%. Women comprise the large majority, consistent with national assisted living demographics where women live longer and enter care facilities at higher rates. |
99% White Residents — State Benchmarked 99% of residents are reported as White, compared to the Maryland average of 81%. A higher White share than is typical for assisted living in Maryland in this dataset — compare with peer facilities for local context. |
0% African American Residents — State Benchmarked 0% of residents are reported as African American or Black, compared to the Maryland average of 13%. A lower African American share than is typical in Maryland; local markets still vary widely. |
1% Other Ethnicity Residents — State Benchmarked 1% of residents fall into categories other than White or African American (combined), compared to the Maryland average of 6%. This column aggregates Hispanic, Asian, multiracial, and any other labeled groups that are not classified as White or African American. Reported subgroups in this total: Asian (1%). |
7% Residents Age 65–74 — State Benchmarked 7% of residents are 65–74, compared to the Maryland average of 13%. Fewer younger seniors suggests the resident population skews older, likely requiring higher acuity care and more hands-on support. |
20% Residents Age 75–84 — State Benchmarked 20% of residents are 75–84, compared to the Maryland average of 31%. Below the state norm — the resident mix may skew either younger or older than this typical middle bracket. |
49% Residents Age 85–94 — State Benchmarked 49% of residents are 85–94, compared to the Maryland average of 44%. A high concentration of very elderly residents signals a higher-acuity facility with experience caring for advanced age-related needs. |
24% Residents Age 95+ — State Benchmarked 24% of residents are 95 or older, compared to the Maryland average of 16%. A high proportion of the oldest-old suggests strong end-of-life care experience and very-high-acuity capabilities. |
| Sunrise of Rockville |
AL Assisted Living A licensed, long-term care setting for seniors or individuals with disabilities who need help with daily activities — like bathing, dressing, and medication management — but not 24-hour skilled nursing. Offers housing, meals, and around-the-clock support while aiming to maximize resident independence. | Rockville (Baltimore Road) | 89
Facility
89
MD AVG
44
Rank
#165 / 697 | Yes |
89
Facility
89
MD AVG
43
Rank
#32 / 985 | Studio / 1 Bed / 2 Bed | 45
Facility
45
MD AVG
21
Rank
#4 / 208 | A- |
23% Male Residents — State Benchmarked 23% of residents are male, compared to the Maryland average of 31%. This facility caters to a majority female resident pool (77% female), consistent with the broader assisted living trend where women significantly outnumber men. |
77% Female Residents — State Benchmarked 77% of residents are female, compared to the Maryland average of 69%. Women comprise the large majority, consistent with national assisted living demographics where women live longer and enter care facilities at higher rates. |
87% White Residents — State Benchmarked 87% of residents are reported as White, compared to the Maryland average of 81%. Close to the average for this category among assisted living facilities in Maryland with reported race/ethnicity data. |
2% African American Residents — State Benchmarked 2% of residents are reported as African American or Black, compared to the Maryland average of 13%. A lower African American share than is typical in Maryland; local markets still vary widely. |
11% Other Ethnicity Residents — State Benchmarked 11% of residents fall into categories other than White or African American (combined), compared to the Maryland average of 6%. This column aggregates Hispanic, Asian, multiracial, and any other labeled groups that are not classified as White or African American. Reported subgroups in this total: Mixed Race (6%), Hispanic (3%), Asian (2%). |
3% Residents Age 65–74 — State Benchmarked 3% of residents are 65–74, compared to the Maryland average of 13%. Fewer younger seniors suggests the resident population skews older, likely requiring higher acuity care and more hands-on support. |
31% Residents Age 75–84 — State Benchmarked 31% of residents are 75–84, compared to the Maryland average of 31%. This is the second most common age bracket in assisted living, representing residents with moderate care needs. |
56% Residents Age 85–94 — State Benchmarked 56% of residents are 85–94, compared to the Maryland average of 44%. A high concentration of very elderly residents signals a higher-acuity facility with experience caring for advanced age-related needs. |
10% Residents Age 95+ — State Benchmarked 10% of residents are 95 or older, compared to the Maryland average of 16%. Most residents here have not yet reached the oldest-old bracket, suggesting a younger overall community. |
| AlfredHouse Symphony |
AL Assisted Living A licensed, long-term care setting for seniors or individuals with disabilities who need help with daily activities — like bathing, dressing, and medication management — but not 24-hour skilled nursing. Offers housing, meals, and around-the-clock support while aiming to maximize resident independence.
MC Memory Care Secured, specialized care for people living with Alzheimer's or dementia. Staff trained in cognitive impairment, with higher staff-to-resident ratios and an environment designed to reduce confusion and wandering risk.
RC Respite Care Short-term temporary care — days to weeks — to give family caregivers a break. Full care provided during the stay. Often used after hospitalization or to trial a facility before a permanent placement decision. | Derwood | 34
Facility
34
MD AVG
44
Rank
#249 / 697 | No |
6
Facility
6
MD AVG
43
Rank
#891 / 985 | Studio / 1 Bed / 2 Bed | 9
Facility
9
MD AVG
21
Rank
#159 / 208 | - |
40% Male Residents — State Benchmarked 40% of residents are male, compared to the Maryland average of 31%. A relatively balanced gender mix for assisted living, where facilities typically skew heavily female. |
60% Female Residents — State Benchmarked 60% of residents are female, compared to the Maryland average of 69%. Closer to an even gender split than most assisted living facilities, which typically have 65–75% female residents. |
84% White Residents — State Benchmarked 84% of residents are reported as White, compared to the Maryland average of 81%. Close to the average for this category among assisted living facilities in Maryland with reported race/ethnicity data. |
16% African American Residents — State Benchmarked 16% of residents are reported as African American or Black, compared to the Maryland average of 13%. In line with the Maryland average for African American residents among facilities reporting this breakdown. |
0% Other Ethnicity Residents — State Benchmarked 0% of residents fall into categories other than White or African American (combined), compared to the Maryland average of 6%. This column aggregates Hispanic, Asian, multiracial, and any other labeled groups that are not classified as White or African American. |
28% Residents Age 65–74 — State Benchmarked 28% of residents are 65–74, compared to the Maryland average of 13%. A higher share of younger seniors often signals a more independent, active resident community with lower acuity care needs. |
32% Residents Age 75–84 — State Benchmarked 32% of residents are 75–84, compared to the Maryland average of 31%. This is the second most common age bracket in assisted living, representing residents with moderate care needs. |
40% Residents Age 85–94 — State Benchmarked 40% of residents are 85–94, compared to the Maryland average of 44%. This is typically the most common age bracket in assisted living — this facility is in line with the statewide norm. | - |
Frequently Asked Questions about Brightview West End
Who is the owner of Brightview West End?
The legal owner and operator of Brightview West End is Brightview Senior Living.
Is Brightview West End in a walkable area?
Brightview West End has a walk score of 89. Very walkable. Most errands can be accomplished on foot, and many essentials are within a short walk.
How many beds does Brightview West End have?
Brightview West End has 98 beds.
Are there photos of Brightview West End?
Yes — there are 6 photos of Brightview West End in the photo gallery on this page.
What is the address of Brightview West End?
Brightview West End is located at 285 North Washington St., Rockville, MD 20850.
What is the phone number of Brightview West End?
(301) 250-1628 will put you in contact with the team at Brightview West End.
What county is Brightview West End located in?
Brightview West End is in Montgomery County.
Guides for Better Senior Living
Care Cost Calculator: See Prices in Your Area
Nursing Home Data Explorer
Don’t Wait Too Long: 7 Red Flag Signs Your Parent Needs Assisted Living Now
The True Cost of Assisted Living in 2025 – And How Families Are Paying For It
Understanding Senior Living Costs: Pricing Models, Discounts & Financial Assistance
Contact Us

Published on
Updated on
Feedback
Write a review for Brightview West End
Rate your overall experience with this community
Explore Open Rooms
1
Contact details
2
What type of senior care service are you looking for?
3
What budget do you have in mind for senior care?
4
How soon do you need to find care?
5
Additional details
Thank you for your interest!
Our team will be in touch shortly to help with next steps.
Need Help?
Let us help you or a loved one find the perfect senior home.
