


Brookdale Olney
Assisted Living & Memory Care · Olney, MD
Brookdale Olney
Assisted Living & Memory Care · Olney, MD
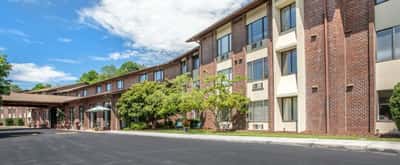
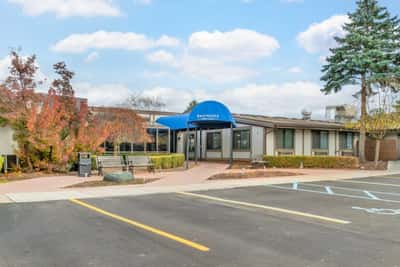
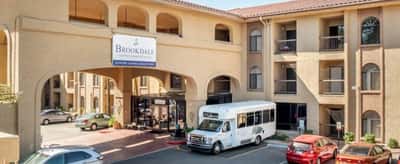
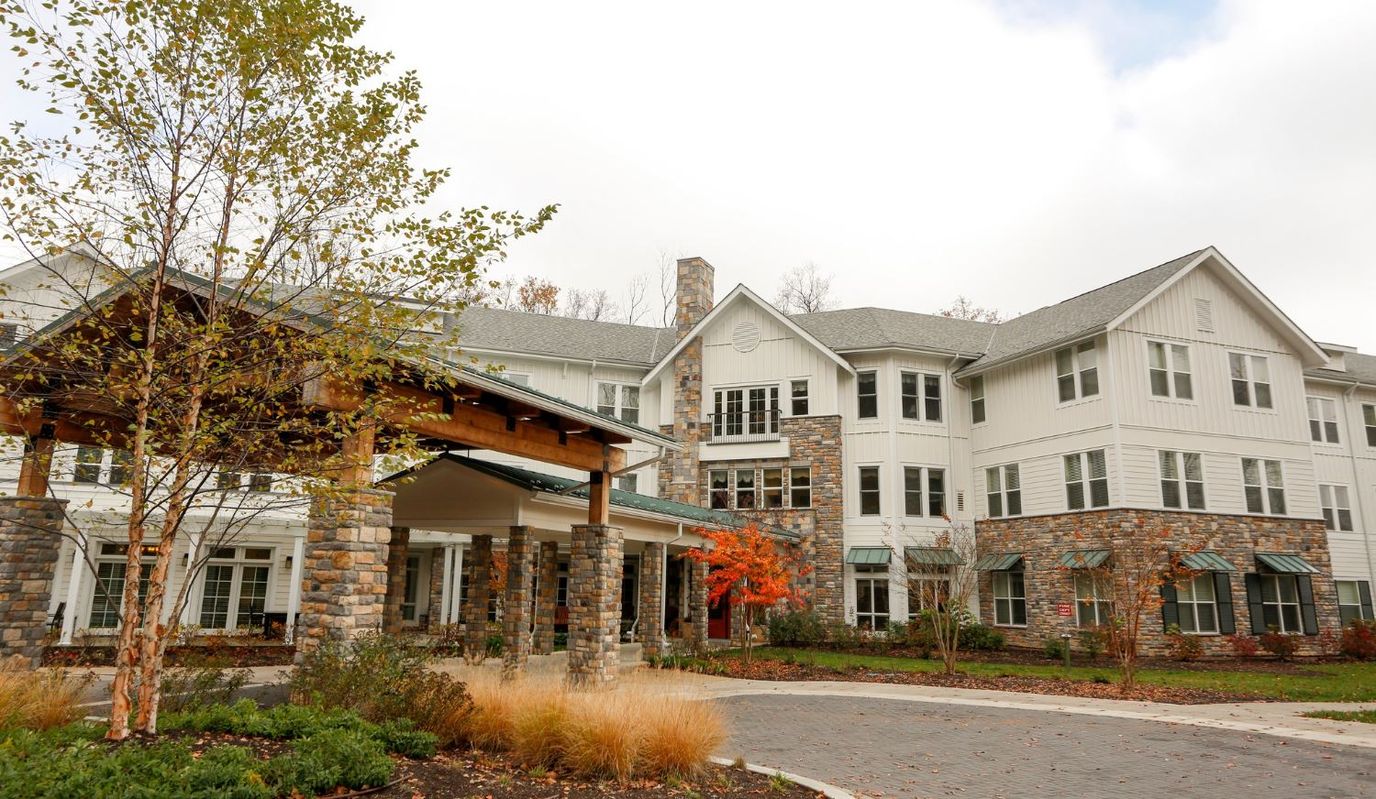
An hour away from Easton, Brookdale Olney provides an exceptional assisted and memory care senior living experience. The home strives to enhance the quality of life of seniors needing quality assistance. They offer options that cater to each individual’s needs. As a Brookdale Senior Living Group member, Olney guarantees a resident-centered atmosphere for seniors, promoting a comfortable living situation.
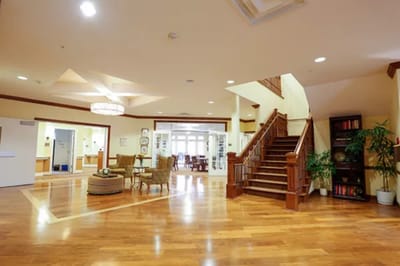
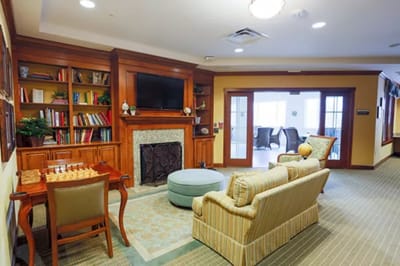
The lifestyle at Brookdale is designed to make lives safe and convenient for everyone. Its all-inclusive amenities and services include spacious common areas, recreational rooms, housekeeping, and transportation services. Management prides itself on its approach to modern assisted living care, which is unparalleled thanks to its remarkable care staff that never fails to offer compassionate care.
94-bed community Rank #144 / 690Bed count — State benchmarkedThis home is ranked 144th out of 690 homes in Maryland for Bed Count. Shows this facility's certified or reported bed count compared to other Maryland facilities. Larger communities may offer more amenities, programs, and on-site services for residents and families.Facilities with the same value for a metric share the same rank. Rankings are based only on facilities in Maryland that report data for that category. Facilities without available data are excluded from the ranking.Click the rank badge to see the full State ranking.Click here to see the full State ranking.
A larger shared setting that may offer more common spaces and organized community services.
13 years in operation Rank #142 / 210Years in operation — State benchmarkedThis home is ranked 142nd out of 210 homes in Maryland for Years In Operation. Shows how long this facility has been in operation compared to other Maryland facilities. Longer operating histories may benefit residents, families, and staff.Facilities with the same value for a metric share the same rank. Rankings are based only on facilities in Maryland that report data for that category. Facilities without available data are excluded from the ranking.Click the rank badge to see the full State ranking.Click here to see the full State ranking.
A community with a solid operating history and experience delivering ongoing care.
Walk Score: 16 / 100 Rank #772 / 985Walk Score — State benchmarkedThis home is ranked 772nd out of 985 homes in Maryland for Walk Score. Shows how walkable this facility's neighborhood is compared to the average Walk Score across Maryland facilities. Higher scores benefit residents, families, and staff.Facilities with the same value for a metric share the same rank. Rankings are based only on facilities in Maryland that report data for that category. Facilities without available data are excluded from the ranking.Click the rank badge to see the full State ranking.Click here to see the full State ranking.
Car-dependent. Most errands require a car, with limited nearby walkable options.
About this community
Facility TypeAssisted Living
CountyMontgomery
Apartment
$206 - $259 per day
Wheelchair Accessible
Emergency SystemsYes
Safety FeaturesEmergency Alert System
Hospice Affiliations
Respite Care
Licensed Nurses/CNAs
24-Hour Staffing
Dedicated Alzheimer's Unit
Mild Alzheimer's Level
Moderate Alzheimer's Level
Severe Alzheimer's Level
HousekeepingYes
Pet Friendly
Transportation
Library
Coffee Shop
Beauty/Barber Shop
Courtyard And Garden
Private Dining Room
Theatre
Walking Paths
Landscaped Grounds
Whirlpool
Piano
Activitiespainting classes, storytelling sessions, chair yoga
Touring HoursMon - Fri: 8am - 9pm CT / Sat: 9am - 5:30pm CT
Assisted Living$6,055 per month
Memory Care$7,265 per month
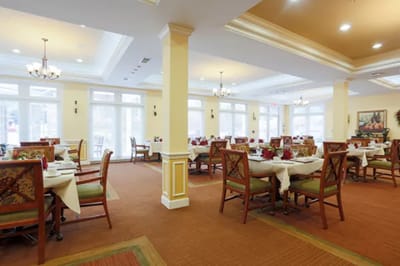
Food DescriptionBrookdale Olney offers restaurant-style dining with a focus on healthy and delicious menu options.
Brookdale Olney – Menu
Download Menu PDFDemographics
Resident demographic information for this facility.
Gender
- Female 66.7%
- Male 33.3%
Age Distribution
- 75-84 38.9%
- 95+ 27.8%
- 85-94 22.2%
- 65-74 8.3%
- ≤64 2.8%
Ethnicity
- White 94.4%
- African American 2.8%
- Asian 2.8%
What does this home offer?
Pets Allowed
Room Sizes: 333 / 364 / 397 / 413 - 731 sq. ft
Housing Options: Studio / 1 Bed / 2 Bed
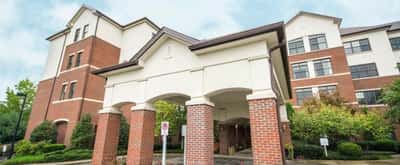
Building Type: 3-story
Transportation Services
Fitness and Recreation
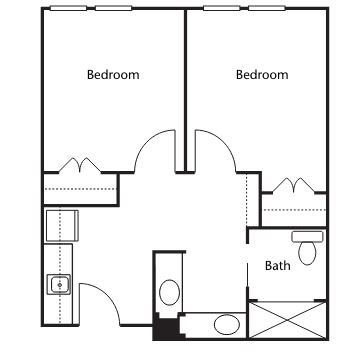
Living Spaces & Floor Plans for Brookdale Olney
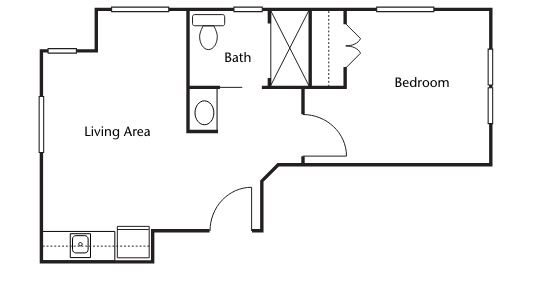
1 Bedroom
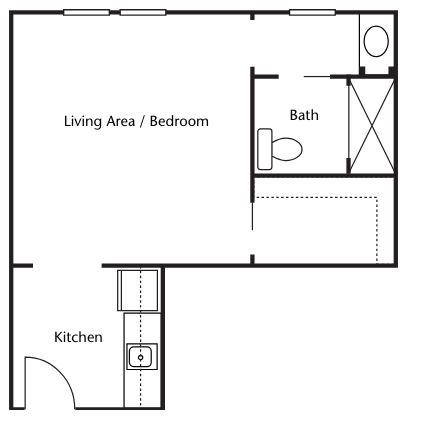
Studio
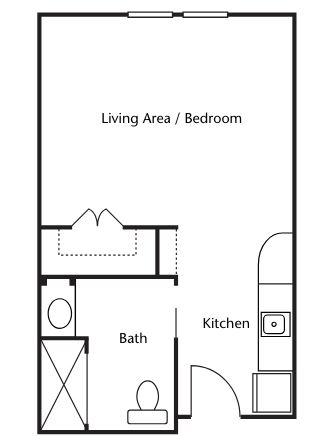
Studio
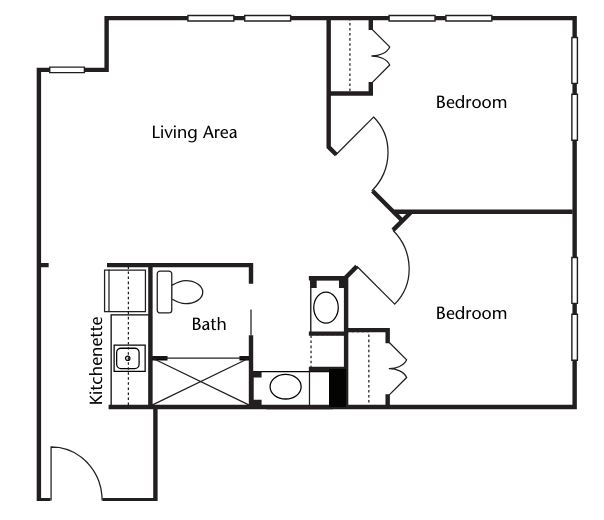
2 bedroom
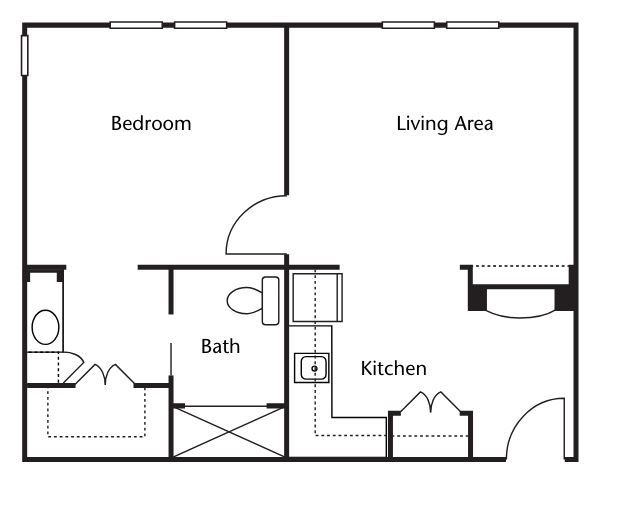
1 Bedroom
1 Bedroom
Places of interest near Brookdale Olney
![]() 0.8 miles from city center
0.8 miles from city center
![]() Estimated distance in miles from Olney's city center to Brookdale Olney's address, calculated via Google Maps.
— 8.64 miles to nearest hospital (Adventist HealthCare Shady Grove Medical Center)
Estimated distance in miles from Olney's city center to Brookdale Olney's address, calculated via Google Maps.
— 8.64 miles to nearest hospital (Adventist HealthCare Shady Grove Medical Center)
Calculate Travel Distance to Brookdale Olney
Add your location
Compare Assisted Living around Easton
The information below is reported by the Maryland Department of Health, Office of Health Care Quality.
| Bayleigh Chase | AL NH | Easton (South Pennsfield) | 99
Facility
99
MD AVG
43
Rank
#127 / 690 | No |
38
Facility
38
MD AVG
43
Rank
#542 / 985 | - | - | - | - | - | - | - | - | - | - | - | - |
| Brookdale Olney | AL MC | Olney (Olney Estates) | 94
Facility
94
MD AVG
43
Rank
#144 / 690 | Yes |
16
Facility
16
MD AVG
43
Rank
#772 / 985 | Studio / 1 Bed / 2 Bed | 13
Facility
13
MD AVG
21
Rank
#142 / 210 | - |
33% Male Residents — State Benchmarked 33% of residents are male, compared to the Maryland average of 31%. This facility caters to a majority female resident pool (67% female), consistent with the broader assisted living trend where women significantly outnumber men. |
67% Female Residents — State Benchmarked 67% of residents are female, compared to the Maryland average of 69%. Women comprise the large majority, consistent with national assisted living demographics where women live longer and enter care facilities at higher rates. |
94% White Residents — State Benchmarked 94% of residents are reported as White, compared to the Maryland average of 81%. A higher White share than is typical for assisted living in Maryland in this dataset — compare with peer facilities for local context. |
3% African American Residents — State Benchmarked 3% of residents are reported as African American or Black, compared to the Maryland average of 13%. A lower African American share than is typical in Maryland; local markets still vary widely. |
3% Other Ethnicity Residents — State Benchmarked 3% of residents fall into categories other than White or African American (combined), compared to the Maryland average of 6%. This column aggregates Hispanic, Asian, multiracial, and any other labeled groups that are not classified as White or African American. Reported subgroups in this total: Asian (3%). |
8% Residents Age 65–74 — State Benchmarked 8% of residents are 65–74, compared to the Maryland average of 13%. Fewer younger seniors suggests the resident population skews older, likely requiring higher acuity care and more hands-on support. |
39% Residents Age 75–84 — State Benchmarked 39% of residents are 75–84, compared to the Maryland average of 31%. A high concentration in this mid-range bracket, where residents typically need moderate support with daily activities. |
22% Residents Age 85–94 — State Benchmarked 22% of residents are 85–94, compared to the Maryland average of 44%. The population here skews younger than the statewide norm, which may indicate a more active, lower-acuity community. |
28% Residents Age 95+ — State Benchmarked 28% of residents are 95 or older, compared to the Maryland average of 16%. A high proportion of the oldest-old suggests strong end-of-life care experience and very-high-acuity capabilities. |
| Candle Light Cove | AL MC RC | Easton (West Earle Avenue) | 64
Facility
64
MD AVG
43
Rank
#198 / 690 | Yes |
50
Facility
50
MD AVG
43
Rank
#419 / 985 | Private Rooms | 22
Facility
22
MD AVG
21
Rank
#105 / 210 | - |
27% Male Residents — State Benchmarked 27% of residents are male, compared to the Maryland average of 31%. This facility caters to a majority female resident pool (73% female), consistent with the broader assisted living trend where women significantly outnumber men. |
73% Female Residents — State Benchmarked 73% of residents are female, compared to the Maryland average of 69%. Women comprise the large majority, consistent with national assisted living demographics where women live longer and enter care facilities at higher rates. |
100% White Residents — State Benchmarked 100% of residents are reported as White, compared to the Maryland average of 81%. A higher White share than is typical for assisted living in Maryland in this dataset — compare with peer facilities for local context. |
0% African American Residents — State Benchmarked 0% of residents are reported as African American or Black, compared to the Maryland average of 13%. A lower African American share than is typical in Maryland; local markets still vary widely. |
0% Other Ethnicity Residents — State Benchmarked 0% of residents fall into categories other than White or African American (combined), compared to the Maryland average of 6%. This column aggregates Hispanic, Asian, multiracial, and any other labeled groups that are not classified as White or African American. |
2% Residents Age 65–74 — State Benchmarked 2% of residents are 65–74, compared to the Maryland average of 13%. Fewer younger seniors suggests the resident population skews older, likely requiring higher acuity care and more hands-on support. |
38% Residents Age 75–84 — State Benchmarked 38% of residents are 75–84, compared to the Maryland average of 31%. A high concentration in this mid-range bracket, where residents typically need moderate support with daily activities. |
48% Residents Age 85–94 — State Benchmarked 48% of residents are 85–94, compared to the Maryland average of 44%. This is typically the most common age bracket in assisted living — this facility is in line with the statewide norm. |
12% Residents Age 95+ — State Benchmarked 12% of residents are 95 or older, compared to the Maryland average of 16%. In line with the statewide profile for the oldest resident bracket. |
| The Dixon House | AL | Easton | 19
Facility
19
MD AVG
43
Rank
#252 / 690 | No |
80
Facility
80
MD AVG
43
Rank
#93 / 985 | Private Rooms | - | - |
25% Male Residents — State Benchmarked 25% of residents are male, compared to the Maryland average of 31%. This facility caters to a majority female resident pool (75% female), consistent with the broader assisted living trend where women significantly outnumber men. |
75% Female Residents — State Benchmarked 75% of residents are female, compared to the Maryland average of 69%. Women comprise the large majority, consistent with national assisted living demographics where women live longer and enter care facilities at higher rates. |
100% White Residents — State Benchmarked 100% of residents are reported as White, compared to the Maryland average of 81%. A higher White share than is typical for assisted living in Maryland in this dataset — compare with peer facilities for local context. |
0% African American Residents — State Benchmarked 0% of residents are reported as African American or Black, compared to the Maryland average of 13%. A lower African American share than is typical in Maryland; local markets still vary widely. |
0% Other Ethnicity Residents — State Benchmarked 0% of residents fall into categories other than White or African American (combined), compared to the Maryland average of 6%. This column aggregates Hispanic, Asian, multiracial, and any other labeled groups that are not classified as White or African American. |
19% Residents Age 65–74 — State Benchmarked 19% of residents are 65–74, compared to the Maryland average of 13%. A higher share of younger seniors often signals a more independent, active resident community with lower acuity care needs. |
6% Residents Age 75–84 — State Benchmarked 6% of residents are 75–84, compared to the Maryland average of 31%. Below the state norm — the resident mix may skew either younger or older than this typical middle bracket. |
63% Residents Age 85–94 — State Benchmarked 63% of residents are 85–94, compared to the Maryland average of 44%. A high concentration of very elderly residents signals a higher-acuity facility with experience caring for advanced age-related needs. |
13% Residents Age 95+ — State Benchmarked 13% of residents are 95 or older, compared to the Maryland average of 16%. In line with the statewide profile for the oldest resident bracket. |
| HeartFields Assisted Living at Easton | AL MC | Easton (Londonderry) | - | Yes |
27
Facility
27
MD AVG
43
Rank
#668 / 985 | Studio / 1 Bed / 2 Bed | 16
Facility
16
MD AVG
21
Rank
#128 / 210 | A+ | - | - | - | - | - | - | - | - | - |
Financial Assistance for
Assisted Living in Maryland
Brookdale Olney is located in Olney, Maryland.
Here are the financial assistance programs available to residents in Maryland.
More homes from the same operator
Operated by
Brookdale
Frequently Asked Questions about Brookdale Olney
What neighborhood is Brookdale Olney in?
Brookdale Olney is in the Olney Estates neighborhood of Olney.
Is Brookdale Olney in a walkable area?
Brookdale Olney has a walk score of 16. Car-dependent. Most errands require a car, with limited nearby walkable options.
Does Brookdale Olney have different floorplan options?
Yes — see the floorplan options available at Brookdale Olney on this page.
How many beds does Brookdale Olney have?
Brookdale Olney has 94 beds.
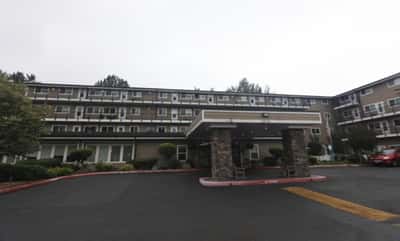
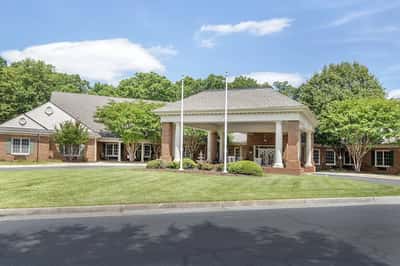
Are there photos of Brookdale Olney?
Yes — there are 4 photos of Brookdale Olney in the photo gallery on this page.
What is the address of Brookdale Olney?
Brookdale Olney is located at 2611 Olney Sandy Spring Rd, Olney, MD 20832.
What is the phone number of Brookdale Olney?
(301) 570-2611 will put you in contact with the team at Brookdale Olney.
Guides for Better Senior Living
Care Cost Calculator: See Prices in Your Area
Assisted Living Explorer
Don’t Wait Too Long: 7 Red Flag Signs Your Parent Needs Assisted Living Now
The True Cost of Assisted Living in 2025 – And How Families Are Paying For It
Understanding Senior Living Costs: Pricing Models, Discounts & Financial Assistance
Updated on
