• Home
  • Nursing Home in Florida
Brookdale Santa Barbara
Nursing Home & Memory Care · Cape Coral, FL
CMS overall rating Info CMS (the Centers for Medicare & Medicaid Services) is the federal agency that rates nursing home quality. Its Overall Rating runs from 1 to 5 stars, combining health inspections, staffing, and quality measures, with inspections weighted most heavily.

Brookdale Santa Barbara

Nursing Home & Memory Care · Cape Coral, FL
CMS overall rating Info CMS (the Centers for Medicare & Medicaid Services) is the federal agency that rates nursing home quality. Its Overall Rating runs from 1 to 5 stars, combining health inspections, staffing, and quality measures, with inspections weighted most heavily.
Calculator: See prices in your area
Brookdale Santa Barbara accepts Medicare, Medicaid, and private pay.

Overview of Brookdale Santa Barbara

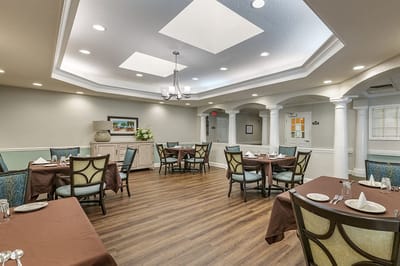
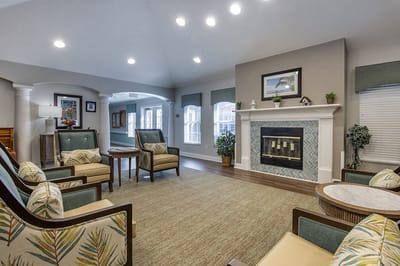
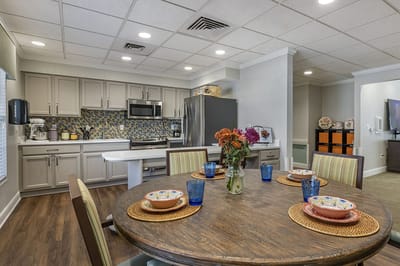
Brookdale Santa Barbara offers a safe and nurturing environment for seniors with Alzheimer’s and other forms of dementia. As a memory care pioneer for over 25 years, the community provides a comfortable, home-like setting where residents can engage in creative pursuits and enjoy social circles. The carefully designed building and highly trained staff focus on helping seniors live life well while supporting their current abilities and skills. Residents have access to a variety of dementia-friendly activities, including trivia games, fitness classes, and crafting workshops.

The community pairs residents with similar abilities to maintain a sense of belonging, and the enclosed courtyard allows for secure outdoor exploration. Dining is a priority, with healthy and delicious meals served daily in a supportive environment that encourages familiarity and socialization. Brookdale Santa Barbara is committed to providing compassionate and attentive care to meet each resident’s unique needs.

Quality ratings

Measured by Centers for Medicare & Medicaid Services (CMS)

Overall rating Info The Overall CMS Rating combines results from health inspections, staffing levels and quality measures. Health inspections carry the most weight. Staffing and quality scores can increase or decrease the final rating based on performance compared to state and national standards.
Health Inspection Info Based on the results of the facility's three most recent standard inspections and any complaint investigations. CMS reviews the number, scope, and severity of deficiencies, with more recent findings weighted more heavily.
Staffing Info Measures average nursing staff hours per resident per day, including Registered Nurses (RNs) and total nursing staff. Ratings are adjusted based on the level of care residents require and are compared to state and national benchmarks.
Quality Measures Info Based on clinical and physical health indicators reported to CMS, such as hospital readmissions, falls, pressure ulcers, and improvements in mobility. These measures reflect how well residents' health needs are being managed.

Staffing hours breakdown

Info Daily nursing hours per resident by staff type, reported to CMS. Higher is generally better — compare this facility to state and national averages to see where staffing stands.

Hours per resident per day — compared to state averages

Total nursing care / resident Info Total adjusted nursing hours per resident per day, combining RN, LPN, and aide time. CMS adjusts this for case-mix so facilities can be fairly compared.
3h 45m per day
Rank #175 / 253Nurse hours — State benchmarkedThis home is ranked 175th out of 253 homes in Florida. Shows adjusted nurse hours per resident per day benchmarked to the Florida average, with a ranking across 253 Florida facilities. More hours mean more direct care. The national average is about 3.5 hrs; below 3.0 is a red flag.Rankings are based only on facilities in Florida that report data for that category. Facilities without available data are excluded from the ranking.Click the rank badge to see the full State ranking.Click here to see the full State ranking.
vs avg
Staff typeHours / Day / Residentvs state avg
Registered Nurse (RN) Info RNs hold the highest nursing license and can assess residents, interpret test results, and direct care plans. More RN hours per day often signals stronger clinical oversight and faster response to health changes. 29m per day
LPN / LVN Info Licensed Practical Nurses (LPNs) or Licensed Vocational Nurses (LVNs) deliver routine hands-on care — medication administration, wound dressing, and monitoring vital signs. They work under RN supervision and make up a large share of daily bedside care. 47m per day
Nurse Aide Info Certified Nurse Aides (CNAs) provide the most direct day-to-day assistance: bathing, dressing, feeding, and mobility. Nurse aide hours are typically the largest staffing category and directly affect residents' quality of life. 2h 6m per day
Weekend Total Nursing Info Combined nursing hours (RN + LPN + Nurse Aide) per resident per day on weekends. Staffing often drops on weekends — this figure reveals whether the facility maintains adequate coverage outside of weekday hours. 3h 4m per day
Physical Therapist Info Hours per resident per day provided by licensed Physical Therapists (PTs) or PT Assistants. PT services help residents recover mobility after injury or illness and are especially important for post-acute (short-stay) rehabilitation. 0m per day
Weekend RN Info Registered nurse hours specifically on weekends. Facilities sometimes reduce RN presence on Saturdays and Sundays — a low weekend RN figure compared to weekday hours can indicate reduced clinical oversight when most administrative staff are absent. 21m per day

Capacity and availability

Avg. Length of Stay
64 days
Bed community size
40-bed community Rank #811 / 1074Bed count — State benchmarkedThis home is ranked 811th out of 1074 homes in Florida. Shows this facility's certified or reported bed count compared to other Florida facilities. Larger communities may offer more amenities, programs, and on-site services for residents and families.Rankings are based only on facilities in Florida that report data for that category. Facilities without available data are excluded from the ranking.Click the rank badge to see the full State ranking.Click here to see the full State ranking.
A moderately sized community that may balance personal attention with shared amenities and social activities.
Walk Score
Walk Score: 33 / 100 Rank #864 / 1486Walk Score — State benchmarkedThis home is ranked 864th out of 1486 homes in Florida. Shows how walkable this facility's neighborhood is compared to the average Walk Score across Florida facilities. Higher scores benefit residents, families, and staff.Rankings are based only on facilities in Florida that report data for that category. Facilities without available data are excluded from the ranking.Click the rank badge to see the full State ranking.Click here to see the full State ranking.
Somewhat walkable. A few nearby services may be reachable on foot, but most trips require transportation.
BBB Rating
BBB Rating: A- (Not Accredited)
An independent rating from the Better Business Bureau based on factors such as complaint history, transparency, and business practices.
How BBB ratings work

About this community

Occupancy

Occupancy rate
58%
Rank #245 / 258Occupancy rate — State benchmarkedThis home is ranked 245th out of 258 homes in Florida. Shows this facility's occupancy rate versus the Florida average, with its Statewide rank out of 258. Higher occupancy signals strong local demand and financial stability.Rankings are based only on facilities in Florida that report data for that category. Facilities without available data are excluded from the ranking.Click the rank badge to see the full State ranking.Click here to see the full State ranking.
Lower than the Florida average: 84.3%
Occupied beds
23 / 40
Average occupied beds in Florida homes 108 beds

License Details

Facility TypeAssisted Living Facility
StatusIn Review
IssuanceMay 15, 2024
ExpirationMay 14, 2026 Expired
CountyLee
License Number9767

Ownership & Operating Entity

Brookdale Santa Barbara is legally operated by Brookdale Senior Living Communities, Inc., and administered by Stephanie Viegas Sierra.

Profit StatusFor-profit

Type Of Units

Private
40 units
Total beds
40 units

Staffing

Key information about the people who lead and staff this community.

Languages Spoken

English Portuguese Spanish

Leadership

ContactNathan Freund, Manager

Staffing & Medical

1 service
Licensed Nurses/CNAs

Contact Brookdale Santa Barbara

Inspection History

In Florida, the Agency for Health Care Administration (AHCA) is the primary authority that conducts unannounced inspections and completes official health quality reports for all healthcare facilities.

Since 2013 · 13 years of data 37 citations 36 inspections 3 fines $3.0K fined
Inspection Score Info A composite 0–100 score combining this facility's inspections, citations, complaints, and enforcement actions relative to the Florida state average. The score below shows how many points this facility sits above or below the typical Florida assisted living residence score (the benchmark); higher is better.

3 points above the Florida average for assisted living residences (83/100)

Rank #428 / 876 in Florida Inspection Score — State benchmarked This home is ranked 428th out of 876 homes in Florida. Shows this facility's inspection score compared to the Florida average among 876 comparable communities in the ranking pool. Rankings are based only on facilities in Florida that report data for that category. Facilities without available data are excluded from the ranking. Inspection score: 86 out of 100. Letter grade B. 3 points above the Florida average for assisted living residences (83/100)

Inspection Scorecard Info This scorecard compares key inspection, citation, and complaint metrics at this facility against the Florida state average. Metrics rated ≥15% worse than average are highlighted in red; those ≥15% better are highlighted in green.

Since 2013 vs. Florida state average
Overall vs. FL average 4 Worse Metrics worse than Florida average:
• Total citations (12% above)
• Citations per year (12% above)
• Total inspections (38% above)
• Inspections with citations (13% above)
2 Better Metrics better than Florida average:
• Citations per inspection (23% below)
• Inspection citation rate (19% below)
Latest Inspection July 21, 2025 Complaint

Citations Info Citations are formal regulatory issues recorded during state inspections.

This FacilityFL Averagevs. FL Avg
Total citations Info Formal regulatory issues recorded by inspectors across all inspection types. 3733 This facility has 12% more total citations than a typical Florida assisted living residence (37 vs. FL avg 33).↑ 12% worse Rank #573 / 919 Total citations — State benchmarked This home is ranked 573rd out of 919 homes in Florida. Shows this facility's total citations compared to the Florida average among 919 comparable communities in the ranking pool. Rankings are based only on facilities in Florida that report data for that category. Facilities without available data are excluded from the ranking.
Citations per year Info Average citations per year since 2013. 2.82.5 This facility has 12% more citations per year than a typical Florida assisted living residence (2.8 vs. FL avg 2.5).↑ 12% worse
Citations per inspection Info Average citations per inspection. 11.3 This facility has 23% fewer citations per inspection than a typical Florida assisted living residence (1 vs. FL avg 1.3).↓ 23% better Rank #167 / 919 Citations per inspection — State benchmarked This home is ranked 167th out of 919 homes in Florida. Shows this facility's citations per inspection compared to the Florida average among 919 comparable communities in the ranking pool. Rankings are based only on facilities in Florida that report data for that category. Facilities without available data are excluded from the ranking.

Inspections Info State inspections evaluate whether the facility meets health and safety standards.

This FacilityFL Averagevs. FL Avg
Total inspections Info Combined count of all routine and focused inspections. Excludes complaint investigations. 3626 This facility has 38% more total inspections than a typical Florida assisted living residence (36 vs. FL avg 26).↑ 38% worse
Inspections with citations Info Inspections that resulted in at least one regulatory citation. 1816 This facility has 13% more inspections with citations than a typical Florida assisted living residence (18 vs. FL avg 16).↑ 13% worse
Inspection citation rate Info Percentage of inspections that resulted in at least one citation. 50%62% This facility has 12 percentage points lower inspection citation rate than a typical Florida assisted living residence (50% vs. FL avg 62%).↓ 12% better Rank #341 / 919 Inspection citation rate — State benchmarked This home is ranked 341st out of 919 homes in Florida. Shows this facility's % of inspections with citations compared to the Florida average among 919 comparable communities in the ranking pool. Rankings are based only on facilities in Florida that report data for that category. Facilities without available data are excluded from the ranking.

Inspection Reports Summary Info An editor-reviewed summary of the themes and findings across this facility's recent inspection reports.

  • July 21, 2025 complaint inspection found no deficiencies and no substantiated complaints.
  • September 25, 2024 monitor inspection cited one Class 3 deficiency for emergency management planning.
  • Past inspections showed repeated Class 3 and Class 4 deficiencies in resident care, admissions, training, and background screening.

Health Inspection History

Inspections since 2021
Total health inspections 7

State average N/A


Last Health inspection on Aug 2025

Total health citations
27 Rank #190 / 252Health citations — State benchmarkedThis home is ranked 190th out of 252 homes in Florida. Shows this facility's total health deficiency citations benchmarked to the Florida State average, with a ranking across all 252 FL facilities. Lower citation counts earn a better rank.Rankings are based only on facilities in Florida that report data for that category. Facilities without available data are excluded from the ranking.Click the rank badge to see the full State ranking.Click here to see the full State ranking.

State average N/A

Citations per inspection
3.86 Rank #110 / 252Citations per inspection — State benchmarkedThis home is ranked 110th out of 252 homes in Florida. Shows average deficiency citations per CMS inspection for this facility versus the Florida mean across 252 facilities with citation data. Lower is better.Rankings are based only on facilities in Florida that report data for that category. Facilities without available data are excluded from the ranking.Click the rank badge to see the full State ranking.Click here to see the full State ranking.

State average N/A


Health citations are formal notices following inspections when they fail to comply with safety and care standards.

17 of 27 citations resulted from standard inspections; and 10 of 27 resulted from complaint investigations.

Breakdown of citation severity (last 5 years)
Critical health citations
9
In line with State average

State average: N/A


Serious health citations
0
In line with State average

State average: N/A

9 critical citations State average: N/A

0 serious citations State average: N/A

18 moderate citations State average: N/A

0 minor citations State average: N/A
Citations history (last 5 years)
Administration critical citation Aug 29, 2025
Corrected

Administration moderate citation Aug 29, 2025
Corrected

Environmental critical citation Aug 29, 2025
Corrected

Infection Control moderate citation Aug 29, 2025
Corrected

Staffing Data

Reporting period: October 1 – December 31, 2025 (Q4 2025). Source: CMS Payroll-Based Journal report.

Total staff 99
Employees 98
Contractors 1
Staff to resident ratio 0.98 : 1
0% compared with State average

State average ratio: 0 : 0

Avg staff/day 49
Average shift 8.4 hours
0% compared with State average

State average: 0 hours

Total staff hours (quarter) 37,745

Nursing staff breakdown

Q4 2025 · Oct 1 – Dec 31 More info This data comes from the CMS Payroll-Based Journal report covering October 1 – December 31, 2025.
Registered Nurse

Manages medical care and health needs.

RN Staff Info All 14 RN Staff are full-time employees. No contractors work on this role. 14
Average shift length Info Average shift length. Calculated as total hours divided by days worked and average staff per day. 7.9 hours
Licensed Practical Nurse

Assists with medical care and medications.

LPN Staff Info All 18 LPN Staff are full-time employees. No contractors work on this role. 18
Average shift length Info Average shift length. Calculated as total hours divided by days worked and average staff per day. 9.6 hours
Certified Nursing Assistant

Helps with daily care and mobility.

CNA Staff Info All 50 CNA Staff are full-time employees. No contractors work on this role. 50
Average shift length Info Average shift length. Calculated as total hours divided by days worked and average staff per day. 8.1 hours

Contractor staffing

Q4 2025 · Oct 1 – Dec 31 More info This data comes from the CMS Payroll-Based Journal report covering October 1 – December 31, 2025.

Total hours from contractors

0.1%

28 contractor hours this quarter

Medical Director: 1

Staff by category

Q4 2025 · Oct 1 – Dec 31 More info This data comes from the CMS Payroll-Based Journal report covering October 1 – December 31, 2025.
Certified Nursing Assistant5005021,20492100%8.1
Licensed Practical Nurse180186,65692100%9.6
Registered Nurse140143,83092100%7.9
Other Dietary Services Staff4041,60292100%9.4
Mental Health Service Worker3031,2777076%8.3
RN Director of Nursing3031,2387177%8
Clinical Nurse Specialist2028646672%8
Administrator2025366672%8
Nurse Practitioner1012563235%8
Dietitian1012563235%8
Medical Director011281415%2
50 Certified Nursing Assistant
% of Days 100%
18 Licensed Practical Nurse
% of Days 100%
14 Registered Nurse
% of Days 100%
4 Other Dietary Services Staff
% of Days 100%
3 Mental Health Service Worker
% of Days 76%
3 RN Director of Nursing
% of Days 77%
2 Clinical Nurse Specialist
% of Days 72%
2 Administrator
% of Days 72%
1 Nurse Practitioner
% of Days 35%
1 Dietitian
% of Days 35%
1 Medical Director
% of Days 15%

Penalties and fines

Includes penalties issued in 2024-2025

Federal penalties imposed by CMS for regulatory violations, including civil money penalties (fines) and denials of payment for new Medicare/Medicaid admissions.

Source: CMS Penalties Database (Data as of Jan 2026)

Total fines amount $498K Rank #240 / 258Federal fines — State benchmarkedThis home is ranked 240th out of 258 homes in Florida. Shows this facility's cumulative CMS federal fine dollars versus the Florida average among facilities with fines, and where it ranks among 258 facilities in the pool. Lower total dollars mean a better rank.Rankings are based only on facilities in Florida that report data for that category. Facilities without available data are excluded from the ranking.Click the rank badge to see the full State ranking.Click here to see the full State ranking.
591% higher than State average

State average: $72K

Number of fines 12
355% more fines than State average

State average: 2.6

Payment Denials Info Serious action where Medicare and/or Medicaid temporarily stops payments for new residents until issues are fixed. 0
100% fewer payment denials than State average

State average: 0.1

Fines amount comparison
This facility $498K
State average $72K
Penalty History

Penalties are imposed by CMS for violations of federal nursing home regulations.

5 penalties in the past 3 years

Multiple penalties were reported in the last 3 years.

Civil Money Penalty Info Fines imposed for noncompliance, which can be assessed per day or per instance of violation. Feb 27, 2025
$4K
Civil Money Penalty Info Fines imposed for noncompliance, which can be assessed per day or per instance of violation. Feb 27, 2025
$4K
Civil Money Penalty Info Fines imposed for noncompliance, which can be assessed per day or per instance of violation. Feb 27, 2025
$4K
Civil Money Penalty Info Fines imposed for noncompliance, which can be assessed per day or per instance of violation. Feb 27, 2025
$4K

Last updated: Jan 2026

Quality of care over time

These measures show how residents usually do over time at this home, based on health outcomes and preventive care.

High-risk clinical events score Info A composite score based on pressure ulcers, falls with injury, weight loss, walking ability decline, and activities of daily living decline. 5.0
33% better than State average

State average: 7.4

Functional decline score Info A composite score based on activities of daily living decline, walking ability decline, and incontinence. 10.4
16% better than State average

State average: 12.4

Long-stay resident measures
Need for Help with Daily Activities Increased Info Percent of long-stay residents whose need for help with daily activities has increased 4.8%
55% better than State average

State average: 10.5%

Walking Ability Worsened Info Percent of long-stay residents whose ability to move independently worsened 12.6%
In line with State average

State average: 12.9%

Low Risk Residents with Bowel/Bladder Incontinence Info Percent of low risk long-stay residents who lose control of their bowels or bladder 13.9%
In line with State average

State average: 13.5%

Falls with Major Injury Info Percent of long-stay residents experiencing one or more falls with major injury 1.8%
33% better than State average

State average: 2.6%

High Risk Residents with Pressure Ulcers Info Percent of long-stay high risk residents with pressure ulcers 1.9%
65% better than State average

State average: 5.4%

Urinary Tract Infection Info Percent of long-stay residents with a urinary tract infection 0.6%
30% better than State average

State average: 0.9%

Lost Too Much Weight Info Percent of long-stay residents who lose too much weight 3.9%
35% better than State average

State average: 6.0%

Depressive Symptoms Info Percent of long-stay residents who have depressive symptoms 0.3%
90% better than State average

State average: 3.3%

Antipsychotic Use Info Percent of long-stay residents who received an antipsychotic medication 3.1%
61% better than State average

State average: 8.0%

Pneumococcal Vaccine Info Percent of long-stay residents assessed and appropriately given the pneumococcal vaccine 99.4%
In line with State average

State average: 97.7%

Influenza Vaccine Info Percent of long-stay residents assessed and appropriately given the seasonal influenza vaccine 100.0%
In line with State average

State average: 99.2%

Short-stay resident measures
Pneumococcal Vaccine Info Percent of short-stay residents assessed and appropriately given the pneumococcal vaccine 95.9%
In line with State average

State average: 94.0%

Antipsychotic medication increase Info Percent of short-stay residents who newly received an antipsychotic medication 0.7%
56% better than State average

State average: 1.5%

Influenza Vaccine Info Percent of short-stay residents assessed and appropriately given the seasonal influenza vaccine 99.5%
5% better than State average

State average: 94.7%

Breakdown by payment type

Medicare

24% of new residents, usually for short-term rehab.

Typical stay 21 days

Private pay

60% of new residents, often for short stays.

Typical stay 1 - 2 months

Medicaid

17% of new residents, often for long-term daily care.

Typical stay 1 - 2 years

Facility Characteristics

Source: CMS Long-Term Care Facility Characteristics (Data as of Jan 2026)

Total residents 101
Medicare
8
7.9% of residents
Medicaid
69
68.3% of residents
Private pay or other
24
23.8% of residents
Programs & Services
Residents Group

Residents meet regularly to discuss policies, care quality, and activities

Active Resident Council

Organized group of residents that meets regularly to discuss facility policies, quality of life, and activities.

Finances and operations

Based on CMS SNF Cost Report for fiscal year ending in 11/2023.

For-profit
Operated by a single business entity.
Net patient revenue Info Net patient revenue — what the home actually collects for resident care, after contractual allowances, bad debt and discounts are subtracted from its gross charges (CMS cost report, Worksheet G-3). It covers resident care only; money the home earns from other sources is shown separately as "Other income."
$2.2M
Net patient income Info Net patient income: net patient revenue minus the home's total operating expenses. A positive figure means it earns more from resident care than it spends to deliver it; a negative figure means the opposite. It excludes non-operating "other income."
-$2.0M
For-profit Operated by a single business entity.
Net patient revenue Info Net patient revenue — what the home actually collects for resident care, after contractual allowances, bad debt and discounts are subtracted from its gross charges (CMS cost report, Worksheet G-3). It covers resident care only; money the home earns from other sources is shown separately as "Other income."
$2.2M Rank #184 / 257Revenue — State benchmarkedThis home is ranked 184th out of 257 homes in Florida. Shows this facility's annual revenue compared to the Florida average. Higher revenue generally means more resources for staffing and capital — read alongside Payroll %.Rankings are based only on facilities in Florida that report data for that category. Facilities without available data are excluded from the ranking.Click the rank badge to see the full State ranking.Click here to see the full State ranking.
Net patient income Info Net patient income: net patient revenue minus the home's total operating expenses. A positive figure means it earns more from resident care than it spends to deliver it; a negative figure means the opposite. It excludes non-operating "other income."
-$2.0M
Other income Info Money the home earns outside of resident care — such as investments, grants, rentals and other non-operating sources (CMS cost report, Worksheet G-3). It is tracked separately from net patient revenue: it is not part of that figure, and it is not included in net patient income.
$17.2K
Payroll costs Info Staff salaries plus wage-related costs — benefits such as payroll taxes, health insurance and retirement — from the home's own accounting records (CMS cost report, Worksheet A). Contract or agency labor is counted separately, under other operating costs. Rank #236 / 257Payroll — State benchmarkedThis home is ranked 236th out of 257 homes in Florida. Shows total annual staff payroll benchmarked to the Florida average. Higher payroll investment relative to peers often signals better staffing and less reliance on cheaper contract labor.Rankings are based only on facilities in Florida that report data for that category. Facilities without available data are excluded from the ranking.Click the rank badge to see the full State ranking.Click here to see the full State ranking.
$1.3M 58.9% of net patient revenue Info Payroll as a share of revenue: staff salaries and wage-related benefits divided by net patient revenue. A higher figure means more of each revenue dollar goes to staff pay. Rank #253 / 257Payroll % — State benchmarkedThis home is ranked 253rd out of 257 homes in Florida. Shows payroll as a percentage of revenue versus the Florida average. Well-run Florida facilities typically land around 49–56% — the top third Statewide. Below 25% may signal understaffing or heavy agency use — read with Staffing ratings.Rankings are based only on facilities in Florida that report data for that category. Facilities without available data are excluded from the ranking.Click the rank badge to see the full State ranking.Click here to see the full State ranking.
Other operating costs Info Everything it costs to run the home apart from payroll — food, utilities, supplies, maintenance, contract labor and administration. Calculated as total operating expense minus payroll (staff salaries and wage-related benefits).
$2.9M
Total costs Info The home's total operating expense for the year — all the costs of running it, salaries included (CMS cost report, Worksheet G-3).
$4.3M

What does this home offer?

Housing options icon

Housing Options: Studio / Suite

Building type icon
Building type icon

Building Type: Single-story

Fitness and recreation icon

Fitness and Recreation

Who this home usually serves

TYPE OF STAY

Primarily short stays

Residents typically stay for brief periods, with frequent admissions and discharges throughout the year.

Most new residents arrive under private pay (60% of admissions), and a typical private pay stay runs around 1 - 2 months.

Admissions
72 total

Coverage residents most often arrive under.

Medicare 24%
Private pay 60%
Medicaid 17%
Discharges
136 total

Coverage residents most often leave under.

Medicare 8%
Private pay 35%
Medicaid 57%

Activities in this home

Places of interest near Brookdale Santa Barbara

Address 0.9 miles from city center Info Estimated distance in miles from Cape Coral's city center to Brookdale Santa Barbara's address, calculated via Google Maps. — 1.95 miles to nearest hospital (Cape Coral Hospital)

Calculate Travel Distance to Brookdale Santa Barbara

Add your location

Address

Compare Nursing Homes around the area

The information below is reported by the Florida Agency for Health Care Administration (AHCA).

Brookdale Santa Barbara
NH
MC
Cape Coral (Hancock) -40 A- 33 Studio / Suite
Westminster Woods on Julington Creek
NH
AL
IL
MC
Fruit Cove (Saint Johns) -80 C- 47 -

Frequently Asked Questions about Brookdale Santa Barbara

What neighborhood is Brookdale Santa Barbara in?

Brookdale Santa Barbara is in the Hancock neighborhood of Cape Coral.

What languages are spoken at Brookdale Santa Barbara?

The team at Brookdale Santa Barbara speaks English, Portuguese, and Spanish.

Who is the owner of Brookdale Santa Barbara?

Brookdale Santa Barbara is legally operated by Brookdale Senior Living Communities, Inc., and administered by Stephanie Viegas Sierra.

Is Brookdale Santa Barbara in a walkable area?

Brookdale Santa Barbara has a walk score of 33. Somewhat walkable. A few nearby services may be reachable on foot, but most trips require transportation.

What is the license number of Brookdale Santa Barbara?

According to FL state health department records, Brookdale Santa Barbara's license number is 9767.

When does Brookdale Santa Barbara's license expire?

According to FL state health department records, Brookdale Santa Barbara's license expires on May 14, 2026.

What is the occupancy rate at Brookdale Santa Barbara?

Brookdale Santa Barbara's occupancy is 58%.

Guides for Better Senior Living

Care Cost Calculator: See Prices in Your Area

Nursing Home Data Explorer

Don’t Wait Too Long: 7 Red Flag Signs Your Parent Needs Assisted Living Now

The True Cost of Assisted Living in 2025 – And How Families Are Paying For It

Understanding Senior Living Costs: Pricing Models, Discounts & Financial Assistance