Brookside Rehabilitation Center
Nursing Home · Lincoln, NE
CMS overall rating Info The Overall CMS Rating is scored from 1 to 5 stars and combines results from health inspections, staffing levels, and quality measures. Health inspections carry the most weight. Staffing and quality scores can increase or decrease the final rating based on performance compared to state and national standards.

Brookside Rehabilitation Center

Nursing Home · Lincoln, NE
CMS overall rating Info The Overall CMS Rating is scored from 1 to 5 stars and combines results from health inspections, staffing levels, and quality measures. Health inspections carry the most weight. Staffing and quality scores can increase or decrease the final rating based on performance compared to state and national standards.
Calculator: See prices in your area
Brookside Rehabilitation Center accepts Medicare, Medicaid, and private pay.

Overview of Brookside Rehabilitation Center

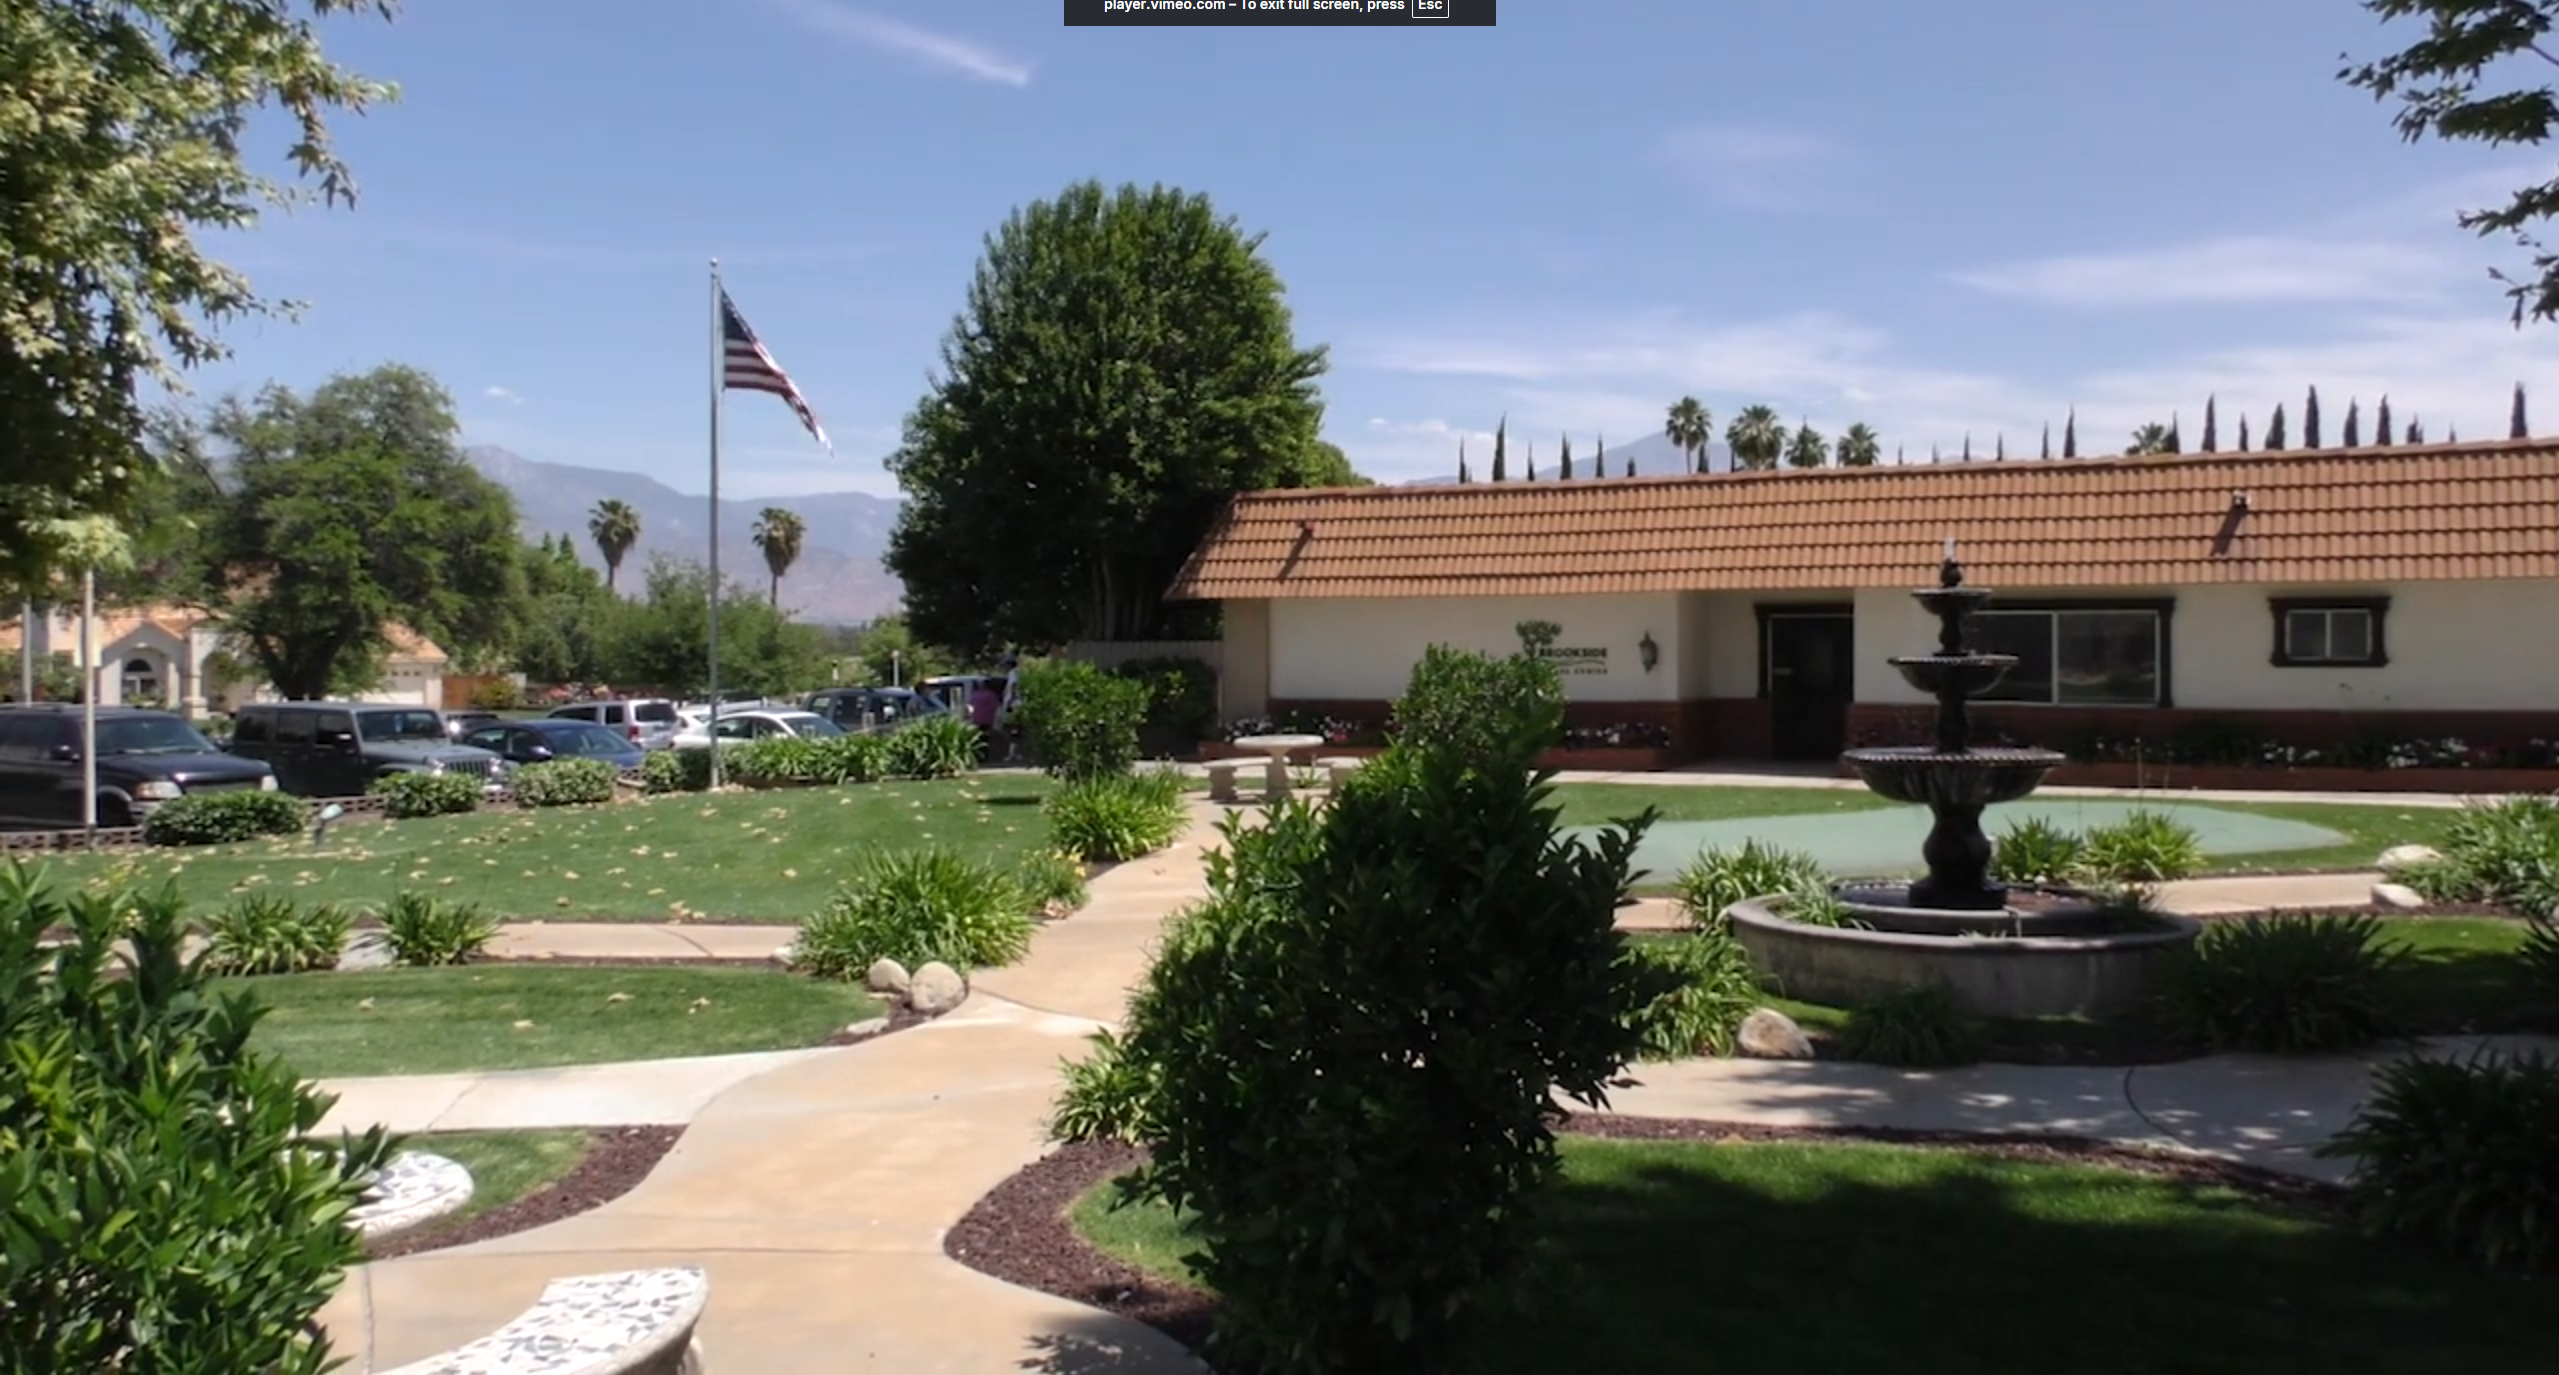
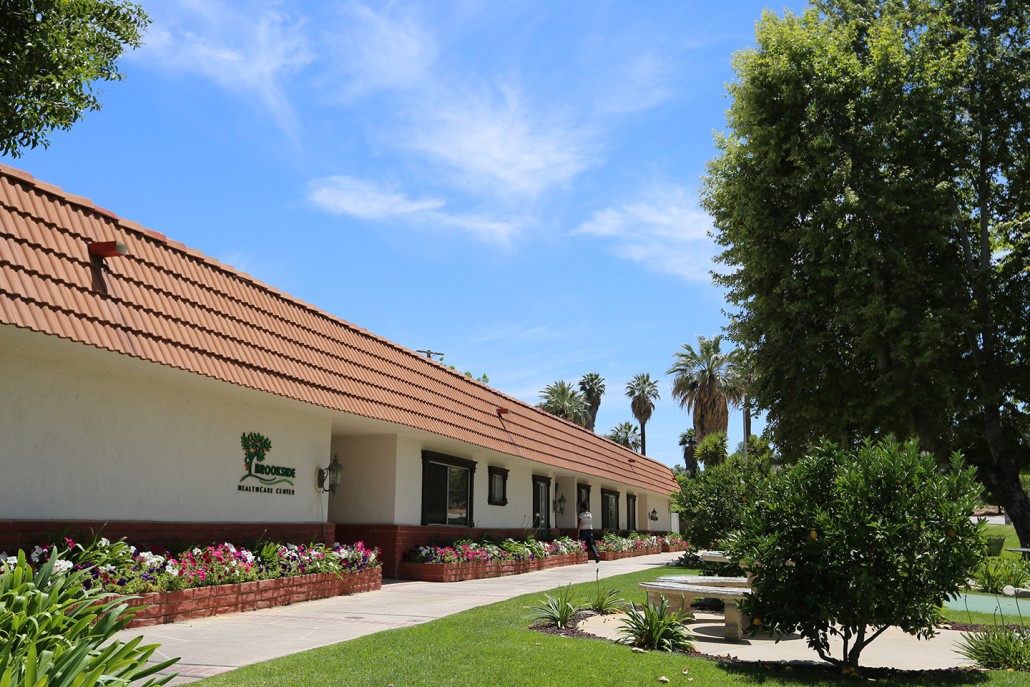
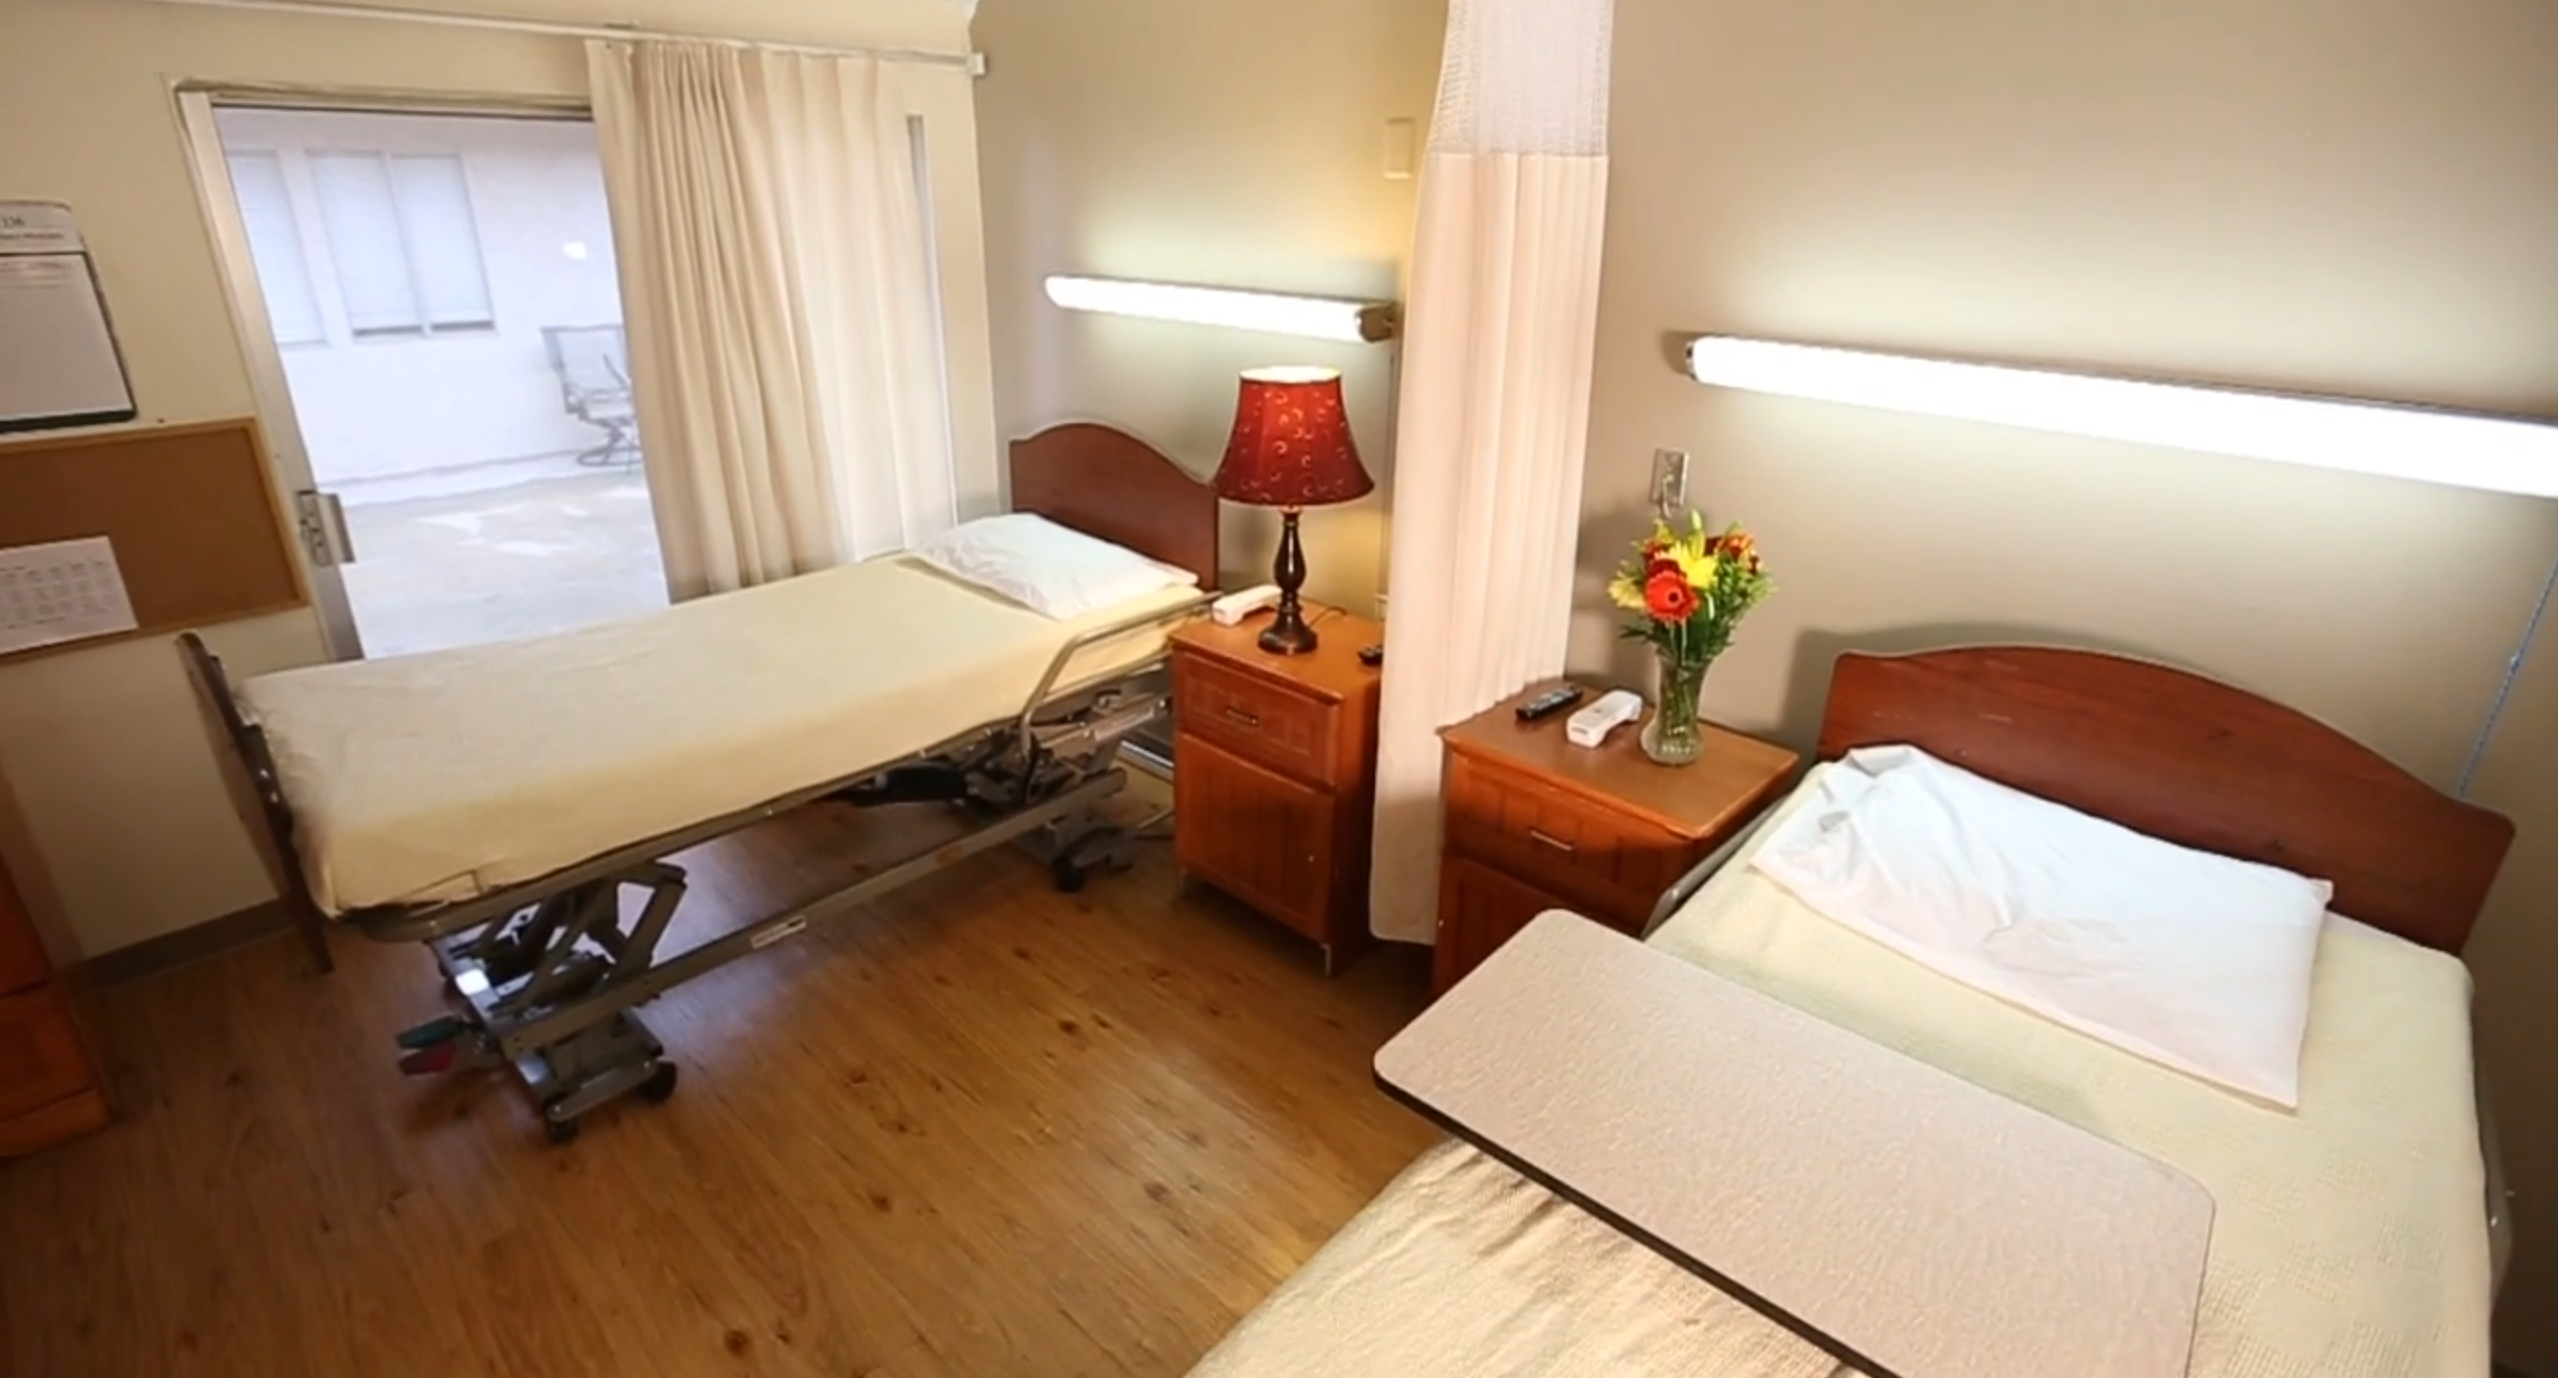
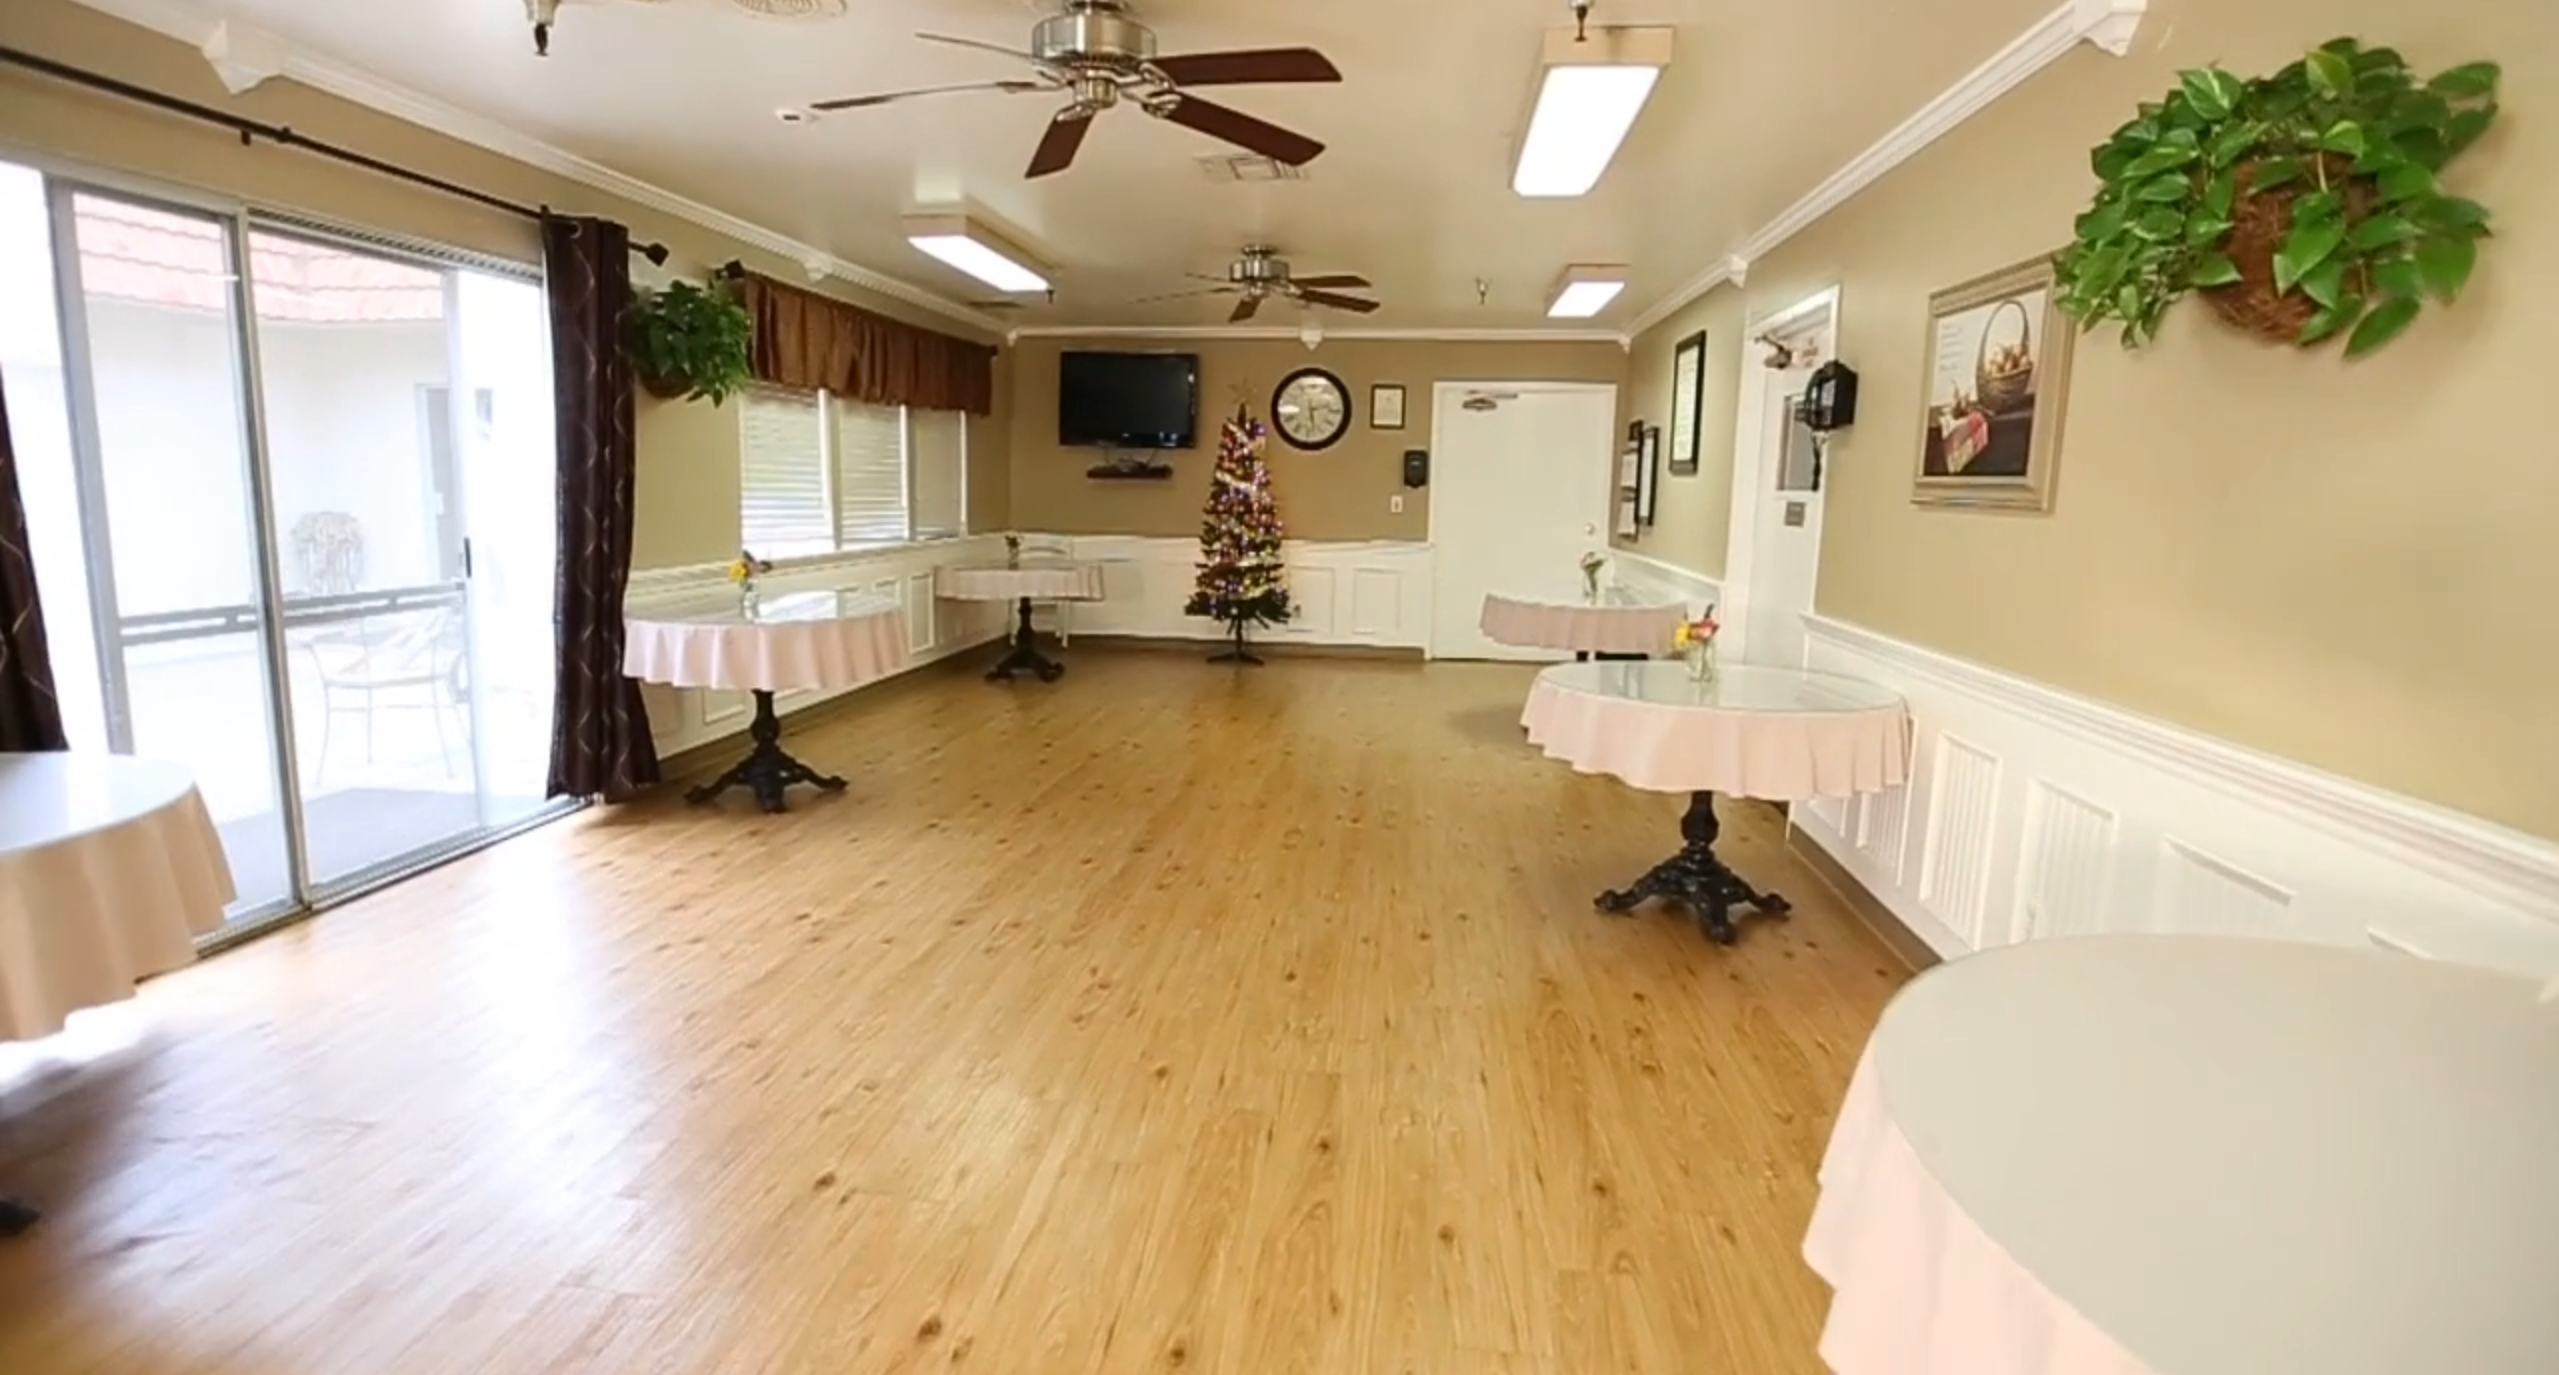
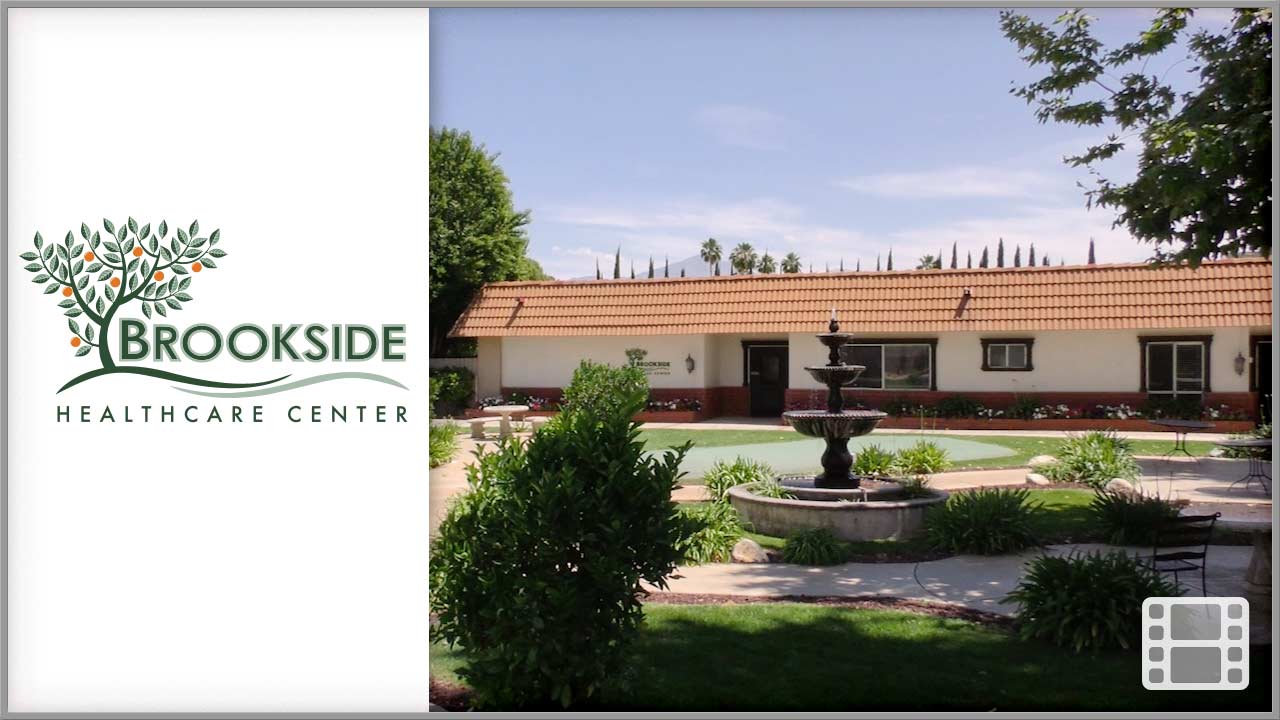
Brookside Rehabilitation Center is a small nursing home in Lincoln that specializes in memory care, short-term rehabilitation, long-term care, and skilled nursing. They offer a range of services that focus on the comfort and convenience of their residents: meal services, housekeeping, laundry, transportation, a library, a beauty salon, and outdoor spaces.

Quality ratings

Measured by Centers for Medicare & Medicaid Services (CMS)

Overall rating Info The Overall CMS Rating combines results from health inspections, staffing levels and quality measures. Health inspections carry the most weight. Staffing and quality scores can increase or decrease the final rating based on performance compared to state and national standards.
▼ 16.7% Below NE avg. ▼ 16.7% Below NE avg.Click the badge to see the full State ranking.Click here to see the full State ranking.
Health Inspection Info Based on the results of the facility's three most recent standard inspections and any complaint investigations. CMS reviews the number, scope, and severity of deficiencies, with more recent findings weighted more heavily.
▼ 4.8% Below NE avg. ▼ 4.8% Below NE avg.Click the badge to see the full State ranking.Click here to see the full State ranking.
Staffing Info Measures average nursing staff hours per resident per day, including Registered Nurses (RNs) and total nursing staff. Ratings are adjusted based on the level of care residents require and are compared to state and national benchmarks.
▲ 15.9% Above NE avg. ▲ 15.9% Above NE avg.Click the badge to see the full State ranking.Click here to see the full State ranking.
Quality Measures Info Based on clinical and physical health indicators reported to CMS, such as hospital readmissions, falls, pressure ulcers, and improvements in mobility. These measures reflect how well residents' health needs are being managed.
▼ 6.1% Below NE avg. ▼ 6.1% Below NE avg.Click the badge to see the full State ranking.Click here to see the full State ranking.

Staffing hours breakdown

Info Daily nursing hours per resident by staff type, reported to CMS. Higher is generally better — compare this facility to state and national averages to see where staffing stands.

Hours per resident per day — compared to Nebraska state averages

Total nursing care / resident Info This home is ranked 122nd out of 346 homes in Nebraska. Total adjusted nursing hours per resident per day, combining RN, LPN, and aide time. CMS adjusts this for case-mix so facilities can be fairly compared.
4h 16m per day
Rank #122 / 346Nurse hours — State benchmarkedThis home is ranked 122nd out of 346 homes in California. Shows adjusted nurse hours per resident per day benchmarked to the California average, with a ranking across 346 California SNFs. More hours mean more direct care. The national average is about 3.5 hrs; below 3.0 is a red flag.Click the rank badge to see the full State ranking.Click here to see the full State ranking.
This facility Nebraska avg (4h 23m per day)
vs Nebraska avg
-2%

4 of 6 metrics below state avg

Standout metric Physical Therapist is +60% above state avg
Staff typeHours / Day / Residentvs state avg
Registered Nurse (RN) Info RNs hold the highest nursing license and can assess residents, interpret test results, and direct care plans. More RN hours per day often signals stronger clinical oversight and faster response to health changes. 30m per day ▼ 23% State avg: 39m per day · National avg: 41m per day
LPN / LVN Info Licensed Practical Nurses (LPNs) or Licensed Vocational Nurses (LVNs) deliver routine hands-on care — medication administration, wound dressing, and monitoring vital signs. They work under RN supervision and make up a large share of daily bedside care. 1h 35m per day ▲ 30% State avg: 1h 13m per day · National avg: 52m per day
Nurse Aide Info Certified Nurse Aides (CNAs) provide the most direct day-to-day assistance: bathing, dressing, feeding, and mobility. Nurse aide hours are typically the largest staffing category and directly affect residents' quality of life. 2h 33m per day ▼ 4% State avg: 2h 39m per day · National avg: 2h 21m per day
Weekend Total Nursing Info Combined nursing hours (RN + LPN + Nurse Aide) per resident per day on weekends. Staffing often drops on weekends — this figure reveals whether the facility maintains adequate coverage outside of weekday hours. 3h 50m per day ▼ 6% State avg: 4h 5m per day · National avg: 3h 26m per day
Physical Therapist Info Hours per resident per day provided by licensed Physical Therapists (PTs) or PT Assistants. PT services help residents recover mobility after injury or illness and are especially important for post-acute (short-stay) rehabilitation. 8m per day ▲ 60% State avg: 5m per day · National avg: 4m per day
Weekend RN Info Registered nurse hours specifically on weekends. Facilities sometimes reduce RN presence on Saturdays and Sundays — a low weekend RN figure compared to weekday hours can indicate reduced clinical oversight when most administrative staff are absent. 21m per day ▼ 30% State avg: 30m per day · National avg: 29m per day

Capacity and availability

This home usually has limited availability

Occupancy between 85% and 95% suggests balanced demand.

Higher occupancy than the Nebraska average: 70.3%
Occupancy rate 89.3% Rank #332 / 1407Occupancy rate — State benchmarkedThis home is ranked 332nd out of 1407 homes in California. Shows this facility's occupancy rate versus the California average, with its Statewide rank out of 1407. Higher occupancy signals strong local demand and financial stability.Click the rank badge to see the full State ranking.Click here to see the full State ranking.
Avg. Length of Stay 48 days
Occupancy rate
89.3% Rank #332 / 1407Occupancy rate — State benchmarkedThis home is ranked 332nd out of 1407 homes in California. Shows this facility's occupancy rate versus the California average, with its Statewide rank out of 1407. Higher occupancy signals strong local demand and financial stability.Click the rank badge to see the full State ranking.Click here to see the full State ranking.
Avg. Length of Stay
48 days
Walk Score
Walk Score: 0 / 100 Rank #2074 / 2096Walk Score — State benchmarkedThis home is ranked 2074th out of 2096 homes in California. Shows how walkable this facility's neighborhood is compared to the average Walk Score across California SNFs. Higher scores benefit residents, families, and staff.Click the rank badge to see the full State ranking.Click here to see the full State ranking.
Car-dependent. Most errands require a car, with limited nearby walkable options.
BBB Rating
BBB Rating: A+ (Not Accredited)
An independent rating from the Better Business Bureau based on factors such as complaint history, transparency, and business practices.
How BBB ratings work

About this community

License Details

AccreditationsQuality Assurance & Performance Improvement (QAPI) certified by the Centers for Medicare and Medicaid Services (CMS)

Therapy & Rehabilitation

1 service
Rehabilitation Services

Amenities & Lifestyle

Fitness & Stimulating Brain Games
Wi-Fi Throughout The Property
Dish Tv And Phones In Every Room
Rec Room With Games
Library With A Robust Assortment Of Books And Videos
Spacious Dining Area With Fresh
Rotating Menus
Popular Courtyard B-B-Qs
Barber/Beauty Salon Services
Holiday And Birthday Celebrations
Specific ProgramsPost-Acute Rehabilitation, Clinical Services

Dining & Nutrition

Food DescriptionSpacious dining area with fresh, rotating menus.

Contact Brookside Rehabilitation Center

Inspection History

In Nebraska, the Department of Social Services (for assisted living facilities) and the Department of Public Health (for nursing homes) conduct inspections to ensure resident safety and regulatory compliance.

Read the full inspection reports for this facility, including detailed findings and corrective actions.

Show Inspection Reports

Health Inspection History

Inspections since 2019
Total health inspections 10

Nebraska average 4.3


Last Health inspection on Oct 2024

Total health citations
35 Rank #141 / 354Health citations — State benchmarkedThis home is ranked 141st out of 354 homes in California. Shows this facility's total health deficiency citations benchmarked to the California State average, with a ranking across all 354 CA SNFs. Lower citation counts earn a better rank.Click the rank badge to see the full State ranking.Click here to see the full State ranking.

Nebraska average 18.2

Citations per inspection
3.5 Rank #110 / 354Citations per inspection — State benchmarkedThis home is ranked 110th out of 354 homes in California. Shows average deficiency citations per CMS inspection for this facility versus the California mean across 354 SNFs with citation data. Lower is better.Click the rank badge to see the full State ranking.Click here to see the full State ranking.

Nebraska average 4.19


Health citations are formal notices following inspections when they fail to comply with safety and care standards.

27 of 35 citations resulted from standard inspections; and 8 of 35 resulted from complaint investigations.

Breakdown of citation severity (last 7 years)
Critical Health citations
0
100% better than Nebraska average

Nebraska average: 0.2


Serious Health citations
0
100% better than Nebraska average

Nebraska average: 0.5

0 critical citations Nebraska average: 0.2

0 serious citations Nebraska average: 0.5

35 moderate citations Nebraska average: 17.2

0 minor citations Nebraska average: 0.2
Citations history (last 7 years)
Administration moderate citation Oct 25, 2024
Corrected

Infection Control moderate citation Oct 25, 2024
Corrected

Nursing Services moderate citation Oct 25, 2024
Corrected

Nutrition moderate citation Oct 25, 2024
Corrected

Staffing Data

Reporting period: October 1 – December 31, 2025 (Q4 2025). Source: CMS Payroll-Based Journal report.

Total staff 146
Employees 146
Contractors 0
Staff to resident ratio 1.74:1
14% worse than Nebraska average
Nebraska average ratio: 2.03:1 Nebraska average ratio: 2.03:1See full Nebraska ranking
Avg staff/day 66
Average shift 7.1 hours
9% worse than Nebraska average
Nebraska average: 7.8 hours Nebraska average shift: 7.8 hoursSee full Nebraska ranking
Total staff hours (quarter) 42,954

Nursing staff breakdown

Q4 2025 · Oct 1 – Dec 31 More info This data comes from the CMS Payroll-Based Journal report covering October 1 – December 31, 2025.
Registered Nurse

Manages medical care and health needs.

RN Staff 12
Average shift length Info Average shift length. Calculated as total hours divided by days worked and average staff per day. 7.3 hours

No contractors work on this role.

Licensed Practical Nurse

Assists with medical care and medications.

LPN Staff 34
Average shift length Info Average shift length. Calculated as total hours divided by days worked and average staff per day. 7.4 hours

No contractors work on this role.

Certified Nursing Assistant

Helps with daily care and mobility.

CNA Staff 59
Average shift length Info Average shift length. Calculated as total hours divided by days worked and average staff per day. 6.9 hours

No contractors work on this role.

Contractor staffing

Q4 2025 · Oct 1 – Dec 31 More info This data comes from the CMS Payroll-Based Journal report covering October 1 – December 31, 2025.

Total hours from contractors

0%

0 contractor hours this quarter

No contractor roles were reported this quarter.

Staff by category

Q4 2025 · Oct 1 – Dec 31 More info This data comes from the CMS Payroll-Based Journal report covering October 1 – December 31, 2025.
Certified Nursing Assistant5905917,90892100%6.9
Licensed Practical Nurse3403410,89592100%7.4
Registered Nurse120122,47692100%7.3
Dental Services Staff5052,4276975%7.7
Physical Therapy Aide6061,8057278%7.5
Speech Language Pathologist9091,6389098%6.3
Respiratory Therapy Technician5051,2407784%6.4
Physical Therapy Assistant4041,1568795%6.4
Other Dietary Services Staff2026958896%7.9
Nurse Practitioner1015766470%9
Clinical Nurse Specialist1015676368%9
RN Director of Nursing1015406065%9
Dietitian1014836470%7.6
Therapeutic Recreation Specialist2024796470%3.7
Qualified Social Worker303561415%4
Administrator1011367%2.2
59 Certified Nursing Assistant
% of Days 100%
34 Licensed Practical Nurse
% of Days 100%
12 Registered Nurse
% of Days 100%
5 Dental Services Staff
% of Days 75%
6 Physical Therapy Aide
% of Days 78%
9 Speech Language Pathologist
% of Days 98%
5 Respiratory Therapy Technician
% of Days 84%
4 Physical Therapy Assistant
% of Days 95%
2 Other Dietary Services Staff
% of Days 96%
1 Nurse Practitioner
% of Days 70%
1 Clinical Nurse Specialist
% of Days 68%
1 RN Director of Nursing
% of Days 65%
1 Dietitian
% of Days 70%
2 Therapeutic Recreation Specialist
% of Days 70%
3 Qualified Social Worker
% of Days 15%
1 Administrator
% of Days 7%

Penalties and fines

Federal penalties imposed by CMS for regulatory violations, including civil money penalties (fines) and denials of payment for new Medicare/Medicaid admissions.

Source: CMS Penalties Database

No penalties in the past 3 years

No civil money penalties or payment denials were reported in the last 3 years.

Quality of care over time

These measures show how residents usually do over time at this home, based on health outcomes and preventive care.

High-risk clinical events score Info A composite score based on pressure ulcers, falls with injury, weight loss, walking ability decline, and activities of daily living decline. 6.9
In line with Nebraska average

Nebraska average: 6.6

Functional decline score Info A composite score based on activities of daily living decline, walking ability decline, and incontinence. 16.4
45% worse than Nebraska average

Nebraska average: 11.3

Long-stay resident measures
Significantly above average Nebraska avg: 4.2 Info CMS star rating based on long-stay quality measure performance. 5 stars = significantly above average, 1 star = significantly below average.
Need for Help with Daily Activities Increased Info Percent of long-stay residents whose need for help with daily activities has increased 8.5%
23% better than Nebraska average

Nebraska average: 11.1%

Walking Ability Worsened Info Percent of long-stay residents whose ability to move independently worsened 18.3%
53% worse than Nebraska average

Nebraska average: 12.0%

Low Risk Residents with Bowel/Bladder Incontinence Info Percent of low risk long-stay residents who lose control of their bowels or bladder 22.4%
98% worse than Nebraska average

Nebraska average: 11.3%

Falls with Major Injury Info Percent of long-stay residents experiencing one or more falls with major injury 0.0%
100% better than Nebraska average

Nebraska average: 1.7%

High Risk Residents with Pressure Ulcers Info Percent of long-stay high risk residents with pressure ulcers 5.7%
16% worse than Nebraska average

Nebraska average: 5.0%

Urinary Tract Infection Info Percent of long-stay residents with a urinary tract infection 0.0%
100% better than Nebraska average

Nebraska average: 1.2%

Lost Too Much Weight Info Percent of long-stay residents who lose too much weight 2.1%
51% better than Nebraska average

Nebraska average: 4.2%

Depressive Symptoms Info Percent of long-stay residents who have depressive symptoms 16.5%
147% worse than Nebraska average

Nebraska average: 6.7%

Antipsychotic Use Info Percent of long-stay residents who received an antipsychotic medication 1.5%
85% better than Nebraska average

Nebraska average: 10.1%

Pneumococcal Vaccine Info Percent of long-stay residents assessed and appropriately given the pneumococcal vaccine 100.0%
In line with Nebraska average

Nebraska average: 98.5%

Influenza Vaccine Info Percent of long-stay residents assessed and appropriately given the seasonal influenza vaccine 100.0%
In line with Nebraska average

Nebraska average: 98.2%

Hospitalizations per 1,000 days Info Number of hospitalizations per 1,000 long-stay resident days. 1.37
39% better than Nebraska average

Nebraska average: 2.25

ED visits per 1,000 days Info Number of outpatient emergency department visits per 1,000 long-stay resident days. 1.52
In line with Nebraska average

Nebraska average: 1.59

Short-stay resident measures
Average Nebraska avg: 3.5 Info CMS star rating based on short-stay quality measure performance. 5 stars = much above average, 1 star = much below average.
Pneumococcal Vaccine Info Percent of short-stay residents assessed and appropriately given the pneumococcal vaccine 99.0%
5% better than Nebraska average

Nebraska average: 94.0%

Antipsychotic medication increase Info Percent of short-stay residents who newly received an antipsychotic medication 1.9%
30% worse than Nebraska average

Nebraska average: 1.5%

Influenza Vaccine Info Percent of short-stay residents assessed and appropriately given the seasonal influenza vaccine 94.2%
In line with Nebraska average

Nebraska average: 93.2%

Re-hospitalized after SNF stay Info Percentage of short-stay residents who were re-hospitalized after their nursing home admission. 25.3%
9% worse than Nebraska average

Nebraska average: 23.2%

Emergency department visits Info Percentage of short-stay residents who had an outpatient emergency department visit. 17.2%
54% worse than Nebraska average

Nebraska average: 11.2%

Falls with major injury Info Percentage of SNF residents who experience falls with major injury during their stay. 0.0%
100% better than Nebraska average

Nebraska average: 0.8%

Ability to care for self at discharge Info Percentage of residents at or above expected ability to care for themselves at discharge. 61.2%
14% better than Nebraska average

Nebraska average: 53.7%

Successful return to home or community Info Rate of successful return to home or community from a skilled nursing facility. 64.6%
28% better than Nebraska average

Nebraska average: 50.6%

Breakdown by payment type

Medicare

21% of new residents, usually for short-term rehab.

Typical stay 1 months

Private pay

72% of new residents, often for short stays.

Typical stay 22 days

Medicaid

7% of new residents, often for long-term daily care.

Typical stay 10 - 11 months

Facility Characteristics

Source: CMS Long-Term Care Facility Characteristics (Data as of Jan 2026)

Total residents 84
Medicare
20
23.8% of residents
Medicaid
32
38.1% of residents
Private pay or other
32
38.1% of residents
Programs & Services
Residents Group

Residents meet regularly to discuss policies, care quality, and activities

Active Resident Council

Organized group of residents that meets regularly to discuss facility policies, quality of life, and activities.

Finances and operations

Privately-owned community
Operated by a business corporation.
Home revenue
$15.3M
Profit
$881.6K
Privately-owned community Operated by a business corporation.
Home revenue
$15.3M Rank #203 / 347Revenue — State benchmarkedThis home is ranked 203rd out of 347 homes in California. Shows this facility's annual revenue compared to the California SNF average. Higher revenue generally means more resources for staffing and capital — read alongside Payroll %.Click the rank badge to see the full State ranking.Click here to see the full State ranking.
Profit
$881.6K
Payroll costs Info The portion of the home's budget spent on staff, including nurses, caregivers, and other employees who support care and operations. Rank #193 / 347Payroll — State benchmarkedThis home is ranked 193rd out of 347 homes in California. Shows total annual staff payroll benchmarked to the California average. Higher payroll investment relative to peers often signals better staffing and less reliance on cheaper contract labor.Click the rank badge to see the full State ranking.Click here to see the full State ranking.
$8.0M
52.1% of revenue Rank #144 / 347Payroll % — State benchmarkedThis home is ranked 144th out of 347 homes in California. Shows payroll as a percentage of revenue versus the California average. Well-run California SNFs typically land around 56–67% — the top third Statewide. Below 25% may signal understaffing or heavy agency use — read with Staffing ratings.Click the rank badge to see the full State ranking.Click here to see the full State ranking.
Other operating costs Info All remaining costs needed to run the home, such as food, utilities, building maintenance, supplies and administrative expenses.
$6.4M
Total costs $14.4M

Who this home usually serves

TYPE OF STAY

Primarily short stays

Residents typically stay for brief periods, with frequent admissions and discharges throughout the year.

Places of interest near Brookside Rehabilitation Center

Address 19.3 miles from city center Info Estimated distance in miles from Redlands's city center to Brookside Rehabilitation Center's address, calculated via Google Maps. — 13.92 miles to nearest hospital (Desert Valley Hospital)

Calculate Travel Distance to Brookside Rehabilitation Center

Add your location

Address

Financial Assistance for
Nursing Home in Nebraska

Brookside Rehabilitation Center is located in Redlands, Nebraska.
Here are the financial assistance programs available to residents in Nebraska.

Get Financial aid guidance

Aged and Disabled Waiver

Nebraska Medicaid A&D Waiver

Age 65+ or disabled
General Nebraska resident, Medicaid- eligible, nursing home-level care need.
Income Limits (2025) ~$2,829/month 300% FBR, individual
Asset Limits $4,000 individual, higher than most states
NE

Higher asset limit; rural access focus.

Benefits
Personal care (5-7 hours/day) Respite (240 hours/year) Adult day care (~$60/day) Home aides

Nebraska Respite Network

NE Respite Network

Age Caregiver of someone 60+
General Nebraska resident.
Income Limits No strict limit; prioritizes low-income.
Asset Limits Not applicable.
NE

Lifespan respite focus; limited funding.

Benefits
In-home respite (4-6 hours/day) Adult day care (~$60/day) Short-term facility care (up to 5 days)

Personal Assistance Services (PAS)

Nebraska Personal Assistance Services

Age 19+ (65+ for seniors focus)
General Nebraska resident, Medicaid-eligible, needs help with 1+ ADL (e.g., bathing, dressing).
Income Limits (2025) ~$1,255/month (100% FPL, individual); spenddown allowed.
Asset Limits $4,000 (individual), $6,000 (couple) (excludes home up to $688,000, car).
NE

Family can be paid caregivers; statewide via DHHS.

Benefits
Personal care (4-6 hours/day) Limited homemaker services Respite (~200 hours/year)

Program of All-Inclusive Care for the Elderly (PACE)

Nebraska PACE (Immanuel Pathways)

Age 55+
General Nebraska resident (specific counties), NFLOC, safe with PACE support.
Income Limits (2025) ~$2,829/month (Medicaid-eligible); private pay option available.
Asset Limits $4,000 (individual), $6,000 (couple).
NE

Only in Douglas, Sarpy, parts of Cass/Pottawattamie/Washington Counties.

Benefits
Personal care (5-7 hours/day) Medical care Meals Transportation Respite Therapies

Medicare Savings Program (MSP)

Nebraska Medicare Savings Program

Age 65+ or disabled
General Nebraska resident, Medicare Part A/B.
Income Limits (2025) ~$2,510/month (QMB), ~$3,380/month (SLMB), ~$3,598/month (QI)—individual.
Asset Limits $9,430 (individual), $14,130 (couple).
NE

Three tiers; no waitlist; includes Extra Help for Part D.

Benefits
Covers Part B premiums ($174.70/month) Deductibles ($240/year) Copays (~20%)

VA Aid and Attendance (A&A) and Housebound Benefits

Nebraska VA Aid and Attendance/Housebound

Age 65+ or disabled veteran/spouse
General Nebraska resident, wartime service, need for ADL help (A&A) or homebound.
Income Limits (2025) Net income < ~$1,984/month (veteran with dependent, A&A); pension offsets income.
Asset Limits ~$155,356 net worth limit
NE

High veteran demand in rural areas.

Benefits
Cash (~$1,433-$2,642/month veteran, ~$951-$1,318 spouse) for care costs (e.g., in-home, assisted living)

Compare Nursing Home around Lincoln

The information below is reported by the Nebraska Department of Health and Human Services, Division of Public Health.

5 facilities compared · CMS & NE Dept. of Health data

Filter by care type
Southlake Village Rehabilitation & Care Center
NH

Nursing Home Licensed facility providing 24/7 skilled nursing care for residents with complex, ongoing medical needs. Staffed by RNs, LPNs, and CNAs. Inspected and star-rated annually by CMS. Accepts Medicare (short-term rehab) and Medicaid (long-term care).

AL

Assisted Living A licensed, long-term care setting for seniors or individuals with disabilities who need help with daily activities — like bathing, dressing, and medication management — but not 24-hour skilled nursing. Offers housing, meals, and around-the-clock support while aiming to maximize resident independence.

Lincoln126 94.1% +34%5.17 -48%+16%$0155.0-119- 15 David Bergmann$21.3M$12.8M60%285219
Tabitha Residence – Cove House
NH

Nursing Home Licensed facility providing 24/7 skilled nursing care for residents with complex, ongoing medical needs. Staffed by RNs, LPNs, and CNAs. Inspected and star-rated annually by CMS. Accepts Medicare (short-term rehab) and Medicaid (long-term care).

AL

Assisted Living A licensed, long-term care setting for seniors or individuals with disabilities who need help with daily activities — like bathing, dressing, and medication management — but not 24-hour skilled nursing. Offers housing, meals, and around-the-clock support while aiming to maximize resident independence.

Lincoln (Williamsburg Park Apartments)50 65.2% -7%5.15 +28%+16%$0133.3-29- 61 Kelsie Ryan$5.5M$3.2M59%285288
Tabitha Nursing and Rehabilitation Center
NH

Nursing Home Licensed facility providing 24/7 skilled nursing care for residents with complex, ongoing medical needs. Staffed by RNs, LPNs, and CNAs. Inspected and star-rated annually by CMS. Accepts Medicare (short-term rehab) and Medicaid (long-term care).

AL

Assisted Living A licensed, long-term care setting for seniors or individuals with disabilities who need help with daily activities — like bathing, dressing, and medication management — but not 24-hour skilled nursing. Offers housing, meals, and around-the-clock support while aiming to maximize resident independence.

IL

Independent Living Lifestyle-focused communities for older adults offering dining, activities, and transportation with minimal personal care. Best for active, independent seniors who want community without medical support.

MC

Memory Care Secured, specialized care for people living with Alzheimer's or dementia. Staff trained in cognitive impairment, with higher staff-to-resident ratios and an environment designed to reduce confusion and wandering risk.

Lincoln (Witherbee)208 131.0% +86%5.76 -20%+29%$13.0k184.5-131A+ 59 Tabitha, Inc.$71.9M$39.2M54.5%285057
Brookside Rehabilitation Center
NH

Nursing Home Licensed facility providing 24/7 skilled nursing care for residents with complex, ongoing medical needs. Staffed by RNs, LPNs, and CNAs. Inspected and star-rated annually by CMS. Accepts Medicare (short-term rehab) and Medicaid (long-term care).

AL

Assisted Living A licensed, long-term care setting for seniors or individuals with disabilities who need help with daily activities — like bathing, dressing, and medication management — but not 24-hour skilled nursing. Offers housing, meals, and around-the-clock support while aiming to maximize resident independence.

Redlands97 89.3% +5%4.27 -8%+1%$0353.5-82A+ 0 Michelle Mora$15.3M$8.0M52.1%56372
Gateway Vista
NH

Nursing Home Licensed facility providing 24/7 skilled nursing care for residents with complex, ongoing medical needs. Staffed by RNs, LPNs, and CNAs. Inspected and star-rated annually by CMS. Accepts Medicare (short-term rehab) and Medicaid (long-term care).

AL

Assisted Living A licensed, long-term care setting for seniors or individuals with disabilities who need help with daily activities — like bathing, dressing, and medication management — but not 24-hour skilled nursing. Offers housing, meals, and around-the-clock support while aiming to maximize resident independence.

Lincoln (Culler)80 83.2% +18%4.84 -20%+9%$8.7k103.3167A+ 71 Mikel Ardley$25.2M$7.0M27.7%285266

Frequently Asked Questions about Brookside Rehabilitation Center

What is the phone number of Brookside Rehabilitation Center?

(909) 793-2271 will put you in contact with the team at Brookside Rehabilitation Center.

Is Brookside Rehabilitation Center Medicare or Medicaid certified?

Yes — Brookside Rehabilitation Center is a CMS-certified provider of Medicare and Medicaid.

Guides for Better Senior Living

Care Cost Calculator: See Prices in Your Area

Nursing Home Data Explorer

Don’t Wait Too Long: 7 Red Flag Signs Your Parent Needs Assisted Living Now

The True Cost of Assisted Living in 2025 – And How Families Are Paying For It

Understanding Senior Living Costs: Pricing Models, Discounts & Financial Assistance

Explore Open Rooms
1 Contact details
2 What type of senior care service are you looking for?
3 What budget do you have in mind for senior care?
4 How soon do you need to find care?
5 Additional details

Thank you for your interest!

Our team will be in touch shortly to help with next steps.