Brookside Rehabilitation Center
Nursing Home, Hospice Care, Palliative Care & Respite Care · Redlands, CA
CMS overall rating Info CMS (the Centers for Medicare & Medicaid Services) is the federal agency that rates nursing home quality. Its Overall Rating runs from 1 to 5 stars, combining health inspections, staffing, and quality measures, with inspections weighted most heavily.

Brookside Rehabilitation Center

Nursing Home, Hospice Care, Palliative Care & Respite Care · Redlands, CA
CMS overall rating Info CMS (the Centers for Medicare & Medicaid Services) is the federal agency that rates nursing home quality. Its Overall Rating runs from 1 to 5 stars, combining health inspections, staffing, and quality measures, with inspections weighted most heavily.
Calculator: See prices in your area
Brookside Rehabilitation Center accepts Medicare, Medicaid, and private pay.

Overview of Brookside Rehabilitation Center

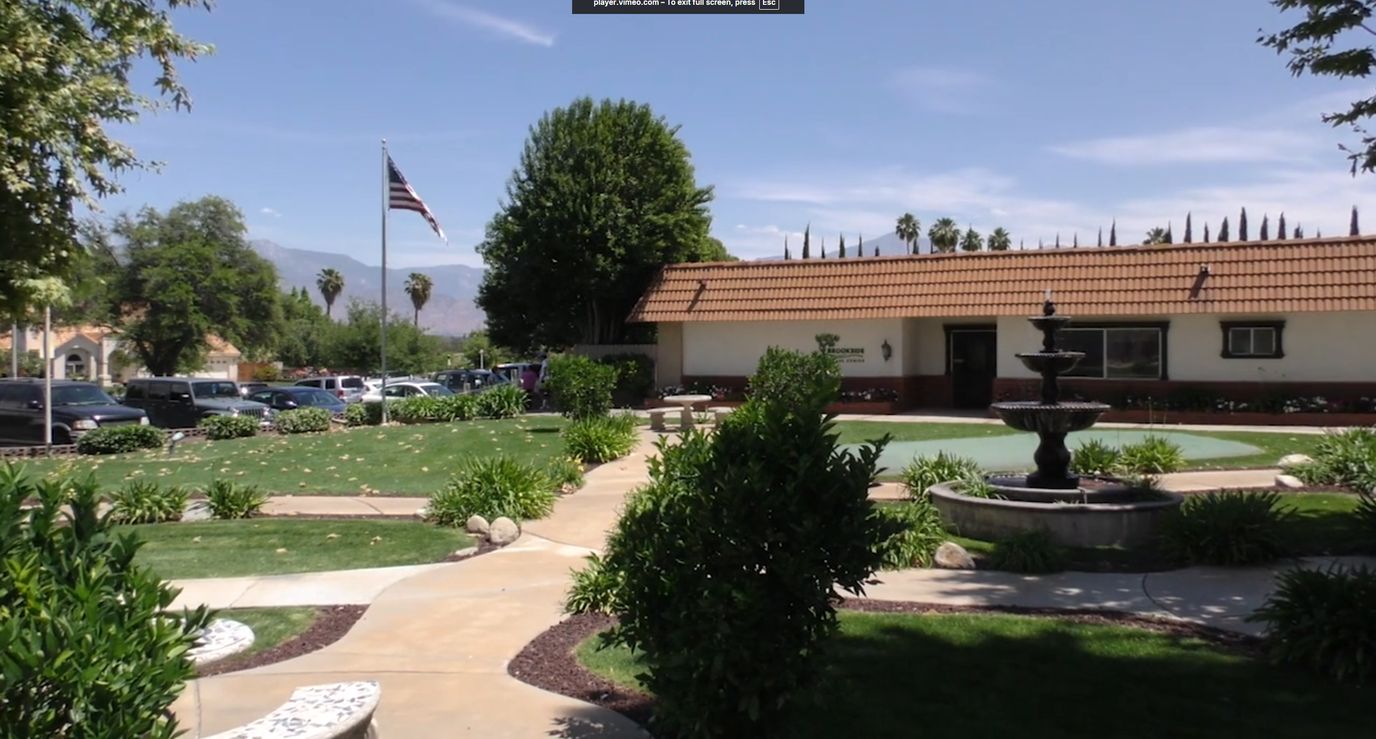
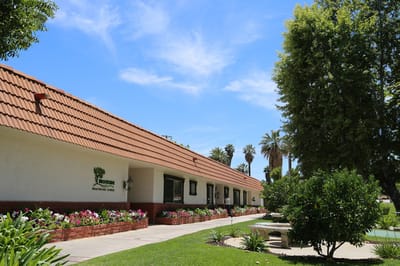
Brookside Rehabilitation Center operates as a 97-bed skilled nursing facility privately owned by Michelle Mora. The address is 105 Terracina Boulevard, Redlands, San Bernardino County, California. The census hovers around 84 residents with 89.3 percent occupancy; a strong local demand signal. Most new admissions are private-pay (72 percent) or Medicare (21 percent), with Medicaid comprising 7 percent, reflecting a short-stay rehabilitation model where the average resident stays roughly 48 days.

Amenities include a library, rotating dining menus, courtyard gatherings, and salon services.

The facility invests substantially in rehabilitation services: physical therapy runs 60 percent above the California average, and total nursing hours; 4 hours 16 minutes per resident per day. CMS records show no federal penalties over three years. A BBB rating of A+ and strong short-stay outcomes (64.6 percent of rehabilitation residents return home versus 50.6 percent statewide) indicate operational competence in select areas.

Compliance outcomes paint a different picture. Seven complaint investigations between April 2023 and September 2024 exposed recurring care failures: call lights on the night shift left unanswered for up to three hours (affecting critically ill residents with quadriplegia, hemiplegia, and cardiac disease); a high-risk resident left unsupervised in the lobby and subsequently injured in a wheelchair fall; medication safety lapses where insulin was stored past its beyond-use date; wound assessments missing on admission and delayed four days; care plans ordering documented interventions (neurological checks, meal monitoring, floor mats) that went unrecorded; and an incident of alleged resident-to-resident abuse that the facility failed to report to administrators or regulatory agencies.

The ten inspections since 2019 (more than double the state average) yielded 35 citations; all moderate severity but indicating persistent systemic issues. Quality metrics reveal the operational strain: depressive symptom prevalence at 147 percent worse than state average, functional decline 45 percent worse, walking ability deterioration 53 percent worse, and low-risk incontinence prevalence at 98 percent above state. These figures suggest monitoring, care coordination, and psychosocial support gaps. Fall-related injury rates are excellent (0 percent), and vaccination completion is exemplary.

The nursing model, with its strong LPN and CNA deployment but only 12 RNs for 84 residents, correlates with the documented assessment and clinical-oversight deficiencies.

Quality ratings

Measured by Centers for Medicare & Medicaid Services (CMS)

Overall rating Info The Overall CMS Rating combines results from health inspections, staffing levels and quality measures. Health inspections carry the most weight. Staffing and quality scores can increase or decrease the final rating based on performance compared to state and national standards.
▲ 2.7% Above NE avg. ▲ 2.7% Above NE avg.NE average: 2.9Click the badge to see the full State ranking.Click here to see the full State ranking.
Health Inspection Info Based on the results of the facility's three most recent standard inspections and any complaint investigations. CMS reviews the number, scope, and severity of deficiencies, with more recent findings weighted more heavily.
▲ 5.4% Above NE avg. ▲ 5.4% Above NE avg.NE average: 2.8Click the badge to see the full State ranking.Click here to see the full State ranking.
Staffing Info Measures average nursing staff hours per resident per day, including Registered Nurses (RNs) and total nursing staff. Ratings are adjusted based on the level of care residents require and are compared to state and national benchmarks.
▲ 20.6% Above NE avg. ▲ 20.6% Above NE avg.NE average: 3.3Click the badge to see the full State ranking.Click here to see the full State ranking.
Quality Measures Info Based on clinical and physical health indicators reported to CMS, such as hospital readmissions, falls, pressure ulcers, and improvements in mobility. These measures reflect how well residents' health needs are being managed.
▲ 39.4% Above NE avg. ▲ 39.4% Above NE avg.NE average: 2.9Click the badge to see the full State ranking.Click here to see the full State ranking.

Staffing hours breakdown

Info Daily nursing hours per resident by staff type, reported to CMS. Higher is generally better — compare this facility to state and national averages to see where staffing stands.

Hours per resident per day — compared to Nebraska state averages

Total nursing care / resident Info This home is ranked 122nd out of 354 homes in Nebraska for nurse hours. Total adjusted nursing hours per resident per day, combining RN, LPN, and aide time. CMS adjusts this for case-mix so facilities can be fairly compared.
4h 16m per day
Rank #122 / 354Nurse hours — State benchmarkedThis home is ranked 122nd out of 354 homes in California. Shows adjusted nurse hours per resident per day benchmarked to the California average, with a ranking across 354 California facilities. More hours mean more direct care. The national average is about 3.5 hrs; below 3.0 is a red flag.Rankings are based only on facilities in California that report data for that category. Facilities without available data are excluded from the ranking.Click the rank badge to see the full State ranking.Click here to see the full State ranking.
This facility Nebraska avg (4h 27m per day)
vs Nebraska avg
-4%

4 of 6 metrics below state avg

Standout metric Physical Therapist is +104% above state avg
Staff typeHours / Day / Residentvs state avg
Registered Nurse (RN) Info RNs hold the highest nursing license and can assess residents, interpret test results, and direct care plans. More RN hours per day often signals stronger clinical oversight and faster response to health changes. 30m per day ▼ 24% State avg: 39m per day · National avg: 41m per day
LPN / LVN Info Licensed Practical Nurses (LPNs) or Licensed Vocational Nurses (LVNs) deliver routine hands-on care — medication administration, wound dressing, and monitoring vital signs. They work under RN supervision and make up a large share of daily bedside care. 1h 34m per day ▲ 29% State avg: 1h 13m per day · National avg: 52m per day
Nurse Aide Info Certified Nurse Aides (CNAs) provide the most direct day-to-day assistance: bathing, dressing, feeding, and mobility. Nurse aide hours are typically the largest staffing category and directly affect residents' quality of life. 2h 27m per day ▼ 7% State avg: 2h 39m per day · National avg: 2h 21m per day
Weekend Total Nursing Info Combined nursing hours (RN + LPN + Nurse Aide) per resident per day on weekends. Staffing often drops on weekends — this figure reveals whether the facility maintains adequate coverage outside of weekday hours. 3h 56m per day ▼ 4% State avg: 4h 5m per day · National avg: 3h 26m per day
Physical Therapist Info Hours per resident per day provided by licensed Physical Therapists (PTs) or PT Assistants. PT services help residents recover mobility after injury or illness and are especially important for post-acute (short-stay) rehabilitation. 10m per day ▲ 104% State avg: 5m per day · National avg: 4m per day
Weekend RN Info Registered nurse hours specifically on weekends. Facilities sometimes reduce RN presence on Saturdays and Sundays — a low weekend RN figure compared to weekday hours can indicate reduced clinical oversight when most administrative staff are absent. 20m per day ▼ 33% State avg: 30m per day · National avg: 29m per day

Capacity and availability

This home usually has limited availability

Higher occupancy than the Nebraska average: 70.3%
Occupancy rate
88.7% Rank #360 / 1537Occupancy rate — State benchmarkedThis home is ranked 360th out of 1537 homes in California. Shows this facility's occupancy rate versus the California average, with its Statewide rank out of 1537. Higher occupancy signals strong local demand and financial stability.Rankings are based only on facilities in California that report data for that category. Facilities without available data are excluded from the ranking.Click the rank badge to see the full State ranking.Click here to see the full State ranking.
Avg. Length of Stay
48 days
Bed community size
97-bed community Rank #795 / 1657Bed count — State benchmarkedThis home is ranked 795th out of 1657 homes in California. Shows this facility's certified or reported bed count compared to other California facilities. Larger communities may offer more amenities, programs, and on-site services for residents and families.Rankings are based only on facilities in California that report data for that category. Facilities without available data are excluded from the ranking.Click the rank badge to see the full State ranking.Click here to see the full State ranking.
A larger shared setting that may offer more common spaces and organized community services.
Years in operation
55 years in operation Rank #7 / 1487Years in operation — State benchmarkedThis home is ranked 7th out of 1487 homes in California. Shows how long this facility has been in operation compared to other California facilities. Longer operating histories may benefit residents, families, and staff.Rankings are based only on facilities in California that report data for that category. Facilities without available data are excluded from the ranking.Click the rank badge to see the full State ranking.Click here to see the full State ranking.
A longer operating history, which may indicate experience navigating regulations and delivering ongoing care.
Walk Score
Walk Score: 0 / 100 Rank #2070 / 2092Walk Score — State benchmarkedThis home is ranked 2070th out of 2092 homes in California. Shows how walkable this facility's neighborhood is compared to the average Walk Score across California facilities. Higher scores benefit residents, families, and staff.Rankings are based only on facilities in California that report data for that category. Facilities without available data are excluded from the ranking.Click the rank badge to see the full State ranking.Click here to see the full State ranking.
Car-dependent. Most errands require a car, with limited nearby walkable options.
BBB Rating
BBB Rating: A+ (Not Accredited)
An independent rating from the Better Business Bureau based on factors such as complaint history, transparency, and business practices.
How BBB ratings work

About this community

License Details

AccreditationsQuality Assurance & Performance Improvement (QAPI) certified by the Centers for Medicare and Medicaid Services (CMS)

Staffing

Key information about the people who lead and staff this community.

Leadership

ContactDigant Soni

Therapy & Rehabilitation

1 service
Rehabilitation Services

Amenities & Lifestyle

Fitness & Stimulating Brain Games
Wi-Fi Throughout The Property
Dish Tv And Phones In Every Room
Rec Room With Games
Library With A Robust Assortment Of Books And Videos
Spacious Dining Area With Fresh
Rotating Menus
Popular Courtyard B-B-Qs
Barber/Beauty Salon Services
Holiday And Birthday Celebrations
Specific ProgramsPost-Acute Rehabilitation, Clinical Services

Contact Brookside Rehabilitation Center

Inspection History

In Nebraska, the Department of Social Services (for assisted living facilities) and the Department of Public Health (for nursing homes) conduct inspections to ensure resident safety and regulatory compliance.

Since 2019 · 7 years of data 35 citations 10 total visits 4 complaint visits
Inspection Score Info A composite 0–100 score combining this facility's inspections, citations, complaints, and enforcement actions relative to the Nebraska state average. The score below shows how many points this facility sits above or below the typical Nebraska nursing home score (the benchmark); higher is better.

6 points below the Nebraska average for nursing homes (81/100)

Rank #973 / 1401 in Nebraska Inspection Score — State benchmarked This home is ranked 973rd out of 1401 homes in Nebraska. Shows this facility's inspection score compared to the Nebraska average among 1401 comparable communities in the ranking pool. Rankings are based only on facilities in Nebraska that report data for that category. Facilities without available data are excluded from the ranking. Inspection score: 75 out of 100. Letter grade C. 6 points below the Nebraska average for nursing homes (81/100)

Inspection Scorecard Info This scorecard compares key inspection, citation, and complaint metrics at this facility against the Nebraska state average. Metrics rated ≥15% worse than average are highlighted in red; those ≥15% better are highlighted in green.

Since 2019 vs. Nebraska state average
Overall vs. CA average 3 Worse Metrics worse than Nebraska average:
• Total citations (250% above)
• Citations per year (257% above)
• Citations per inspection (6% above)
3 Better Metrics better than Nebraska average:
• Total visits (75% below)
• Complaint visits (69% below)
• Other visits (100% below)
Latest Inspection October 25, 2024 Routine

Citations Info Citations are formal regulatory issues recorded during state inspections.

This FacilityCA Averagevs. CA Avg
Total citations Info Formal regulatory issues recorded by inspectors across all inspection types. 3510 This facility has 250% more total citations than a typical Nebraska nursing home (35 vs. CA avg 10).↑ 250% worse
Citations per year Info Average citations per year since 2019. 51.4 This facility has 257% more citations per year than a typical Nebraska nursing home (5 vs. CA avg 1.4).↑ 257% worse
Citations per inspection Info Average citations per inspection. 3.53.3 This facility has 6% more citations per inspection than a typical Nebraska nursing home (3.5 vs. CA avg 3.3).↑ 6% worse

Inspections & Visits Info State inspections evaluate whether the facility meets health and safety standards.

This FacilityCA Averagevs. CA Avg
Total visits Info Combined count of complaint visits, other regulatory visits, and official scheduled inspections. 416 This facility has 75% fewer total visits than a typical Nebraska nursing home (4 vs. CA avg 16).↓ 75% better
Complaint visits Info On-site visits triggered by formal complaints filed by residents, families, or staff. 413 This facility has 69% fewer complaint visits than a typical Nebraska nursing home (4 vs. CA avg 13).↓ 69% better
Other visits Info Regulatory visits that are neither routine inspections nor complaint investigations — administrative check-ins, follow-up reviews, licensing-related visits. 07 This facility has 100% fewer other visits than a typical Nebraska nursing home (0 vs. CA avg 7).↓ 100% better

Health Inspection History

Inspections since 2019
Total health inspections 10

Nebraska average 4.3


Last Health inspection on Oct 2024

Total health citations
35 Rank #145 / 361Health citations — State benchmarkedThis home is ranked 145th out of 361 homes in California. Shows this facility's total health deficiency citations benchmarked to the California State average, with a ranking across all 361 CA facilities. Lower citation counts earn a better rank.Rankings are based only on facilities in California that report data for that category. Facilities without available data are excluded from the ranking.Click the rank badge to see the full State ranking.Click here to see the full State ranking.

Nebraska average 18.2

Citations per inspection
3.5 Rank #115 / 361Citations per inspection — State benchmarkedThis home is ranked 115th out of 361 homes in California. Shows average deficiency citations per CMS inspection for this facility versus the California mean across 361 facilities with citation data. Lower is better.Rankings are based only on facilities in California that report data for that category. Facilities without available data are excluded from the ranking.Click the rank badge to see the full State ranking.Click here to see the full State ranking.

Nebraska average 4.19


Health citations are formal notices following inspections when they fail to comply with safety and care standards.

27 of 35 citations resulted from standard inspections; and 8 of 35 resulted from complaint investigations.

Breakdown of citation severity (last 7 years)
Critical health citations
0
100% better than Nebraska average

Nebraska average: 0.2


Serious health citations
0
100% better than Nebraska average

Nebraska average: 0.5

0 critical citations Nebraska average: 0.2

0 serious citations Nebraska average: 0.5

35 moderate citations Nebraska average: 17.2

0 minor citations Nebraska average: 0.2
Citations history (last 7 years)
Administration moderate citation Oct 25, 2024
Corrected

Infection Control moderate citation Oct 25, 2024
Corrected

Nursing Services moderate citation Oct 25, 2024
Corrected

Nutrition moderate citation Oct 25, 2024
Corrected

Staffing Data

Reporting period: October 1 – December 31, 2025 (Q4 2025). Source: CMS Payroll-Based Journal report.

Total staff 146
Employees 146
Contractors 0
Staff to resident ratio 1.74 : 1
14% fewer staff per resident than Nebraska average
Nebraska average ratio: 2.03 : 1 Nebraska average ratio: 2.03 : 1See full Nebraska ranking
Avg staff/day 66
Average shift 7.1 hours
9% worse than Nebraska average
Nebraska average: 7.8 hours Nebraska average shift: 7.8 hoursSee full Nebraska ranking
Total staff hours (quarter) 42,954

Nursing staff breakdown

Q4 2025 · Oct 1 – Dec 31 More info This data comes from the CMS Payroll-Based Journal report covering October 1 – December 31, 2025.
Registered Nurse

Manages medical care and health needs.

RN Staff Info All 12 RN Staff are full-time employees. No contractors work on this role. 12
Average shift length Info Average shift length. Calculated as total hours divided by days worked and average staff per day. 7.3 hours
Licensed Practical Nurse

Assists with medical care and medications.

LPN Staff Info All 34 LPN Staff are full-time employees. No contractors work on this role. 34
Average shift length Info Average shift length. Calculated as total hours divided by days worked and average staff per day. 7.4 hours
Certified Nursing Assistant

Helps with daily care and mobility.

CNA Staff Info All 59 CNA Staff are full-time employees. No contractors work on this role. 59
Average shift length Info Average shift length. Calculated as total hours divided by days worked and average staff per day. 6.9 hours

Contractor staffing

Q4 2025 · Oct 1 – Dec 31 More info This data comes from the CMS Payroll-Based Journal report covering October 1 – December 31, 2025.
Total hours from contractors 0% — all staff are direct employees this quarter

Staff by category

Q4 2025 · Oct 1 – Dec 31 More info This data comes from the CMS Payroll-Based Journal report covering October 1 – December 31, 2025.
Certified Nursing Assistant5905917,90892100%6.9
Licensed Practical Nurse3403410,89592100%7.4
Registered Nurse120122,47692100%7.3
Dental Services Staff5052,4276975%7.7
Physical Therapy Aide6061,8057278%7.5
Speech Language Pathologist9091,6389098%6.3
Respiratory Therapy Technician5051,2407784%6.4
Physical Therapy Assistant4041,1568795%6.4
Other Dietary Services Staff2026958896%7.9
Nurse Practitioner1015766470%9
Clinical Nurse Specialist1015676368%9
RN Director of Nursing1015406065%9
Dietitian1014836470%7.6
Therapeutic Recreation Specialist2024796470%3.7
Qualified Social Worker303561415%4
Administrator1011367%2.2
59 Certified Nursing Assistant
% of Days 100%
34 Licensed Practical Nurse
% of Days 100%
12 Registered Nurse
% of Days 100%
5 Dental Services Staff
% of Days 75%
6 Physical Therapy Aide
% of Days 78%
9 Speech Language Pathologist
% of Days 98%
5 Respiratory Therapy Technician
% of Days 84%
4 Physical Therapy Assistant
% of Days 95%
2 Other Dietary Services Staff
% of Days 96%
1 Nurse Practitioner
% of Days 70%
1 Clinical Nurse Specialist
% of Days 68%
1 RN Director of Nursing
% of Days 65%
1 Dietitian
% of Days 70%
2 Therapeutic Recreation Specialist
% of Days 70%
3 Qualified Social Worker
% of Days 15%
1 Administrator
% of Days 7%

Penalties and fines

Federal penalties imposed by CMS for regulatory violations, including civil money penalties (fines) and denials of payment for new Medicare/Medicaid admissions.

Source: CMS Penalties Database

No penalties in the past 3 years

No civil money penalties or payment denials were reported in the last 3 years.

Quality of care over time

These measures show how residents usually do over time at this home, based on health outcomes and preventive care.

High-risk clinical events score Info A composite score based on pressure ulcers, falls with injury, weight loss, walking ability decline, and activities of daily living decline. 6.9
In line with Nebraska average

Nebraska average: 6.6

Functional decline score Info A composite score based on activities of daily living decline, walking ability decline, and incontinence. 16.4
45% worse than Nebraska average

Nebraska average: 11.3

Long-stay resident measures
Significantly above average Nebraska avg: 4.2 Info CMS star rating based on long-stay quality measure performance. 5 stars = significantly above average, 1 star = significantly below average.
Need for Help with Daily Activities Increased Info Percent of long-stay residents whose need for help with daily activities has increased 8.5%
23% better than Nebraska average

Nebraska average: 11.1%

Walking Ability Worsened Info Percent of long-stay residents whose ability to move independently worsened 18.3%
53% worse than Nebraska average

Nebraska average: 12.0%

Low Risk Residents with Bowel/Bladder Incontinence Info Percent of low risk long-stay residents who lose control of their bowels or bladder 22.4%
98% worse than Nebraska average

Nebraska average: 11.3%

Falls with Major Injury Info Percent of long-stay residents experiencing one or more falls with major injury 0.0%
100% better than Nebraska average

Nebraska average: 1.7%

High Risk Residents with Pressure Ulcers Info Percent of long-stay high risk residents with pressure ulcers 5.7%
16% worse than Nebraska average

Nebraska average: 5.0%

Urinary Tract Infection Info Percent of long-stay residents with a urinary tract infection 0.0%
100% better than Nebraska average

Nebraska average: 1.2%

Lost Too Much Weight Info Percent of long-stay residents who lose too much weight 2.1%
51% better than Nebraska average

Nebraska average: 4.2%

Depressive Symptoms Info Percent of long-stay residents who have depressive symptoms 16.5%
147% worse than Nebraska average

Nebraska average: 6.7%

Antipsychotic Use Info Percent of long-stay residents who received an antipsychotic medication 1.5%
85% better than Nebraska average

Nebraska average: 10.1%

Pneumococcal Vaccine Info Percent of long-stay residents assessed and appropriately given the pneumococcal vaccine 100.0%
In line with Nebraska average

Nebraska average: 98.5%

Influenza Vaccine Info Percent of long-stay residents assessed and appropriately given the seasonal influenza vaccine 100.0%
In line with Nebraska average

Nebraska average: 98.2%

Hospitalizations per 1,000 days Info Number of hospitalizations per 1,000 long-stay resident days. 1.37
39% better than Nebraska average

Nebraska average: 2.25

ED visits per 1,000 days Info Number of outpatient emergency department visits per 1,000 long-stay resident days. 1.52
In line with Nebraska average

Nebraska average: 1.59

Short-stay resident measures
Average Nebraska avg: 3.5 Info CMS star rating based on short-stay quality measure performance. 5 stars = much above average, 1 star = much below average.
Pneumococcal Vaccine Info Percent of short-stay residents assessed and appropriately given the pneumococcal vaccine 99.0%
5% better than Nebraska average

Nebraska average: 94.0%

Antipsychotic medication increase Info Percent of short-stay residents who newly received an antipsychotic medication 1.9%
30% worse than Nebraska average

Nebraska average: 1.5%

Influenza Vaccine Info Percent of short-stay residents assessed and appropriately given the seasonal influenza vaccine 94.2%
In line with Nebraska average

Nebraska average: 93.2%

Re-hospitalized after SNF stay Info Percentage of short-stay residents who were re-hospitalized after their nursing home admission. 25.3%
9% worse than Nebraska average

Nebraska average: 23.2%

Emergency department visits Info Percentage of short-stay residents who had an outpatient emergency department visit. 17.2%
54% worse than Nebraska average

Nebraska average: 11.2%

Falls with major injury Info Percentage of SNF residents who experience falls with major injury during their stay. 0.0%
100% better than Nebraska average

Nebraska average: 0.8%

Ability to care for self at discharge Info Percentage of residents at or above expected ability to care for themselves at discharge. 61.2%
14% better than Nebraska average

Nebraska average: 53.7%

Successful return to home or community Info Rate of successful return to home or community from a skilled nursing facility. 64.6%
28% better than Nebraska average

Nebraska average: 50.6%

Breakdown by payment type

Medicare

21% of new residents, usually for short-term rehab.

Typical stay 1 months

Private pay

72% of new residents, often for short stays.

Typical stay 22 days

Medicaid

7% of new residents, often for long-term daily care.

Typical stay 10 - 11 months

Facility Characteristics

Source: CMS Long-Term Care Facility Characteristics (Data as of Jan 2026)

Total residents 84
Medicare
20
23.8% of residents
Medicaid
32
38.1% of residents
Private pay or other
32
38.1% of residents
Programs & Services
Residents Group

Residents meet regularly to discuss policies, care quality, and activities

Active Resident Council

Organized group of residents that meets regularly to discuss facility policies, quality of life, and activities.

Finances and operations

Based on CMS SNF Cost Report for fiscal year ending in 12/2023.

For-profit
Corporation
Net patient revenue Info Net patient revenue — what the home actually collects for resident care, after contractual allowances, bad debt and discounts are subtracted from its gross charges (CMS cost report, Worksheet G-3). It covers resident care only; money the home earns from other sources is shown separately as "Other income."
$13.2M
Net patient income Info Net patient income: net patient revenue minus the home's total operating expenses. A positive figure means it earns more from resident care than it spends to deliver it; a negative figure means the opposite. It excludes non-operating "other income."
$873.3K
For-profit Corporation
Net patient revenue Info Net patient revenue — what the home actually collects for resident care, after contractual allowances, bad debt and discounts are subtracted from its gross charges (CMS cost report, Worksheet G-3). It covers resident care only; money the home earns from other sources is shown separately as "Other income."
$13.2M Rank #205 / 355Revenue — State benchmarkedThis home is ranked 205th out of 355 homes in California. Shows this facility's annual revenue compared to the California average. Higher revenue generally means more resources for staffing and capital — read alongside Payroll %.Rankings are based only on facilities in California that report data for that category. Facilities without available data are excluded from the ranking.Click the rank badge to see the full State ranking.Click here to see the full State ranking.
Net patient income Info Net patient income: net patient revenue minus the home's total operating expenses. A positive figure means it earns more from resident care than it spends to deliver it; a negative figure means the opposite. It excludes non-operating "other income."
$873.3K
Other income Info Money the home earns outside of resident care — such as investments, grants, rentals and other non-operating sources (CMS cost report, Worksheet G-3). It is tracked separately from net patient revenue: it is not part of that figure, and it is not included in net patient income.
$8.3K
Payroll costs Info Staff salaries plus wage-related costs — benefits such as payroll taxes, health insurance and retirement — from the home's own accounting records (CMS cost report, Worksheet A). Contract or agency labor is counted separately, under other operating costs. Rank #195 / 355Payroll — State benchmarkedThis home is ranked 195th out of 355 homes in California. Shows total annual staff payroll benchmarked to the California average. Higher payroll investment relative to peers often signals better staffing and less reliance on cheaper contract labor.Rankings are based only on facilities in California that report data for that category. Facilities without available data are excluded from the ranking.Click the rank badge to see the full State ranking.Click here to see the full State ranking.
$7.7M 58.5% of net patient revenue Info Payroll as a share of revenue: staff salaries and wage-related benefits divided by net patient revenue. A higher figure means more of each revenue dollar goes to staff pay. Rank #147 / 355Payroll % — State benchmarkedThis home is ranked 147th out of 355 homes in California. Shows payroll as a percentage of revenue versus the California average. Well-run California facilities typically land around 55–67% — the top third Statewide. Below 25% may signal understaffing or heavy agency use — read with Staffing ratings.Rankings are based only on facilities in California that report data for that category. Facilities without available data are excluded from the ranking.Click the rank badge to see the full State ranking.Click here to see the full State ranking.
Other operating costs Info Everything it costs to run the home apart from payroll — food, utilities, supplies, maintenance, contract labor and administration. Calculated as total operating expense minus payroll (staff salaries and wage-related benefits).
$4.6M
Total costs Info The home's total operating expense for the year — all the costs of running it, salaries included (CMS cost report, Worksheet G-3).
$12.4M

Who this home usually serves

TYPE OF STAY

Primarily short stays

Residents typically stay for brief periods, with frequent admissions and discharges throughout the year.

Most new residents arrive under private pay (72% of admissions), and a typical private pay stay runs around 22 days.

Admissions
709 total

Coverage residents most often arrive under.

Medicare 21%
Private pay 72%
Medicaid 7%
Discharges
663 total

Coverage residents most often leave under.

Medicare 22%
Private pay 71%
Medicaid 8%

Places of interest near Brookside Rehabilitation Center

Address 105 Terracina Blvd, Redlands, Ca 92373, Usa — 13.92 miles to nearest hospital (Desert Valley Hospital)

Calculate Travel Distance to Brookside Rehabilitation Center

Add your location

Address

Compare Nursing Homes around Lincoln

The information below is reported by the Nebraska Department of Health and Human Services, Division of Public Health.

5 facilities compared · CMS & NE Dept. of Health data

Tabitha Nursing and Rehabilitation Center
NH
RC
Lincoln (Witherbee)
197
Facility 197
NE AVG 82
Rank #5 / 228
86.3%
Facility 86.3%
NE AVG 70.3%
Rank #55 / 196
+23%
5.76
Facility 5.76
NE AVG 4.45
Rank #7 / 130
-20%+29%
$0
Facility $0
NE AVG $38.1k
Rank #1 / 135
18
Facility 18
NE AVG 18.2
Rank #73 / 135
4.5
Facility 4.5
NE AVG 4.2
Rank #85 / 135
-170A+
59
Facility 59
NE AVG 46
Rank #85 / 298
Tabitha, Inc
$55.1M
Facility $55.1M
NE AVG $7.6M
Rank #1 / 133
$37.5M
Facility $37.5M
NE AVG $3.5M
Rank #1 / 133
68.2%
Facility 68.2%
NE AVG 49.4%
Rank #83 / 133
285057
Brookside Rehabilitation Center
NH
HC
PC
RC
Redlands97 88.7% +5%4.27 -8%+1%$0353.5-79A+ 0 Michelle Mora$13.2M$7.7M58.5%56372
Gateway Vista
NH
AL
IL
PC
RC
Lincoln (Culler)
80
Facility 80
NE AVG 82
Rank #84 / 228
90.0%
Facility 90.0%
NE AVG 70.3%
Rank #38 / 196
+28%
4.84
Facility 4.84
NE AVG 4.45
Rank #30 / 130
-20%+9%
$8.7k
Facility $8.7k
NE AVG $38.1k
Rank #100 / 135
10
Facility 10
NE AVG 18.2
Rank #31 / 135
3.3
Facility 3.3
NE AVG 4.2
Rank #37 / 135
172-
71
Facility 71
NE AVG 46
Rank #43 / 298
Mikel Ardley
$14.8M
Facility $14.8M
NE AVG $7.6M
Rank #4 / 133
$7.0M
Facility $7.0M
NE AVG $3.5M
Rank #18 / 133
47.1%
Facility 47.1%
NE AVG 49.4%
Rank #130 / 133
285266
Holmes Lake Rehabilitation & Care Center
NH
Lincoln (Normal Boulevard)
97
Facility 97
NE AVG 82
Rank #68 / 228
62.9%
Facility 62.9%
NE AVG 70.3%
Rank #149 / 196
-11%
3.51
Facility 3.51
NE AVG 4.45
Rank #110 / 130
-25%-21%
$0
Facility $0
NE AVG $38.1k
Rank #1 / 135
32
Facility 32
NE AVG 18.2
Rank #118 / 135
4.0
Facility 4.0
NE AVG 4.2
Rank #55 / 135
-53-
21
Facility 21
NE AVG 46
Rank #245 / 298
Holmes Lake Operations LLC
$4.6M
Facility $4.6M
NE AVG $7.6M
Rank #86 / 133
$2.8M
Facility $2.8M
NE AVG $3.5M
Rank #92 / 133
60.7%
Facility 60.7%
NE AVG 49.4%
Rank #90 / 133
285164
Emerald Nursing & Rehab Lancaster LLC
NH
HC
MC
NC
PC
Lincoln (Irvingdale)
293
Facility 293
NE AVG 82
Rank #1 / 228
--
3.69
Facility 3.69
NE AVG 4.45
Rank #94 / 130
+16%-17%
$79.7k
Facility $79.7k
NE AVG $38.1k
Rank #131 / 135
58
Facility 58
NE AVG 18.2
Rank #134 / 135
3.1
Facility 3.1
NE AVG 4.2
Rank #34 / 135
440A+
76
Facility 76
NE AVG 46
Rank #28 / 298
Lancaster Opco Holdings LLC
$23.5M
Facility $23.5M
NE AVG $7.6M
Rank #5 / 133
$9.0M
Facility $9.0M
NE AVG $3.5M
Rank #7 / 133
38.3%
Facility 38.3%
NE AVG 49.4%
Rank #106 / 133
285275

Financial Assistance for
Nursing Home in Nebraska

Brookside Rehabilitation Center is located in Redlands, Nebraska.
Here are the financial assistance programs available to residents in Nebraska.

Get Financial aid guidance

Aged and Disabled Waiver

Nebraska Medicaid A&D Waiver

Age 65+ or disabled
General Nebraska resident, Medicaid- eligible, nursing home-level care need.
Income Limits (2025) ~$2,829/month 300% FBR, individual
Asset Limits $4,000 individual, higher than most states
NE

Higher asset limit; rural access focus.

Benefits
Personal care (5-7 hours/day) Respite (240 hours/year) Adult day care (~$60/day) Home aides

Nebraska Respite Network

NE Respite Network

Age Caregiver of someone 60+
General Nebraska resident.
Income Limits No strict limit; prioritizes low-income.
Asset Limits Not applicable.
NE

Lifespan respite focus; limited funding.

Benefits
In-home respite (4-6 hours/day) Adult day care (~$60/day) Short-term facility care (up to 5 days)

Personal Assistance Services (PAS)

Nebraska Personal Assistance Services

Age 19+ (65+ for seniors focus)
General Nebraska resident, Medicaid-eligible, needs help with 1+ ADL (e.g., bathing, dressing).
Income Limits (2025) ~$1,255/month (100% FPL, individual); spenddown allowed.
Asset Limits $4,000 (individual), $6,000 (couple) (excludes home up to $688,000, car).
NE

Family can be paid caregivers; statewide via DHHS.

Benefits
Personal care (4-6 hours/day) Limited homemaker services Respite (~200 hours/year)

Program of All-Inclusive Care for the Elderly (PACE)

Nebraska PACE (Immanuel Pathways)

Age 55+
General Nebraska resident (specific counties), NFLOC, safe with PACE support.
Income Limits (2025) ~$2,829/month (Medicaid-eligible); private pay option available.
Asset Limits $4,000 (individual), $6,000 (couple).
NE

Only in Douglas, Sarpy, parts of Cass/Pottawattamie/Washington Counties.

Benefits
Personal care (5-7 hours/day) Medical care Meals Transportation Respite Therapies

Medicare Savings Program (MSP)

Nebraska Medicare Savings Program

Age 65+ or disabled
General Nebraska resident, Medicare Part A/B.
Income Limits (2025) ~$2,510/month (QMB), ~$3,380/month (SLMB), ~$3,598/month (QI)—individual.
Asset Limits $9,430 (individual), $14,130 (couple).
NE

Three tiers; no waitlist; includes Extra Help for Part D.

Benefits
Covers Part B premiums ($174.70/month) Deductibles ($240/year) Copays (~20%)

VA Aid and Attendance (A&A) and Housebound Benefits

Nebraska VA Aid and Attendance/Housebound

Age 65+ or disabled veteran/spouse
General Nebraska resident, wartime service, need for ADL help (A&A) or homebound.
Income Limits (2025) Net income < ~$1,984/month (veteran with dependent, A&A); pension offsets income.
Asset Limits ~$155,356 net worth limit
NE

High veteran demand in rural areas.

Benefits
Cash (~$1,433-$2,642/month veteran, ~$951-$1,318 spouse) for care costs (e.g., in-home, assisted living)

Frequently Asked Questions about Brookside Rehabilitation Center

What is the occupancy rate at Brookside Rehabilitation Center?

Brookside Rehabilitation Center's occupancy is 89.3%.

Does Brookside Rehabilitation Center operate as a for-profit or non-profit?

Brookside Rehabilitation Center is registered as a for-profit.

Are there photos of Brookside Rehabilitation Center?

Yes — there are 5 photos of Brookside Rehabilitation Center in the photo gallery on this page.

What is the address of Brookside Rehabilitation Center?

Brookside Rehabilitation Center is located at 105 Terracina Blvd, Redlands, Ca 92373, Usa.

What is the phone number of Brookside Rehabilitation Center?

(909) 793-2271 will put you in contact with the team at Brookside Rehabilitation Center.

Is Brookside Rehabilitation Center Medicare or Medicaid certified?

Yes — Brookside Rehabilitation Center is a CMS-certified provider of Medicare and Medicaid.

Guides for Better Senior Living

Care Cost Calculator: See Prices in Your Area

Nursing Home Data Explorer

Don’t Wait Too Long: 7 Red Flag Signs Your Parent Needs Assisted Living Now

The True Cost of Assisted Living in 2025 – And How Families Are Paying For It

Understanding Senior Living Costs: Pricing Models, Discounts & Financial Assistance