


Total health inspections
17
State average 12.5
Last Health inspection on Sep 2025
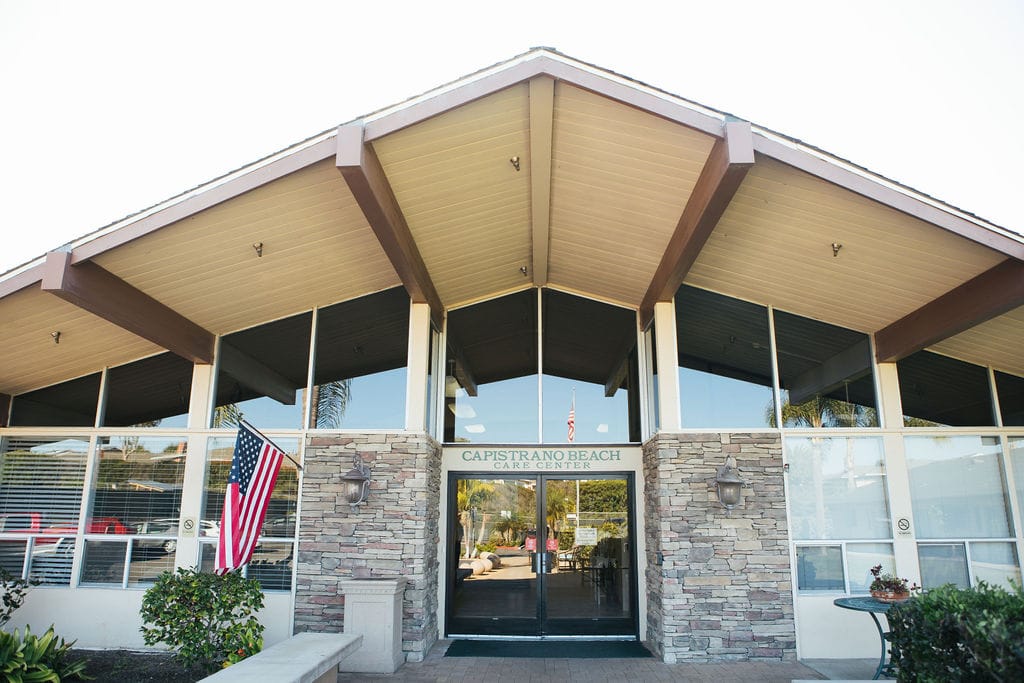
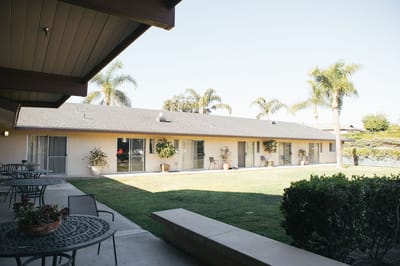
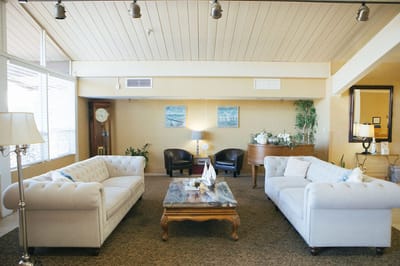
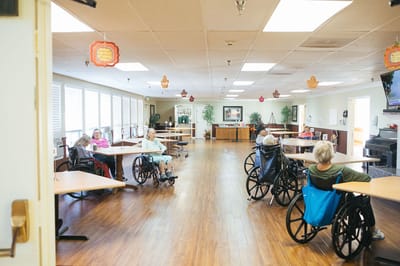
A distinct senior living community settled in the harmonious neighborhood of Del Rey, Capistrano Beach, CA, Capistrano Beach Care Center provides long-term care and short-term rehabilitation. With seniors’ comfort and wellness in mind, the community features 93 comfortable and warm accommodations. Keep peace of mind with a team of compassionate and specially trained professionals taking care of your needs and aspirations.
As a Medicare and Medicaid-certified community, Capistrano Beach Care Center strives to ease financial constraints so that seniors can enjoy a better quality of life. Moreover, the community is conveniently located near hospitals, ensuring easy access to medical needs whenever necessary. Capistrano Beach Care Center ensures residents retain their independence while providing the right care and assistance.
Staffing hours
![]() Daily nursing hours per resident by staff type, reported to CMS. Higher is generally better — compare this facility to state and national averages to see where staffing stands.
Daily nursing hours per resident by staff type, reported to CMS. Higher is generally better — compare this facility to state and national averages to see where staffing stands.
Hours per resident per day vs California averages
Total nursing care
![]() This home is ranked 281st out of 289 homes in California for nurse hours. Total adjusted nursing hours per resident per day, combining RN, LPN, and aide time. CMS adjusts this for case-mix so facilities can be fairly compared.
This home is ranked 281st out of 289 homes in California for nurse hours. Total adjusted nursing hours per resident per day, combining RN, LPN, and aide time. CMS adjusts this for case-mix so facilities can be fairly compared.
3h 8m
26% below state avg4 of 6 metrics below state avg
In California, the Department of Social Services (for assisted living facilities) and the Department of Public Health (for nursing homes) conduct inspections to ensure resident safety and regulatory compliance.
12 points below the California average for nursing homes (81/100)
Rank #1151 / 1475 in California Inspection Score — State benchmarked This home is ranked 1151st out of 1475 homes in California for inspection score. Shows this facility's inspection score compared to the California average among 1475 comparable communities in the ranking pool. Facilities with the same value for a metric share the same rank. Rankings are based only on facilities in California that report data for that category. Facilities without available data are excluded from the ranking. This is a proprietary Assisted Living Magazine score. Inspection score: 69 out of 100. Letter grade D+. 12 points below the California average for nursing homes (81/100)
Citations
| This Facility | CA Average | vs. CA Avg |
|---|---|---|---|
|
Total citations
| 175 | 10 | This facility has 1650% more total citations than a typical California nursing home (175 vs. CA avg 10).↑ 1650% worse |
|
Citations per inspection
| 10.3 | 3.3 | This facility has 212% more citations per inspection than a typical California nursing home (10.3 vs. CA avg 3.3).↑ 212% worse |
Inspections & Visits
| This Facility | CA Average | vs. CA Avg |
|---|---|---|---|
|
Total inspections
| 12 | 16 | This facility has had 25% fewer total inspections than the California average (12 vs. CA avg 16). More inspections can mean more regulatory scrutiny rather than worse care.↓ 25% fewer |
|
Complaint visits
| 12 | 13 | This facility has had 8% fewer complaint visits than the California average (12 vs. CA avg 13). More inspections can mean more regulatory scrutiny rather than worse care.↓ 8% fewer |
|
Other visits
| 0 | 7 | This facility has had 100% fewer other visits than the California average (0 vs. CA avg 7). More inspections can mean more regulatory scrutiny rather than worse care.↓ 100% fewer |
State average 12.5
Last Health inspection on Sep 2025
State average 50.2
State average 4.65
Health citations are formal notices following inspections when they fail to comply with safety and care standards.
51 of 73 citations resulted from standard inspections; and 22 of 73 resulted from complaint investigations.
State average: 0.4
State average: 1
Reporting period: October 1 – December 31, 2025 (Q4 2025). Source: CMS Payroll-Based Journal report.
Manages medical care and health needs.
Assists with medical care and medications.
Helps with daily care and mobility.
Total hours from contractors
1,941 contractor hours this quarter
| Certified Nursing Assistant | 53 | 24 | 77 | 17,200 | 92 | 100% | 7.1 |
| Licensed Practical Nurse | 34 | 0 | 34 | 7,736 | 92 | 100% | 7 |
| Other Dietary Services Staff | 14 | 0 | 14 | 4,873 | 92 | 100% | 7.8 |
| RN Director of Nursing | 3 | 0 | 3 | 1,583 | 66 | 72% | 8.5 |
| Physical Therapy Aide | 5 | 0 | 5 | 1,405 | 85 | 92% | 7.7 |
| Speech Language Pathologist | 5 | 0 | 5 | 1,279 | 86 | 93% | 7.5 |
| Occupational Therapy Aide | 4 | 0 | 4 | 1,136 | 80 | 87% | 7.7 |
| Registered Nurse | 5 | 0 | 5 | 1,085 | 90 | 98% | 6.6 |
| Qualified Activities Professional | 0 | 7 | 7 | 1,056 | 91 | 99% | 11.4 |
| Dental Services Staff | 3 | 0 | 3 | 1,023 | 64 | 70% | 7.9 |
| Clinical Nurse Specialist | 2 | 0 | 2 | 939 | 76 | 83% | 8.3 |
| Respiratory Therapy Technician | 4 | 0 | 4 | 726 | 77 | 84% | 7.5 |
| Qualified Social Worker | 2 | 0 | 2 | 686 | 67 | 73% | 6.9 |
| Physical Therapy Assistant | 4 | 0 | 4 | 569 | 76 | 83% | 6.6 |
| Nurse Practitioner | 1 | 0 | 1 | 512 | 64 | 70% | 8 |
| Administrator | 1 | 0 | 1 | 496 | 62 | 67% | 8 |
| Occupational Therapist | 1 | 0 | 1 | 270 | 39 | 42% | 6.9 |
| Occupational Therapy Assistant | 0 | 1 | 1 | 39 | 6 | 7% | 6.5 |
| Medical Director | 0 | 1 | 1 | 36 | 13 | 14% | 2.8 |
Federal penalties imposed by CMS for regulatory violations, including civil money penalties (fines) and denials of payment for new Medicare/Medicaid admissions.
Source: CMS Penalties Database
No penalties in the past 3 years
No civil money penalties or payment denials were reported in the last 3 years.
These measures show how residents usually do over time at this home, based on health outcomes and preventive care.
California average: 6.6
California average: 11.3
California average: 11.1%
California average: 12.0%
California average: 11.3%
California average: 1.7%
California average: 5.0%
California average: 1.2%
California average: 4.2%
California average: 6.7%
California average: 10.1%
California average: 98.5%
California average: 98.2%
California average: 2.25
California average: 1.59
California average: 94.0%
California average: 1.5%
California average: 93.2%
California average: 23.2%
California average: 11.2%
California average: 0.8%
California average: 53.7%
California average: 50.6%
Quality measures are calculated from Minimum Data Set (MDS) assessments. For most measures, lower percentages indicate better care quality.
30% of new residents, usually for short-term rehab.
69% of new residents, often for short stays.
1% of new residents, often for long-term daily care.
Source: CMS Long-Term Care Facility Characteristics (Data as of Jan 2026)
Residents meet regularly to discuss policies, care quality, and activities
State-approved Nurse Aide Training and Competency Evaluation Program on-site
Organized group of residents that meets regularly to discuss facility policies, quality of life, and activities.
Data sourced from CMS Long-Term Care Facility Characteristics quarterly report. Payer mix reflects the current resident census by primary payment source.
Historical financial and operational data for Capistrano Beach Care Center from 2011–2022, based on CMS SNF Cost Reports.
Key figures below are for fiscal year ending in 06/2022 — the home's most recent complete cost report, an older period than most facilities report.
Based on the home's most recent complete CMS SNF Cost Report — fiscal year ending in 06/2022. This is an older period than most facilities report, so compare with that in mind.
No pets allowed
Building Type: Single-story
Residents typically stay for brief periods, with frequent admissions and discharges throughout the year.
Most new residents arrive under private pay (69% of admissions), and a typical private pay stay runs around 29 days.
Coverage residents most often arrive under.
Coverage residents most often leave under.
![]() 3.9 miles from city center
3.9 miles from city center
![]() Estimated distance in miles from Dana Point's city center to Capistrano Beach Care Center's address, calculated via Google Maps.
— 6.31 miles to nearest hospital (Providence Mission Hospital Laguna Beach)
Estimated distance in miles from Dana Point's city center to Capistrano Beach Care Center's address, calculated via Google Maps.
— 6.31 miles to nearest hospital (Providence Mission Hospital Laguna Beach)
Add your location
Info below is compiled from CMS reports & the CA Dept. of Social Services (CDSS), senior community websites & trusted data sources such as Walk Score & BBB.
Communities are listed from highest to lowest based on our ranking methodology.
| Harrison Villa of Mt. San Antonio Gardens | NH AL IL MC SNF | Pomona | 520
Facility
520
CA AVG
104
Rank
#16 / 1646 |
84.0%
Facility
84.0%
CA AVG
73.9
Rank
#483 / 1492 | +14% | 6.62
Facility
6.62
CA AVG
4.22
Rank
#4 / 289 | +3% | +57% | $0
Facility
$0
CA AVG
$56.5k
Rank
#1 / 294 | 94
Facility
94
CA AVG
81
Rank
#212 / 1475 | 16
Facility
16
CA AVG
50.2
Rank
#21 / 291 | 5.3
Facility
5.3
CA AVG
4.6
Rank
#217 / 291 | - | 437 | - | 45 | Congregational Homes | $5.9MFiscal year ending 09/2023
Facility
$5.9MFiscal year ending 09/2023
CA AVG
$15.7M
Rank
#250 / 260 | $18.0MFiscal year ending 09/2023
Facility
$18.0MFiscal year ending 09/2023
CA AVG
$8.9M
Rank
#11 / 260 | 306%Fiscal year ending 09/2023
Facility
306%Fiscal year ending 09/2023
CA AVG
61.1%
Rank
#2 / 260 | 55016 | ||||
| Carlsbad By The Sea Care Center | NH SNF | Carlsbad (Carlsbad Village) | 224
Facility
224
CA AVG
104
Rank
#116 / 1646 |
84.8%
Facility
84.8%
CA AVG
73.9
Rank
#460 / 1492 | +15% | 5.00
Facility
5.00
CA AVG
4.22
Rank
#34 / 289 | 0% | +18% | $0
Facility
$0
CA AVG
$56.5k
Rank
#1 / 294 | 94
Facility
94
CA AVG
81
Rank
#212 / 1475 | 12
Facility
12
CA AVG
50.2
Rank
#9 / 291 | 4.0
Facility
4.0
CA AVG
4.6
Rank
#141 / 291 | - | 190 | A+ |
96
Facility
96
CA AVG
59
Rank
#43 / 2058 | Paula Digerness | $6.3MFiscal year ending 03/2024
Facility
$6.3MFiscal year ending 03/2024
CA AVG
$15.7M
Rank
#246 / 260 | $8.0MFiscal year ending 03/2024
Facility
$8.0MFiscal year ending 03/2024
CA AVG
$8.9M
Rank
#138 / 260 | 128.1%Fiscal year ending 03/2024
Facility
128.1%Fiscal year ending 03/2024
CA AVG
61.1%
Rank
#7 / 260 | 56496 | ||||
| Vi at La Jolla Village | NH AL IL MC SNF | San Diego (University City) | 783
Facility
783
CA AVG
104
Rank
#5 / 1646 |
69.3%
Facility
69.3%
CA AVG
73.9
Rank
#947 / 1492 | -6% | 5.26
Facility
5.26
CA AVG
4.22
Rank
#19 / 289 | +43% | +25% | $0
Facility
$0
CA AVG
$56.5k
Rank
#1 / 294 | 84
Facility
84
CA AVG
81
Rank
#732 / 1475 | 15
Facility
15
CA AVG
50.2
Rank
#19 / 291 | 2.1
Facility
2.1
CA AVG
4.6
Rank
#8 / 291 | - | 543 | - |
88
Facility
88
CA AVG
59
Rank
#218 / 2058 | Cc-La Jolla, Inc | $10.6MFiscal year ending 12/2023
Facility
$10.6MFiscal year ending 12/2023
CA AVG
$15.7M
Rank
#188 / 260 | $9.6MFiscal year ending 12/2023
Facility
$9.6MFiscal year ending 12/2023
CA AVG
$8.9M
Rank
#91 / 260 | 91.3%Fiscal year ending 12/2023
Facility
91.3%Fiscal year ending 12/2023
CA AVG
61.1%
Rank
#18 / 260 | 555793 | ||||
| Vi at Palo Alto | NH AL IL MC SNF | Palo Alto | 876
Facility
876
CA AVG
104
Rank
#1 / 1646 |
73.1%
Facility
73.1%
CA AVG
73.9
Rank
#851 / 1492 | -1% | 5.11
Facility
5.11
CA AVG
4.22
Rank
#30 / 289 | +28% | +21% | $0
Facility
$0
CA AVG
$56.5k
Rank
#1 / 294 | 90
Facility
90
CA AVG
81
Rank
#461 / 1475 | 18
Facility
18
CA AVG
50.2
Rank
#28 / 291 | 3.0
Facility
3.0
CA AVG
4.6
Rank
#54 / 291 | 1 | 640 | - |
80
Facility
80
CA AVG
59
Rank
#416 / 2058 | Cary Maslow | $15.0MFiscal year ending 12/2023
Facility
$15.0MFiscal year ending 12/2023
CA AVG
$15.7M
Rank
#117 / 260 | $10.6MFiscal year ending 12/2023
Facility
$10.6MFiscal year ending 12/2023
CA AVG
$8.9M
Rank
#73 / 260 | 70.6%Fiscal year ending 12/2023
Facility
70.6%Fiscal year ending 12/2023
CA AVG
61.1%
Rank
#32 / 260 | 555835 | ||||
| Capistrano Beach Care Center | NH SNF | Dana Point (Capistrano Beach) | 93
Facility
93
CA AVG
104
Rank
#828 / 1646 |
81.6%
Facility
81.6%
CA AVG
73.9
Rank
#637 / 1492 | +10% | 3.14
Facility
3.14
CA AVG
4.22
Rank
#281 / 289 | -67% | -26% | $0
Facility
$0
CA AVG
$56.5k
Rank
#1 / 294 | 69
Facility
69
CA AVG
81
Rank
#1151 / 1475 | 73
Facility
73
CA AVG
50.2
Rank
#244 / 291 | 4.3
Facility
4.3
CA AVG
4.6
Rank
#164 / 291 | - | 76 | A+ |
25
Facility
25
CA AVG
59
Rank
#1781 / 2058 | Cbh Ops, LLC | $10.9M*Fiscal year ending 06/2022These figures are from this home's most recent complete cost report — an older period than most facilities report. Compare with that in mind. | $5.6M*Fiscal year ending 06/2022These figures are from this home's most recent complete cost report — an older period than most facilities report. Compare with that in mind. | 51.7%*Fiscal year ending 06/2022These figures are from this home's most recent complete cost report — an older period than most facilities report. Compare with that in mind. | 55585 |
Capistrano Beach Care Center is in the Capistrano Beach neighborhood of Dana Point.
Capistrano Beach Care Center has a walk score of 25. Somewhat walkable. A few nearby services may be reachable on foot, but most trips require transportation.
Capistrano Beach Care Center's occupancy is 89.4%.
No, Capistrano Beach Care Center has a no-pet policy.
Capistrano Beach Care Center is registered as a for-profit in CA.
Capistrano Beach Care Center has had 175 reported citations since 2021 according to records from California Department of Social Services (CDSS).
Yes — there are 4 photos of Capistrano Beach Care Center in the photo gallery on this page.
Care Cost Calculator: See Prices in Your Area
Nursing Home Data Explorer
Don’t Wait Too Long: 7 Red Flag Signs Your Parent Needs Assisted Living Now
The True Cost of Assisted Living in 2025 – And How Families Are Paying For It
Understanding Senior Living Costs: Pricing Models, Discounts & Financial Assistance


