


Total staff
112
Employees
96
Contractors
16
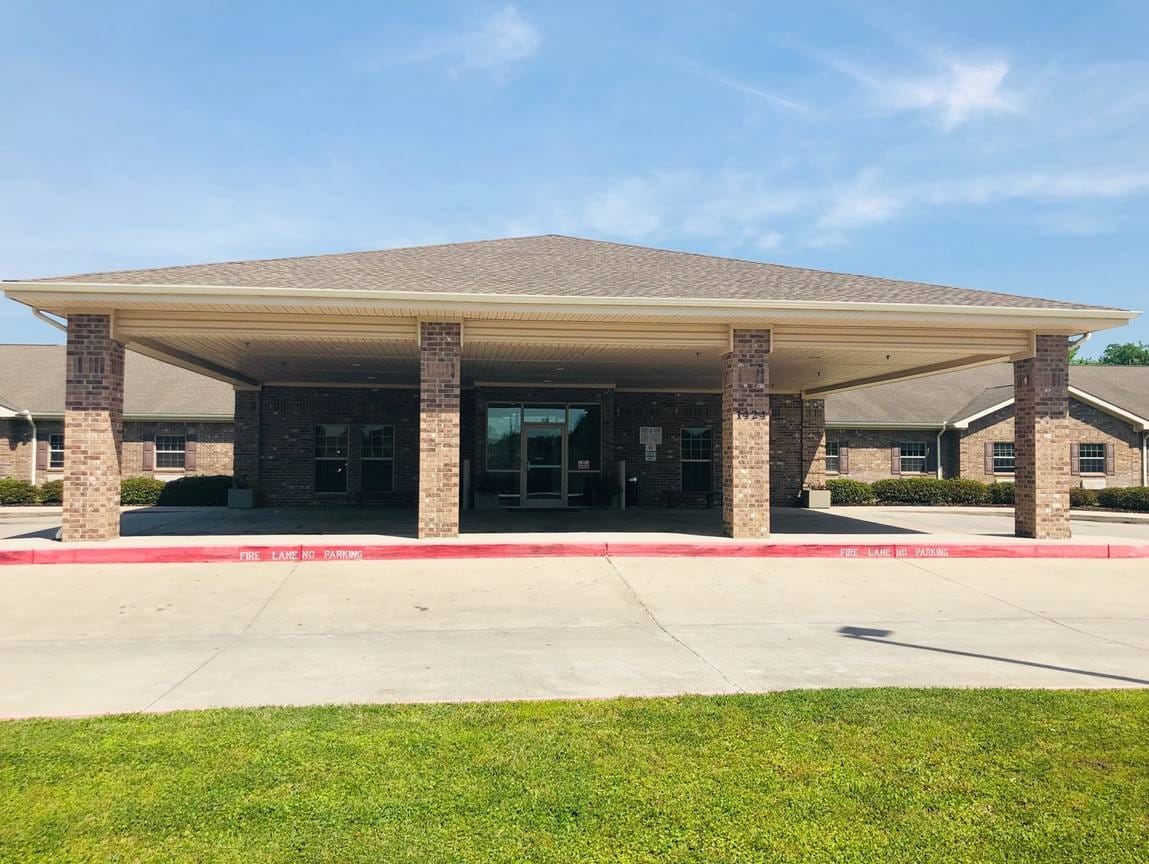
Residing in the serene residential grounds of Fallbrook Drive, Houston, TX, is the outstanding senior living community of Capstone Healthcare Estates at Veterans Memorial that offers memory care, rehabilitation, and skilled nursing. The community also features a wide array of care services including respite, hospice, diabetes care, respiratory, pneumonia care, and cardiac care, among others. A team of competent and highly qualified professionals delivers the highest quality of care and assistance around the clock to meet seniors’ needs and aspirations.
Utilizing a holistic approach to care, the community ensures residents are well-cared for in every aspect. With carefully curated enjoyable activities and enriching programs, residents are encouraged to mingle with friends and maintain an active lifestyle for better cognition and a well-connected lifestyle. Capstone Healthcare at Veterans is a good place to find exceptional care dedicated to enhancing seniors’ quality of life.
| Staff type | Hours / Day / Resident | vs state avg |
|---|---|---|
|
Registered Nurse (RN)
| 26m per day | ■ Avg State avg: 26m per day · National avg: 41m per day |
|
LPN / LVN
| 48m per day | ▼ 16% State avg: 57m per day · National avg: 52m per day |
|
Nurse Aide
| 1h 53m per day | ▼ 7% State avg: 2h 1m per day · National avg: 2h 21m per day |
|
Weekend Total Nursing
| 2h 51m per day | ▼ 4% State avg: 2h 59m per day · National avg: 3h 26m per day |
|
Physical Therapist
| 1m per day | ▼ 66% State avg: 4m per day · National avg: 4m per day |
|
Weekend RN
| 18m per day | ▼ 13% State avg: 21m per day · National avg: 29m per day |
Reporting period: October 1 – December 31, 2025 (Q4 2025). Source: CMS Payroll-Based Journal report.
Manages medical care and health needs.
Assists with medical care and medications.
Helps with daily care and mobility.
Total hours from contractors
3,232 contractor hours this quarter
| Certified Nursing Assistant | 52 | 0 | 52 | 14,450 | 92 | 100% | 7.9 |
| Licensed Practical Nurse | 15 | 0 | 15 | 6,675 | 92 | 100% | 10.1 |
| Registered Nurse | 10 | 0 | 10 | 2,708 | 92 | 100% | 8 |
| Medication Aide/Technician | 11 | 0 | 11 | 2,454 | 92 | 100% | 8.4 |
| Speech Language Pathologist | 0 | 5 | 5 | 1,229 | 69 | 75% | 7.4 |
| Physical Therapy Aide | 0 | 6 | 6 | 703 | 68 | 74% | 7.2 |
| Clinical Nurse Specialist | 2 | 0 | 2 | 684 | 70 | 76% | 6.4 |
| Other Dietary Services Staff | 1 | 0 | 1 | 567 | 67 | 73% | 8.5 |
| Qualified Social Worker | 0 | 2 | 2 | 552 | 67 | 73% | 8.2 |
| Physical Therapy Assistant | 0 | 1 | 1 | 545 | 65 | 71% | 8.4 |
| RN Director of Nursing | 1 | 0 | 1 | 512 | 64 | 70% | 8 |
| Mental Health Service Worker | 1 | 0 | 1 | 504 | 63 | 68% | 8 |
| Administrator | 1 | 0 | 1 | 480 | 60 | 65% | 8 |
| Dietitian | 1 | 0 | 1 | 480 | 60 | 65% | 8 |
| Nurse Practitioner | 1 | 0 | 1 | 478 | 61 | 66% | 7.8 |
| Respiratory Therapy Technician | 0 | 2 | 2 | 204 | 37 | 40% | 5.5 |
Federal penalties imposed by CMS for regulatory violations, including civil money penalties (fines) and denials of payment for new Medicare/Medicaid admissions.
Source: CMS Penalties Database
No penalties in the past 3 years
No civil money penalties or payment denials were reported in the last 3 years.
These measures show how residents usually do over time at this home, based on health outcomes and preventive care.
Texas average: 8.6
Texas average: 16.0
Texas average: 16.2%
Texas average: 16.2%
Texas average: 15.7%
Texas average: 3.2%
Texas average: 4.4%
Texas average: 0.8%
Texas average: 3.5%
Texas average: 2.9%
Texas average: 7.9%
Texas average: 97.3%
Texas average: 97.9%
Texas average: 2.13
Texas average: 2.07
Texas average: 90.4%
Texas average: 1.4%
Texas average: 88.0%
Texas average: 25.9%
Texas average: 12.0%
Texas average: 0.8%
Texas average: 53.7%
Texas average: 50.6%
Quality measures are calculated from Minimum Data Set (MDS) assessments. For most measures, lower percentages indicate better care quality.
27% of new residents, usually for short-term rehab.
46% of new residents, often for short stays.
26% of new residents, often for long-term daily care.
Source: CMS Long-Term Care Facility Characteristics (Data as of Jan 2026)
Residents meet regularly to discuss policies, care quality, and activities
Organized group of residents that meets regularly to discuss facility policies, quality of life, and activities.
Data sourced from CMS Long-Term Care Facility Characteristics quarterly report. Payer mix reflects the current resident census by primary payment source.
Historical financial and operational data for Capstone Healthcare Estates at Veterans Memorial from 2011–2023, based on CMS SNF Cost Reports.
Key figures below are for fiscal year ending in 12/2023.
Based on CMS SNF Cost Report for fiscal year ending in 12/2023.
No pets allowed
Building Type: Single-story
Most residents stay for extended periods and receive ongoing daily care.
New residents most often arrive under private pay (46% of admissions), and a typical private pay stay runs around 1 - 2 months.
Coverage residents most often arrive under.
Coverage residents most often leave under.
![]() 1424 Fallbrook Dr, Houston, TX 77038 — 6.86 miles to nearest hospital (HCA Houston Healthcare Northwest)
1424 Fallbrook Dr, Houston, TX 77038 — 6.86 miles to nearest hospital (HCA Houston Healthcare Northwest)
Add your location
Info below is compiled from CMS reports & the TX Health & Human Services Commission (HHSC), senior community websites & trusted data sources such as Walk Score & BBB.
Communities are listed from highest to lowest based on our ranking methodology.
| Park Manor of CyFair | NH SNF | Houston (White Oak Bend) | 120
Facility
120
TX AVG
79
Rank
#204 / 972 |
89.2%
Facility
89.2%
TX AVG
67.3
Rank
#33 / 195 | +32% | 3.27
Facility
3.27
TX AVG
3.63
Rank
#158 / 239 | +82% | -10% | $0
Facility
$0
TX AVG
$81.8k
Rank
#1 / 244 | 7
Facility
7
TX AVG
25.9
Rank
#11 / 241 | 2.3
Facility
2.3
TX AVG
3.7
Rank
#39 / 241 | - | 107 | - |
55
Facility
55
TX AVG
41
Rank
#385 / 1389 | Hmg Park Manor Of Cyfair, L.l.c | $9.7MFiscal year ending 08/2024
Facility
$9.7MFiscal year ending 08/2024
TX AVG
$8.4M
Rank
#127 / 245 | $4.4MFiscal year ending 08/2024
Facility
$4.4MFiscal year ending 08/2024
TX AVG
$3.5M
Rank
#129 / 245 | 45.1%Fiscal year ending 08/2024
Facility
45.1%Fiscal year ending 08/2024
TX AVG
47%
Rank
#120 / 245 | 675818 | ||||
| Houston Transitional Care | NH HOS MC PC RC SNF | Houston (Braeburn) | 70
Facility
70
TX AVG
79
Rank
#503 / 972 |
96.0%
Facility
96.0%
TX AVG
67.3
Rank
#4 / 195 | +43% | 3.17
Facility
3.17
TX AVG
3.63
Rank
#181 / 239 | +22% | -13% | $0
Facility
$0
TX AVG
$81.8k
Rank
#1 / 244 | 16
Facility
16
TX AVG
25.9
Rank
#62 / 241 | 5.3
Facility
5.3
TX AVG
3.7
Rank
#222 / 241 | - | 67 | - |
75
Facility
75
TX AVG
41
Rank
#67 / 1389 | Ahmad El-Saadi | $12.3MFiscal year ending 12/2023
Facility
$12.3MFiscal year ending 12/2023
TX AVG
$8.4M
Rank
#30 / 245 | $5.1MFiscal year ending 12/2023
Facility
$5.1MFiscal year ending 12/2023
TX AVG
$3.5M
Rank
#116 / 245 | 41.4%Fiscal year ending 12/2023
Facility
41.4%Fiscal year ending 12/2023
TX AVG
47%
Rank
#240 / 245 | 676435 | ||||
| Caraday of Houston | NH MC RC SNF | Houston (Northside / Northline) | 150
Facility
150
TX AVG
79
Rank
#63 / 972 | - | - | 3.76
Facility
3.76
TX AVG
3.63
Rank
#77 / 239 | -32% | +4% | $0
Facility
$0
TX AVG
$81.8k
Rank
#1 / 244 | 15
Facility
15
TX AVG
25.9
Rank
#55 / 241 | 3.8
Facility
3.8
TX AVG
3.7
Rank
#167 / 241 | - | 12 | - |
41
Facility
41
TX AVG
41
Rank
#707 / 1389 | E&R Cunningham Investments, LP | $2.7MFiscal year ending 12/2023
Facility
$2.7MFiscal year ending 12/2023
TX AVG
$8.4M
Rank
#244 / 245 | $1.8MFiscal year ending 12/2023
Facility
$1.8MFiscal year ending 12/2023
TX AVG
$3.5M
Rank
#241 / 245 | 66.5%Fiscal year ending 12/2023
Facility
66.5%Fiscal year ending 12/2023
TX AVG
47%
Rank
#82 / 245 | 676470 | ||||
| Brazos Tower at Bayou Manor | NH AL IL MC SNF | Houston (Braeswood) | 33
Facility
33
TX AVG
79
Rank
#757 / 972 | - | - | 5.78
Facility
5.78
TX AVG
3.63
Rank
#5 / 239 | -37% | +59% | $46.6k
Facility
$46.6k
TX AVG
$81.8k
Rank
#169 / 244 | 5
Facility
5
TX AVG
25.9
Rank
#6 / 241 | 1.7
Facility
1.7
TX AVG
3.7
Rank
#8 / 241 | - | 28 | - |
64
Facility
64
TX AVG
41
Rank
#209 / 1389 | Sharon Darden | $4.7MFiscal year ending 12/2023
Facility
$4.7MFiscal year ending 12/2023
TX AVG
$8.4M
Rank
#25 / 245 | $7.0MFiscal year ending 12/2023
Facility
$7.0MFiscal year ending 12/2023
TX AVG
$3.5M
Rank
#49 / 245 | 151%Fiscal year ending 12/2023
Facility
151%Fiscal year ending 12/2023
TX AVG
47%
Rank
#233 / 245 | 676282 | ||||
| Capstone Healthcare Estates at Veterans Memorial | NH AL IL MC | Houston (Fallbrook) | 120
Facility
120
TX AVG
79
Rank
#204 / 972 |
81.3%
Facility
81.3%
TX AVG
67.3
Rank
#59 / 195 | +21% | 3.63
Facility
3.63
TX AVG
3.63
Rank
#108 / 239 | +16% | 0% | $21.6k
Facility
$21.6k
TX AVG
$81.8k
Rank
#115 / 244 | 19
Facility
19
TX AVG
25.9
Rank
#102 / 241 | 2.1
Facility
2.1
TX AVG
3.7
Rank
#31 / 241 | 2 | 98 | - |
51
Facility
51
TX AVG
41
Rank
#481 / 1389 | Capstone Vm Opco LLC | $10.2MFiscal year ending 12/2023
Facility
$10.2MFiscal year ending 12/2023
TX AVG
$8.4M
Rank
#109 / 245 | $4.4MFiscal year ending 12/2023
Facility
$4.4MFiscal year ending 12/2023
TX AVG
$3.5M
Rank
#115 / 245 | 42.9%Fiscal year ending 12/2023
Facility
42.9%Fiscal year ending 12/2023
TX AVG
47%
Rank
#137 / 245 | 676252 |
Capstone Healthcare Estates at Veterans Memorial is located in Houston, Texas.
Here are the financial assistance programs available to residents in Texas.
Capstone Healthcare Estates at Veterans Memorial is in the Fallbrook neighborhood.
Capstone Healthcare Estates at Veterans Memorial has a walk score of 51. Moderately walkable. Some errands can be accomplished on foot, with a mix of nearby amenities.
Capstone Healthcare Estates at Veterans Memorial's occupancy is 84.2%.
No, Capstone Healthcare Estates at Veterans Memorial has a no-pet policy.
Capstone Healthcare Estates at Veterans Memorial is registered as a for-profit.
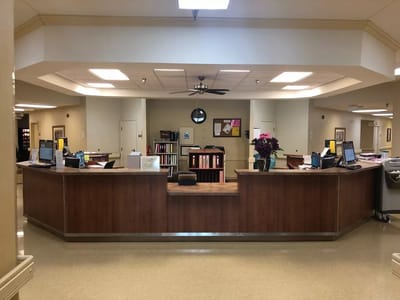
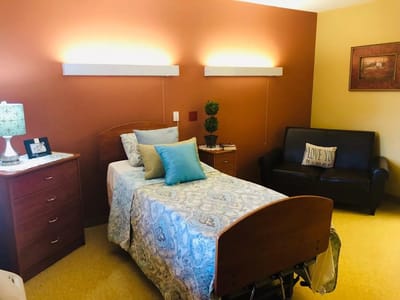
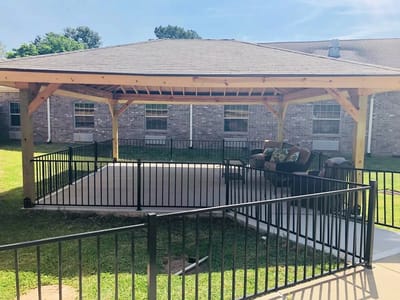
Yes — there are 4 photos of Capstone Healthcare Estates at Veterans Memorial in the photo gallery on this page.
Capstone Healthcare Estates at Veterans Memorial is located at 1424 Fallbrook Dr, Houston, TX 77038.
Care Cost Calculator: See Prices in Your Area
Nursing Home Data Explorer
Don’t Wait Too Long: 7 Red Flag Signs Your Parent Needs Assisted Living Now
The True Cost of Assisted Living in 2025 – And How Families Are Paying For It
Understanding Senior Living Costs: Pricing Models, Discounts & Financial Assistance


