


Total staff
122
Employees
113
Contractors
9
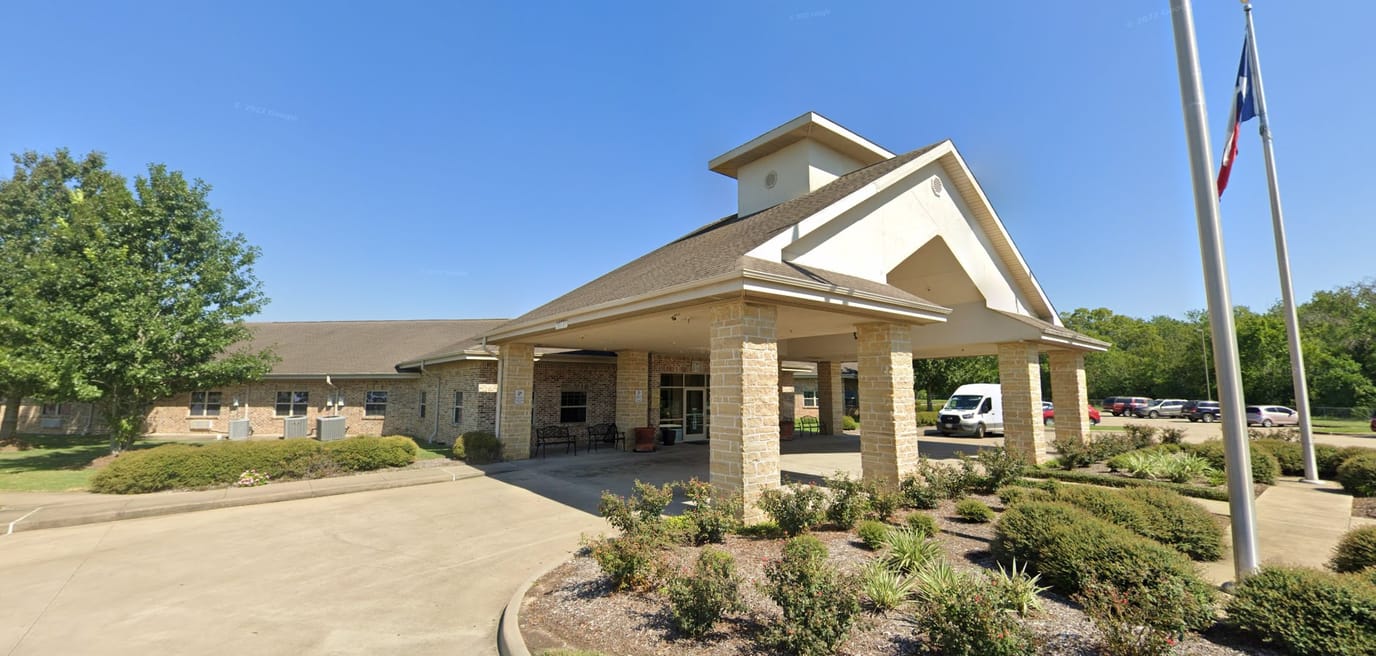
A 120-bed nursing home at 3730 West Orem Drive in Houston, Texas, is Capstone Healthcare Estates on Orem. It’s positioned in a somewhat walkable neighborhood (Walk Score of 55), where some errands can be done on foot alongside nearby amenities. It’s then accessible for occupants and visiting families.
As a nursing home, the facility is equipped to provide skilled nursing care for older adults requiring active medical support. Medicare, Medicaid, and private pay are accepted to provide flexibility for families managing coverage options. The average stay duration is around 116 days, a timeframe typical of residents in skilled nursing transition, some healing from hospitalization or surgery, others adjusting to longer-term care arrangements. Meanwhile, nursing support is a core element of daily operations. The facility provides approximately 3 hours 41 minutes of total nursing care per resident day, including contributions from registered nurses, licensed practical nurses, and nurse aides. This level of staffing enables the 24/7 clinical attention that skilled nursing settings are tailored to provide.
| Staff type | Hours / Day / Resident | vs state avg |
|---|---|---|
|
Registered Nurse (RN)
| 27m per day | ▲ 4% State avg: 26m per day · National avg: 41m per day |
|
LPN / LVN
| 57m per day | ■ Avg State avg: 57m per day · National avg: 52m per day |
|
Nurse Aide
| 2h 8m per day | ▲ 6% State avg: 2h 1m per day · National avg: 2h 21m per day |
|
Weekend Total Nursing
| 3h 17m per day | ▲ 10% State avg: 2h 59m per day · National avg: 3h 26m per day |
|
Physical Therapist
| 3m per day | ▼ 24% State avg: 4m per day · National avg: 4m per day |
|
Weekend RN
| 20m per day | ▼ 4% State avg: 21m per day · National avg: 29m per day |
Reporting period: October 1 – December 31, 2025 (Q4 2025). Source: CMS Payroll-Based Journal report.
Manages medical care and health needs.
Assists with medical care and medications.
Helps with daily care and mobility.
Total hours from contractors
2,704 contractor hours this quarter
| Certified Nursing Assistant | 62 | 0 | 62 | 14,490 | 92 | 100% | 7.7 |
| Licensed Practical Nurse | 27 | 0 | 27 | 7,326 | 92 | 100% | 9.6 |
| Medication Aide/Technician | 9 | 0 | 9 | 3,164 | 92 | 100% | 8.3 |
| Registered Nurse | 7 | 0 | 7 | 2,598 | 92 | 100% | 9.4 |
| Qualified Social Worker | 0 | 2 | 2 | 708 | 69 | 75% | 6.5 |
| Clinical Nurse Specialist | 2 | 0 | 2 | 632 | 62 | 67% | 7.2 |
| Speech Language Pathologist | 0 | 3 | 3 | 543 | 68 | 74% | 7.8 |
| Physical Therapy Aide | 0 | 1 | 1 | 523 | 67 | 73% | 7.8 |
| Physical Therapy Assistant | 0 | 1 | 1 | 508 | 64 | 70% | 7.9 |
| RN Director of Nursing | 1 | 0 | 1 | 504 | 63 | 68% | 8 |
| Administrator | 1 | 0 | 1 | 488 | 61 | 66% | 8 |
| Nurse Practitioner | 1 | 0 | 1 | 488 | 61 | 66% | 8 |
| Dietitian | 1 | 0 | 1 | 488 | 61 | 66% | 8 |
| Mental Health Service Worker | 1 | 0 | 1 | 476 | 61 | 66% | 7.8 |
| Respiratory Therapy Technician | 0 | 2 | 2 | 422 | 57 | 62% | 7.4 |
| Other Dietary Services Staff | 1 | 0 | 1 | 395 | 58 | 63% | 6.8 |
Includes penalties issued in 2024
Federal penalties imposed by CMS for regulatory violations, including civil money penalties (fines) and denials of payment for new Medicare/Medicaid admissions.
Source: CMS Penalties Database (Data as of Jan 2026)
Texas average: $80K
Texas average: 2.5
Texas average: 0.2
Penalties are imposed by CMS for violations of federal nursing home regulations.
1 penalty in the past 3 years
Feb 17, 2024 · $34K
Last updated: Jan 2026
These measures show how residents usually do over time at this home, based on health outcomes and preventive care.
Texas average: 8.6
Texas average: 16.0
Texas average: 16.2%
Texas average: 16.2%
Texas average: 15.7%
Texas average: 3.2%
Texas average: 4.4%
Texas average: 0.8%
Texas average: 3.5%
Texas average: 2.9%
Texas average: 7.9%
Texas average: 97.3%
Texas average: 97.9%
Texas average: 90.4%
Texas average: 1.4%
Texas average: 88.0%
Texas average: 25.9%
Texas average: 12.0%
Texas average: 0.8%
Texas average: 50.6%
Quality measures are calculated from Minimum Data Set (MDS) assessments. For most measures, lower percentages indicate better care quality.
16% of new residents, usually for short-term rehab.
44% of new residents, often for short stays.
40% of new residents, often for long-term daily care.
Source: CMS Long-Term Care Facility Characteristics (Data as of Jan 2026)
Residents meet regularly to discuss policies, care quality, and activities
Organized group of residents that meets regularly to discuss facility policies, quality of life, and activities.
Data sourced from CMS Long-Term Care Facility Characteristics quarterly report. Payer mix reflects the current resident census by primary payment source.
Historical financial and operational data for Capstone Healthcare Estates on Orem from 2013–2023, based on CMS SNF Cost Reports.
Key figures below are for fiscal year ending in 12/2023.
Based on CMS SNF Cost Report for fiscal year ending in 12/2023.
This home supports both short-term rehab and long-term care, with residents staying for a wide range of durations.
New residents most often arrive under private pay (44% of admissions), and a typical private pay stay runs around 25 days.
Coverage residents most often arrive under.
Coverage residents most often leave under.
![]() 9.8 miles from city center
9.8 miles from city center
![]() Estimated distance in miles from Houston's city center to Capstone Healthcare Estates on Orem's address, calculated via Google Maps.
Estimated distance in miles from Houston's city center to Capstone Healthcare Estates on Orem's address, calculated via Google Maps.
Add your location
Info below is compiled from CMS reports & the TX Health & Human Services Commission (HHSC), senior community websites & trusted data sources such as Walk Score & BBB.
Communities are listed from highest to lowest based on our ranking methodology.
| Park Manor of CyFair | NH SNF | Houston (White Oak Bend) | 120
Facility
120
TX AVG
79
Rank
#204 / 972 |
89.2%
Facility
89.2%
TX AVG
67.3
Rank
#33 / 195 | +32% | 3.27
Facility
3.27
TX AVG
3.63
Rank
#158 / 239 | +82% | -10% | $0
Facility
$0
TX AVG
$81.8k
Rank
#1 / 244 | 7
Facility
7
TX AVG
25.9
Rank
#11 / 241 | 2.3
Facility
2.3
TX AVG
3.7
Rank
#39 / 241 | - | 107 | - |
55
Facility
55
TX AVG
41
Rank
#385 / 1389 | Hmg Park Manor Of Cyfair, L.l.c | $9.7MFiscal year ending 08/2024
Facility
$9.7MFiscal year ending 08/2024
TX AVG
$8.4M
Rank
#127 / 245 | $4.4MFiscal year ending 08/2024
Facility
$4.4MFiscal year ending 08/2024
TX AVG
$3.5M
Rank
#129 / 245 | 45.1%Fiscal year ending 08/2024
Facility
45.1%Fiscal year ending 08/2024
TX AVG
47%
Rank
#120 / 245 | 675818 | ||||
| Houston Transitional Care | NH HOS MC PC RC SNF | Houston (Braeburn) | 70
Facility
70
TX AVG
79
Rank
#503 / 972 |
96.0%
Facility
96.0%
TX AVG
67.3
Rank
#4 / 195 | +43% | 3.17
Facility
3.17
TX AVG
3.63
Rank
#181 / 239 | +22% | -13% | $0
Facility
$0
TX AVG
$81.8k
Rank
#1 / 244 | 16
Facility
16
TX AVG
25.9
Rank
#62 / 241 | 5.3
Facility
5.3
TX AVG
3.7
Rank
#222 / 241 | - | 67 | - |
75
Facility
75
TX AVG
41
Rank
#67 / 1389 | Ahmad El-Saadi | $12.3MFiscal year ending 12/2023
Facility
$12.3MFiscal year ending 12/2023
TX AVG
$8.4M
Rank
#30 / 245 | $5.1MFiscal year ending 12/2023
Facility
$5.1MFiscal year ending 12/2023
TX AVG
$3.5M
Rank
#116 / 245 | 41.4%Fiscal year ending 12/2023
Facility
41.4%Fiscal year ending 12/2023
TX AVG
47%
Rank
#240 / 245 | 676435 | ||||
| Caraday of Houston | NH MC RC SNF | Houston (Northside / Northline) | 150
Facility
150
TX AVG
79
Rank
#63 / 972 | - | - | 3.76
Facility
3.76
TX AVG
3.63
Rank
#77 / 239 | -32% | +4% | $0
Facility
$0
TX AVG
$81.8k
Rank
#1 / 244 | 15
Facility
15
TX AVG
25.9
Rank
#55 / 241 | 3.8
Facility
3.8
TX AVG
3.7
Rank
#167 / 241 | - | 12 | - |
41
Facility
41
TX AVG
41
Rank
#707 / 1389 | E&R Cunningham Investments, LP | $2.7MFiscal year ending 12/2023
Facility
$2.7MFiscal year ending 12/2023
TX AVG
$8.4M
Rank
#244 / 245 | $1.8MFiscal year ending 12/2023
Facility
$1.8MFiscal year ending 12/2023
TX AVG
$3.5M
Rank
#241 / 245 | 66.5%Fiscal year ending 12/2023
Facility
66.5%Fiscal year ending 12/2023
TX AVG
47%
Rank
#82 / 245 | 676470 | ||||
| Brazos Tower at Bayou Manor | NH AL IL MC SNF | Houston (Braeswood) | 33
Facility
33
TX AVG
79
Rank
#757 / 972 | - | - | 5.78
Facility
5.78
TX AVG
3.63
Rank
#5 / 239 | -37% | +59% | $46.6k
Facility
$46.6k
TX AVG
$81.8k
Rank
#169 / 244 | 5
Facility
5
TX AVG
25.9
Rank
#6 / 241 | 1.7
Facility
1.7
TX AVG
3.7
Rank
#8 / 241 | - | 28 | - |
64
Facility
64
TX AVG
41
Rank
#209 / 1389 | Sharon Darden | $4.7MFiscal year ending 12/2023
Facility
$4.7MFiscal year ending 12/2023
TX AVG
$8.4M
Rank
#25 / 245 | $7.0MFiscal year ending 12/2023
Facility
$7.0MFiscal year ending 12/2023
TX AVG
$3.5M
Rank
#49 / 245 | 151%Fiscal year ending 12/2023
Facility
151%Fiscal year ending 12/2023
TX AVG
47%
Rank
#233 / 245 | 676282 | ||||
| Capstone Healthcare Estates on Orem | NH HOS MC PC RC SNF | Houston (Central Southwest) | 120
Facility
120
TX AVG
79
Rank
#204 / 972 |
74.9%
Facility
74.9%
TX AVG
67.3
Rank
#84 / 195 | +11% | 3.69
Facility
3.69
TX AVG
3.63
Rank
#95 / 239 | -25% | +2% | $34.4k
Facility
$34.4k
TX AVG
$81.8k
Rank
#149 / 244 | 20
Facility
20
TX AVG
25.9
Rank
#113 / 241 | 2.9
Facility
2.9
TX AVG
3.7
Rank
#92 / 241 | 1 | 90 | - |
55
Facility
55
TX AVG
41
Rank
#385 / 1389 | - | $9.3MFiscal year ending 12/2023
Facility
$9.3MFiscal year ending 12/2023
TX AVG
$8.4M
Rank
#126 / 245 | $4.2MFiscal year ending 12/2023
Facility
$4.2MFiscal year ending 12/2023
TX AVG
$3.5M
Rank
#106 / 245 | 45.8%Fiscal year ending 12/2023
Facility
45.8%Fiscal year ending 12/2023
TX AVG
47%
Rank
#76 / 245 | 676314 |
Capstone Healthcare Estates on Orem is located in Houston, Texas.
Here are the financial assistance programs available to residents in Texas.
Capstone Healthcare Estates on Orem is in the Central Southwest neighborhood.
Capstone Healthcare Estates on Orem has a walk score of 55. Moderately walkable. Some errands can be accomplished on foot, with a mix of nearby amenities.
Capstone Healthcare Estates on Orem's occupancy is 80.7%.
No, Capstone Healthcare Estates on Orem has a no-pet policy.
Capstone Healthcare Estates on Orem is registered as a for-profit.
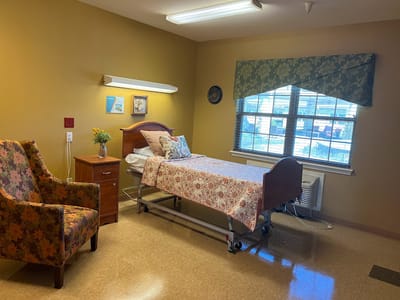
Yes — there are 2 photos of Capstone Healthcare Estates on Orem in the photo gallery on this page.
Capstone Healthcare Estates on Orem is located at 3730 W Orem Dr, Houston, TX 77045.
Care Cost Calculator: See Prices in Your Area
Nursing Home Data Explorer
Don’t Wait Too Long: 7 Red Flag Signs Your Parent Needs Assisted Living Now
The True Cost of Assisted Living in 2025 – And How Families Are Paying For It
Understanding Senior Living Costs: Pricing Models, Discounts & Financial Assistance


