


Castles of Love Assisted Living at Bowie
Assisted Living · Bowie, MD
Castles of Love Assisted Living at Bowie
Assisted Living · Bowie, MD
Castles of Love Assisted Living at Bowie accepts Medicaid.
Overview of Castles of Love Assisted Living at Bowie
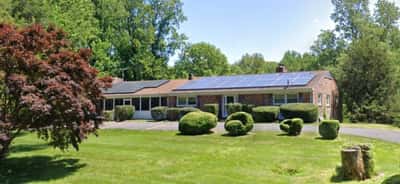
Nestled in Bowie, Maryland, Castles of Love is an inviting senior living community that offers residential assisted living services to residents, ages 55 and older. Residents’ care needs are immediately met with 24-hour supervision and monitoring by a compassionate team. With housekeeping and laundry services, case management services, and assistance with activities of daily living, residents are sure to live a convenient and easy lifestyle.
The community features a range of private and semi-private residences, built with safety features and modern conveniences to ensure residents live in comfort and safety. Delicious meals catered to residents’ unique needs are served daily for residents’ nourishment. A team of medication technicians and registered nurses are available to provide extensive services like podiatry services, physicians visit, and pharmacy delivery services, to ensure residents’ healthcare needs are met.
27 years in operation Rank #61 / 208Years in operation — State benchmarkedThis home is ranked 61st out of 208 homes in Maryland. Shows how long this facility has been in operation compared to other Maryland SNFs. Longer operating histories may benefit residents, families, and staff.Click the rank badge to see the full State ranking.Click here to see the full State ranking.
A longer operating history, which may indicate experience navigating regulations and delivering ongoing care.
Walk Score: 29 / 100 Rank #638 / 985Walk Score — State benchmarkedThis home is ranked 638th out of 985 homes in Maryland. Shows how walkable this facility's neighborhood is compared to the average Walk Score across Maryland SNFs. Higher scores benefit residents, families, and staff.Click the rank badge to see the full State ranking.Click here to see the full State ranking.
Somewhat walkable. A few nearby services may be reachable on foot, but most trips require transportation.
BBB Rating: A+ (Not Accredited)
An independent rating from the Better Business Bureau based on factors such as complaint history, transparency, and business practices.
How BBB ratings work
How BBB ratings work
About this community
Staffing
Key information about the people who lead and staff this community.
ContactMs. Charlotte Branch, President/Owner
Accept Medicaid
Rehabilitation Services
Respite Care
Doctor on Staff
Licensed Nurses/CNAs
24-Hour Staffing
Minimum Age55
Specific ProgramsMeals, medication administration, 24-hour supervision, housekeeping and laundry services, assistance with bathing and incontinence care, case management services, and assistance with activities of daily living (ADL’s).
Food DescriptionMeals, medication administration by Certified and Licensed Medication Technicians, 24-hour supervision and monitoring, housekeeping and laundry services, assistance with bathing and incontinence care, case management services, and assistance with activities of daily living (ADL’s).
What does this home offer?
Housing Options: Private / Semi-Private Rooms
Building Type: Single-story
Transportation Services,
Housekeeping Services
Recreational Activities
Security Systems
Places of interest near Castles of Love Assisted Living at Bowie
![]() 8.1 miles from city center
8.1 miles from city center
![]() Estimated distance in miles from Bowie's city center to Castles of Love Assisted Living at Bowie's address, calculated via Google Maps.
Estimated distance in miles from Bowie's city center to Castles of Love Assisted Living at Bowie's address, calculated via Google Maps.
Calculate Travel Distance to Castles of Love Assisted Living at Bowie
Add your location
Financial Assistance for
Assisted Living in Maryland
Castles of Love Assisted Living at Bowie is located in Bowie, Maryland.
Here are the financial assistance programs available to residents in Maryland.
Compare Assisted Living around Bowie
The information below is reported by the Maryland Department of Health, Office of Health Care Quality.
Filter by care type
| Tribute at Melford |
AL Assisted Living A licensed, long-term care setting for seniors or individuals with disabilities who need help with daily activities — like bathing, dressing, and medication management — but not 24-hour skilled nursing. Offers housing, meals, and around-the-clock support while aiming to maximize resident independence.
MC Memory Care Secured, specialized care for people living with Alzheimer's or dementia. Staff trained in cognitive impairment, with higher staff-to-resident ratios and an environment designed to reduce confusion and wandering risk. | Bowie (Melford Boulevard) | 140
Facility
140
MD AVG
44
Rank
#54 / 697 | Yes |
17
Facility
17
MD AVG
43
Rank
#766 / 985 | Private / Semi-Private Rooms | 5
Facility
5
MD AVG
21
Rank
#182 / 208 | - |
32% Male Residents — State Benchmarked 32% of residents are male, compared to the Maryland average of 31%. This facility caters to a majority female resident pool (68% female), consistent with the broader assisted living trend where women significantly outnumber men. |
68% Female Residents — State Benchmarked 68% of residents are female, compared to the Maryland average of 69%. Women comprise the large majority, consistent with national assisted living demographics where women live longer and enter care facilities at higher rates. |
24% White Residents — State Benchmarked 24% of residents are reported as White, compared to the Maryland average of 81%. A lower White share than the Maryland average — the community may draw a more diverse resident mix relative to other facilities in Maryland. |
58% African American Residents — State Benchmarked 58% of residents are reported as African American or Black, compared to the Maryland average of 13%. A higher African American share than the typical Maryland average — useful context when comparing cultural fit and community composition. |
18% Other Ethnicity Residents — State Benchmarked 18% of residents fall into categories other than White or African American (combined), compared to the Maryland average of 6%. This column aggregates Hispanic, Asian, multiracial, and any other labeled groups that are not classified as White or African American. Reported subgroups in this total: Mixed Race (10%), Asian (4%), Hispanic (4%). |
16% Residents Age 65–74 — State Benchmarked 16% of residents are 65–74, compared to the Maryland average of 13%. In line with the statewide profile for this youngest senior bracket in assisted living. |
26% Residents Age 75–84 — State Benchmarked 26% of residents are 75–84, compared to the Maryland average of 31%. Below the state norm — the resident mix may skew either younger or older than this typical middle bracket. |
36% Residents Age 85–94 — State Benchmarked 36% of residents are 85–94, compared to the Maryland average of 44%. The population here skews younger than the statewide norm, which may indicate a more active, lower-acuity community. |
18% Residents Age 95+ — State Benchmarked 18% of residents are 95 or older, compared to the Maryland average of 16%. In line with the statewide profile for the oldest resident bracket. |
| Brookdale Woodward Estates |
AL Assisted Living A licensed, long-term care setting for seniors or individuals with disabilities who need help with daily activities — like bathing, dressing, and medication management — but not 24-hour skilled nursing. Offers housing, meals, and around-the-clock support while aiming to maximize resident independence. | Bowie (Bowie Town Center) | 100
Facility
100
MD AVG
44
Rank
#120 / 697 | No |
27
Facility
27
MD AVG
43
Rank
#668 / 985 | Private / Semi-Private Rooms | 27
Facility
27
MD AVG
21
Rank
#61 / 208 | - |
31% Male Residents — State Benchmarked 31% of residents are male, compared to the Maryland average of 31%. This facility caters to a majority female resident pool (69% female), consistent with the broader assisted living trend where women significantly outnumber men. |
69% Female Residents — State Benchmarked 69% of residents are female, compared to the Maryland average of 69%. Women comprise the large majority, consistent with national assisted living demographics where women live longer and enter care facilities at higher rates. |
29% White Residents — State Benchmarked 29% of residents are reported as White, compared to the Maryland average of 81%. A lower White share than the Maryland average — the community may draw a more diverse resident mix relative to other facilities in Maryland. |
69% African American Residents — State Benchmarked 69% of residents are reported as African American or Black, compared to the Maryland average of 13%. A higher African American share than the typical Maryland average — useful context when comparing cultural fit and community composition. |
2% Other Ethnicity Residents — State Benchmarked 2% of residents fall into categories other than White or African American (combined), compared to the Maryland average of 6%. This column aggregates Hispanic, Asian, multiracial, and any other labeled groups that are not classified as White or African American. Reported subgroups in this total: Asian (2%). |
10% Residents Age 65–74 — State Benchmarked 10% of residents are 65–74, compared to the Maryland average of 13%. Fewer younger seniors suggests the resident population skews older, likely requiring higher acuity care and more hands-on support. |
49% Residents Age 75–84 — State Benchmarked 49% of residents are 75–84, compared to the Maryland average of 31%. A high concentration in this mid-range bracket, where residents typically need moderate support with daily activities. |
33% Residents Age 85–94 — State Benchmarked 33% of residents are 85–94, compared to the Maryland average of 44%. The population here skews younger than the statewide norm, which may indicate a more active, lower-acuity community. |
6% Residents Age 95+ — State Benchmarked 6% of residents are 95 or older, compared to the Maryland average of 16%. Most residents here have not yet reached the oldest-old bracket, suggesting a younger overall community. |
| Arbor Terrace at Waugh Chapel |
AL Assisted Living A licensed, long-term care setting for seniors or individuals with disabilities who need help with daily activities — like bathing, dressing, and medication management — but not 24-hour skilled nursing. Offers housing, meals, and around-the-clock support while aiming to maximize resident independence.
MC Memory Care Secured, specialized care for people living with Alzheimer's or dementia. Staff trained in cognitive impairment, with higher staff-to-resident ratios and an environment designed to reduce confusion and wandering risk. | Gambrills (Waugh Chapel Towne Centre) | 96
Facility
96
MD AVG
44
Rank
#143 / 697 | No |
47
Facility
47
MD AVG
43
Rank
#459 / 985 | Private / Semi-Private Rooms | 4
Facility
4
MD AVG
21
Rank
#191 / 208 | A+ |
30% Male Residents — State Benchmarked 30% of residents are male, compared to the Maryland average of 31%. This facility caters to a majority female resident pool (70% female), consistent with the broader assisted living trend where women significantly outnumber men. |
70% Female Residents — State Benchmarked 70% of residents are female, compared to the Maryland average of 69%. Women comprise the large majority, consistent with national assisted living demographics where women live longer and enter care facilities at higher rates. |
86% White Residents — State Benchmarked 86% of residents are reported as White, compared to the Maryland average of 81%. Close to the average for this category among assisted living facilities in Maryland with reported race/ethnicity data. |
12% African American Residents — State Benchmarked 12% of residents are reported as African American or Black, compared to the Maryland average of 13%. In line with the Maryland average for African American residents among facilities reporting this breakdown. |
3% Other Ethnicity Residents — State Benchmarked 3% of residents fall into categories other than White or African American (combined), compared to the Maryland average of 6%. This column aggregates Hispanic, Asian, multiracial, and any other labeled groups that are not classified as White or African American. Reported subgroups in this total: Asian (1%), Hawaiian/Pacific Islander (1%). |
10% Residents Age 65–74 — State Benchmarked 10% of residents are 65–74, compared to the Maryland average of 13%. Fewer younger seniors suggests the resident population skews older, likely requiring higher acuity care and more hands-on support. |
43% Residents Age 75–84 — State Benchmarked 43% of residents are 75–84, compared to the Maryland average of 31%. A high concentration in this mid-range bracket, where residents typically need moderate support with daily activities. |
39% Residents Age 85–94 — State Benchmarked 39% of residents are 85–94, compared to the Maryland average of 44%. This is typically the most common age bracket in assisted living — this facility is in line with the statewide norm. |
8% Residents Age 95+ — State Benchmarked 8% of residents are 95 or older, compared to the Maryland average of 16%. Most residents here have not yet reached the oldest-old bracket, suggesting a younger overall community. |
| Charter Senior Living of Bowie |
AL Assisted Living A licensed, long-term care setting for seniors or individuals with disabilities who need help with daily activities — like bathing, dressing, and medication management — but not 24-hour skilled nursing. Offers housing, meals, and around-the-clock support while aiming to maximize resident independence.
MC Memory Care Secured, specialized care for people living with Alzheimer's or dementia. Staff trained in cognitive impairment, with higher staff-to-resident ratios and an environment designed to reduce confusion and wandering risk. | Bowie (Laurel Bowie Road) | 52
Facility
52
MD AVG
44
Rank
#225 / 697 | No |
30
Facility
30
MD AVG
43
Rank
#627 / 985 | Private / Semi-Private Rooms | 26
Facility
26
MD AVG
21
Rank
#77 / 208 | - |
21% Male Residents — State Benchmarked 21% of residents are male, compared to the Maryland average of 31%. This facility caters to a majority female resident pool (79% female), consistent with the broader assisted living trend where women significantly outnumber men. |
79% Female Residents — State Benchmarked 79% of residents are female, compared to the Maryland average of 69%. Women comprise the large majority, consistent with national assisted living demographics where women live longer and enter care facilities at higher rates. |
52% White Residents — State Benchmarked 52% of residents are reported as White, compared to the Maryland average of 81%. A lower White share than the Maryland average — the community may draw a more diverse resident mix relative to other facilities in Maryland. |
46% African American Residents — State Benchmarked 46% of residents are reported as African American or Black, compared to the Maryland average of 13%. A higher African American share than the typical Maryland average — useful context when comparing cultural fit and community composition. |
2% Other Ethnicity Residents — State Benchmarked 2% of residents fall into categories other than White or African American (combined), compared to the Maryland average of 6%. This column aggregates Hispanic, Asian, multiracial, and any other labeled groups that are not classified as White or African American. Reported subgroups in this total: American Indian (2%). | - | - |
83% Residents Age 85–94 — State Benchmarked 83% of residents are 85–94, compared to the Maryland average of 44%. A high concentration of very elderly residents signals a higher-acuity facility with experience caring for advanced age-related needs. |
17% Residents Age 95+ — State Benchmarked 17% of residents are 95 or older, compared to the Maryland average of 16%. In line with the statewide profile for the oldest resident bracket. |
| Castles of Love Assisted Living at Bowie |
AL Assisted Living A licensed, long-term care setting for seniors or individuals with disabilities who need help with daily activities — like bathing, dressing, and medication management — but not 24-hour skilled nursing. Offers housing, meals, and around-the-clock support while aiming to maximize resident independence. | Bowie | - | No |
29
Facility
29
MD AVG
43
Rank
#638 / 985 | Private / Semi-Private Rooms | 27
Facility
27
MD AVG
21
Rank
#61 / 208 | A+ | - | - | - | - | - | - | - | - | - |
More homes from the same operator
Operated by
Castles of Love Assisted Living
Frequently Asked Questions about Castles of Love Assisted Living at Bowie
Is Castles of Love Assisted Living at Bowie in a walkable area?
Castles of Love Assisted Living at Bowie has a walk score of 29. Somewhat walkable. A few nearby services may be reachable on foot, but most trips require transportation.
Are there photos of Castles of Love Assisted Living at Bowie?
Yes — there are 3 photos of Castles of Love Assisted Living at Bowie in the photo gallery on this page.
What is the address of Castles of Love Assisted Living at Bowie?
Castles of Love Assisted Living at Bowie is located at 15590 Peach Walker Dr, Bowie, MD 20716.
What is the phone number of Castles of Love Assisted Living at Bowie?
(301) 249-4594 will put you in contact with the team at Castles of Love Assisted Living at Bowie.
Is Castles of Love Assisted Living at Bowie Medicare or Medicaid certified?
Castles of Love Assisted Living at Bowie is not currently listed as a CMS-certified provider of Medicare or Medicaid.
Guides for Better Senior Living
Care Cost Calculator: See Prices in Your Area
Nursing Home Data Explorer
Don’t Wait Too Long: 7 Red Flag Signs Your Parent Needs Assisted Living Now
The True Cost of Assisted Living in 2025 – And How Families Are Paying For It
Understanding Senior Living Costs: Pricing Models, Discounts & Financial Assistance
Contact Us

Published on
Updated on
Feedback
Write a review for Castles of Love Assisted Living at Bowie
Rate your overall experience with this community
Explore Open Rooms
1
Contact details
2
What type of senior care service are you looking for?
3
What budget do you have in mind for senior care?
4
How soon do you need to find care?
5
Additional details
Thank you for your interest!
Our team will be in touch shortly to help with next steps.
Need Help?
Let us help you or a loved one find the perfect senior home.
