


Chrisoma West
Nursing Home, Assisted Living & Independent Living · Kearney, NE
CMS overall rating Info The Overall CMS Rating is scored from 1 to 5 stars and combines results from health inspections, staffing levels, and quality measures. Health inspections carry the most weight. Staffing and quality scores can increase or decrease the final rating based on performance compared to state and national standards.

Chrisoma West

Nursing Home, Assisted Living & Independent Living · Kearney, NE
CMS overall rating Info The Overall CMS Rating is scored from 1 to 5 stars and combines results from health inspections, staffing levels, and quality measures. Health inspections carry the most weight. Staffing and quality scores can increase or decrease the final rating based on performance compared to state and national standards.
Calculator: See prices in your area
Chrisoma West accepts Medicare, Medicaid, and private pay.

Overview of Chrisoma West

Chrisoma West is a premier assisted living community, presenting services catering to seniors seeking independent living with congregate dining and those searching for assistive services. The community boasts various assisted living apartments in diverse sizes and styles, providing ample options for individual preferences.

At Chrisoma West, every aspect of senior living is thoughtfully designed to foster a comfortable, engaging, and fulfilling lifestyle for each resident. They offer a well-equipped library with WiFi access and computers, accessible to all residents to enhance convenience, this assisted living community also extends transportation services for medical appointments and shopping trips within the Holdrege area, ensuring seamless access to essential services and activities. Additionally, senior residents can enjoy housekeeping services, delectable meals, engaging activities, and convenient transportation for local appointments and shopping excursions within the serene setting.

Quality ratings

Measured by Centers for Medicare & Medicaid Services (CMS)

Overall rating Info The Overall CMS Rating combines results from health inspections, staffing levels and quality measures. Health inspections carry the most weight. Staffing and quality scores can increase or decrease the final rating based on performance compared to state and national standards.
▼ 63.9% Below NE avg. ▼ 63.9% Below NE avg.Click the badge to see the full State ranking.Click here to see the full State ranking.
Health Inspection Info Based on the results of the facility's three most recent standard inspections and any complaint investigations. CMS reviews the number, scope, and severity of deficiencies, with more recent findings weighted more heavily.
▼ 27.5% Below NE avg. ▼ 27.5% Below NE avg.Click the badge to see the full State ranking.Click here to see the full State ranking.
Staffing Info Measures average nursing staff hours per resident per day, including Registered Nurses (RNs) and total nursing staff. Ratings are adjusted based on the level of care residents require and are compared to state and national benchmarks.
▼ 36.3% Below NE avg. ▼ 36.3% Below NE avg.Click the badge to see the full State ranking.Click here to see the full State ranking.
Quality Measures Info Based on clinical and physical health indicators reported to CMS, such as hospital readmissions, falls, pressure ulcers, and improvements in mobility. These measures reflect how well residents' health needs are being managed.
▼ 63.2% Below NE avg. ▼ 63.2% Below NE avg.Click the badge to see the full State ranking.Click here to see the full State ranking.

Staffing hours breakdown

Info Daily nursing hours per resident by staff type, reported to CMS. Higher is generally better — compare this facility to state and national averages to see where staffing stands.

Hours per resident per day — compared to Nebraska state averages

Total nursing care / resident Info This home is ranked 68th out of 117 homes in Nebraska. Total adjusted nursing hours per resident per day, combining RN, LPN, and aide time. CMS adjusts this for case-mix so facilities can be fairly compared.
3h 59m per day
Rank #68 / 117Nurse hours — State benchmarkedThis home is ranked 68th out of 117 homes in Nebraska. Shows adjusted nurse hours per resident per day benchmarked to the Nebraska average, with a ranking across 117 Nebraska SNFs. More hours mean more direct care. The national average is about 3.5 hrs; below 3.0 is a red flag.Click the rank badge to see the full State ranking.Click here to see the full State ranking.
This facility Nebraska avg (4h 20m per day)
vs Nebraska avg
-8%

1 of 1 metrics below state avg

Staff typeHours / Day / Residentvs state avg
Weekend Total Nursing Info Combined nursing hours (RN + LPN + Nurse Aide) per resident per day on weekends. Staffing often drops on weekends — this figure reveals whether the facility maintains adequate coverage outside of weekday hours. 3h 26m per day ▼ 4% State avg: 3h 34m per day · National avg: 3h 25m per day

Types of Care at Chrisoma West

Assisted Living Independent Living

Capacity and availability

Avg. Length of Stay
293 days
Bed community size
60-bed community Rank #133 / 228Bed count — State benchmarkedThis home is ranked 133rd out of 228 homes in Nebraska. Shows this facility's certified or reported bed count compared to other Nebraska SNFs. Larger communities may offer more amenities, programs, and on-site services for residents and families.Click the rank badge to see the full State ranking.Click here to see the full State ranking.
A moderately sized community that may balance personal attention with shared amenities and social activities.
Walk Score
Walk Score: 2 / 100 Rank #287 / 298Walk Score — State benchmarkedThis home is ranked 287th out of 298 homes in Nebraska. Shows how walkable this facility's neighborhood is compared to the average Walk Score across Nebraska SNFs. Higher scores benefit residents, families, and staff.Click the rank badge to see the full State ranking.Click here to see the full State ranking.
Car-dependent. Most errands require a car, with limited nearby walkable options.

About this community

Occupancy

Occupancy rate
100%
Rank #1 / 194Occupancy rate — State benchmarkedThis home is ranked 1st out of 194 homes in Nebraska. Shows this facility's occupancy rate versus the Nebraska average, with its Statewide rank out of 194. Higher occupancy signals strong local demand and financial stability.Click the rank badge to see the full State ranking.Click here to see the full State ranking.
Higher than the Nebraska average: 70.3%
Occupied beds
60 / 60
Average occupied beds in Nebraska homes 54 beds

License Details

Facility TypeAssisted Living Facilities
StatusActive
CountyPhelps
License NumberALF030

Services

Medicaid Waiver

Ownership & Operating Entity

Chrisoma West is administrated by Kendra Norton.

Therapy & Rehabilitation

1 service
Rehabilitation Services

Contact Information

Fax(308) 995-3995

Amenities & Lifestyle

Medication Administration
Housekeeping
Personal Assistance
Activities
Laundry
Meals
In-House Beauty Shop
Daily Housekeeping
Neighborhood Dining
On-Site Therapy Services
Specific ProgramsRehab to Home, Therapy Services

Dining & Nutrition

Food DescriptionResidents provide their own furnishings, giving their living areas a personal touch. Meals are included.

Contact Chrisoma West

Inspection History

In Nebraska, the Department of Health and Human Services, Division of Public Health conducts regular inspections to ensure nursing and assisted living facilities meet state and federal standards.

Since 2010 · 16 years of data 103 deficiencies

Inspection Scorecard Info This scorecard compares key inspection, citation, and complaint metrics at this facility against the Nebraska state average. Metrics rated ≥15% worse than average are highlighted in red; those ≥15% better are highlighted in green.

Since 2010 vs. Nebraska state average
Overall vs. NE average 2 Worse Metrics worse than Nebraska average:
• Total deficiencies (98% above)
• Deficiencies per year (94% above)
0 Better No metrics in this bucket.
Latest Inspection July 21, 2025

Deficiencies Info Deficiencies are formal regulatory issues recorded during state inspections.

This FacilityNE Averagevs. NE Avg
Total deficiencies Info Formal regulatory issues recorded by inspectors across all inspection types. 10352 This facility has 98% more total deficiencies than a typical Nebraska nursing home (103 vs. NE avg 52).↑ 98% worse
Deficiencies per year Info Average deficiencies per year since 2010. 6.43.3 This facility has 94% more deficiencies per year than a typical Nebraska nursing home (6.4 vs. NE avg 3.3).↑ 94% worse

Inspection Reports Summary Info An editor-reviewed summary of the themes and findings across this facility's recent inspection reports.

The most recent inspection on July 21, 2025, identified deficiencies related to failure to implement interventions to protect residents from elopement, resulting in a prohibition on new admissions until compliance is demonstrated and a fine of $1,000 per violation. Earlier inspections were mostly clean and focused on licensure renewal and occupancy permits, with one citation in 2011 for a food safety issue involving dietary staff handwashing. Complaint investigations in 2016 and 2019 were unsubstantiated, with no evidence found to support allegations regarding resident protection or staffing. No other enforcement actions such as license suspensions or warnings were listed in the available reports. The recent deficiencies represent a new area of concern compared to prior inspections, indicating a need for corrective action in resident safety measures.

Read the full inspection reports for this facility, including detailed findings and corrective actions.

Show Inspection Reports

Health Inspection History

Inspections since 2023
Total health inspections 6

Nebraska average 4.3


Last Health inspection on Jul 2025

Total health citations
19 Rank #70 / 122Health citations — State benchmarkedThis home is ranked 70th out of 122 homes in Nebraska. Shows this facility's total health deficiency citations benchmarked to the Nebraska State average, with a ranking across all 122 NE SNFs. Lower citation counts earn a better rank.Click the rank badge to see the full State ranking.Click here to see the full State ranking.

Nebraska average 18.2

Citations per inspection
3.17 Rank #32 / 122Citations per inspection — State benchmarkedThis home is ranked 32nd out of 122 homes in Nebraska. Shows average deficiency citations per CMS inspection for this facility versus the Nebraska mean across 122 SNFs with citation data. Lower is better.Click the rank badge to see the full State ranking.Click here to see the full State ranking.

Nebraska average 4.19


Health citations are formal notices following inspections when they fail to comply with safety and care standards.

12 of 19 citations resulted from standard inspections; 4 of 19 resulted from complaint investigations; and 3 of 19 came from combined inspections (standard and complaint).

Breakdown of citation severity (last 3 years)
Critical health citations
0
100% better than Nebraska average

Nebraska average: 0.2


Serious health citations
0
100% better than Nebraska average

Nebraska average: 0.5

0 critical citations Nebraska average: 0.2

0 serious citations Nebraska average: 0.5

18 moderate citations Nebraska average: 17.2

1 minor citation Nebraska average: 0.2
Citations history (last 3 years)
Infection Control moderate citation Jul 21, 2025
Corrected

Administration moderate citation Apr 08, 2025
Corrected

Nutrition moderate citation Apr 08, 2025
Corrected

Abuse/Neglect moderate citation Jan 15, 2025
Corrected

Staffing Data

Reporting period: October 1 – December 31, 2025 (Q4 2025). Source: CMS Payroll-Based Journal report.

Total staff 110
Employees 78
Contractors 32
Staff to resident ratio 1.69:1
17% worse than Nebraska average
Nebraska average ratio: 2.03:1 Nebraska average ratio: 2.03:1See full Nebraska ranking
Avg staff/day 35
Average shift 8.5 hours
9% better than Nebraska average
Nebraska average: 7.8 hours Nebraska average shift: 7.8 hoursSee full Nebraska ranking
Total staff hours (quarter) 27,509

Nursing staff breakdown

Q4 2025 · Oct 1 – Dec 31 More info This data comes from the CMS Payroll-Based Journal report covering October 1 – December 31, 2025.
Registered Nurse

Manages medical care and health needs.

RN Staff 9
Average shift length Info Average shift length. Calculated as total hours divided by days worked and average staff per day. 9.8 hours

This role is partially covered by contractors.

Licensed Practical Nurse

Assists with medical care and medications.

LPN Staff 11
Average shift length Info Average shift length. Calculated as total hours divided by days worked and average staff per day. 9.8 hours

This role is partially covered by contractors.

Certified Nursing Assistant

Helps with daily care and mobility.

CNA Staff 34
Average shift length Info Average shift length. Calculated as total hours divided by days worked and average staff per day. 7.7 hours

This role is partially covered by contractors.

Contractor staffing

Q4 2025 · Oct 1 – Dec 31 More info This data comes from the CMS Payroll-Based Journal report covering October 1 – December 31, 2025.

Total hours from contractors

14%

3,845 contractor hours this quarter

Medication Aide/Technician: 6 Speech Language Pathologist: 6 Physical Therapy Assistant: 4 Occupational Therapy Aide: 3 Qualified Social Worker: 3 Certified Nursing Assistant: 2 Registered Nurse: 2 Physical Therapy Aide: 2 Respiratory Therapy Technician: 2 Licensed Practical Nurse: 1 Occupational Therapy Assistant: 1

Staff by category

Q4 2025 · Oct 1 – Dec 31 More info This data comes from the CMS Payroll-Based Journal report covering October 1 – December 31, 2025.
Medication Aide/Technician226288,46992100%9
Certified Nursing Assistant322348,08992100%7.7
Licensed Practical Nurse101114,83692100%9.8
Registered Nurse7292,40092100%9.8
Other Dietary Services Staff2027566571%7.8
Administrator1015286672%8
Nurse Practitioner1015286672%8
Mental Health Service Worker1015166368%8.2
Dietitian1014736368%7.5
Clinical Nurse Specialist1014525863%7.8
Qualified Social Worker033932123%4.4
Physical Therapy Aide022931921%4.6
Speech Language Pathologist066851718%2.9
Respiratory Therapy Technician022731617%4.6
Occupational Therapy Aide033541718%3
Physical Therapy Assistant044391011%3.6
Occupational Therapy Assistant0112789%3.3
28 Medication Aide/Technician
% of Days 100%
34 Certified Nursing Assistant
% of Days 100%
11 Licensed Practical Nurse
% of Days 100%
9 Registered Nurse
% of Days 100%
2 Other Dietary Services Staff
% of Days 71%
1 Administrator
% of Days 72%
1 Nurse Practitioner
% of Days 72%
1 Mental Health Service Worker
% of Days 68%
1 Dietitian
% of Days 68%
1 Clinical Nurse Specialist
% of Days 63%
3 Qualified Social Worker
% of Days 23%
2 Physical Therapy Aide
% of Days 21%
6 Speech Language Pathologist
% of Days 18%
2 Respiratory Therapy Technician
% of Days 17%
3 Occupational Therapy Aide
% of Days 18%
4 Physical Therapy Assistant
% of Days 11%
1 Occupational Therapy Assistant
% of Days 9%

Penalties and fines

Federal penalties imposed by CMS for regulatory violations, including civil money penalties (fines) and denials of payment for new Medicare/Medicaid admissions.

Source: CMS Penalties Database

No penalties in the past 3 years

No civil money penalties or payment denials were reported in the last 3 years.

Quality of care over time

These measures show how residents usually do over time at this home, based on health outcomes and preventive care.

High-risk clinical events score Info A composite score based on pressure ulcers, falls with injury, weight loss, walking ability decline, and activities of daily living decline. 15.3
35% worse than Nebraska average

Nebraska average: 11.3

Functional decline score Info A composite score based on activities of daily living decline, walking ability decline, and incontinence. 30.9
33% worse than Nebraska average

Nebraska average: 23.3

Long-stay resident measures
Need for Help with Daily Activities Increased Info Percent of long-stay residents whose need for help with daily activities has increased 29.1%
40% worse than Nebraska average

Nebraska average: 20.8%

Walking Ability Worsened Info Percent of long-stay residents whose ability to move independently worsened 31.3%
41% worse than Nebraska average

Nebraska average: 22.1%

Low Risk Residents with Bowel/Bladder Incontinence Info Percent of low risk long-stay residents who lose control of their bowels or bladder 32.4%
20% worse than Nebraska average

Nebraska average: 26.9%

Falls with Major Injury Info Percent of long-stay residents experiencing one or more falls with major injury 6.7%
49% worse than Nebraska average

Nebraska average: 4.5%

High Risk Residents with Pressure Ulcers Info Percent of long-stay high risk residents with pressure ulcers 0.0%
100% better than Nebraska average

Nebraska average: 4.3%

Urinary Tract Infection Info Percent of long-stay residents with a urinary tract infection 1.5%
51% better than Nebraska average

Nebraska average: 3.1%

Lost Too Much Weight Info Percent of long-stay residents who lose too much weight 9.4%
72% worse than Nebraska average

Nebraska average: 5.4%

Depressive Symptoms Info Percent of long-stay residents who have depressive symptoms 0.0%
100% better than Nebraska average

Nebraska average: 4.4%

Antipsychotic Use Info Percent of long-stay residents who received an antipsychotic medication 21.4%
8% worse than Nebraska average

Nebraska average: 19.8%

Pneumococcal Vaccine Info Percent of long-stay residents assessed and appropriately given the pneumococcal vaccine 98.7%
6% better than Nebraska average

Nebraska average: 93.2%

Influenza Vaccine Info Percent of long-stay residents assessed and appropriately given the seasonal influenza vaccine 98.4%
In line with Nebraska average

Nebraska average: 96.1%

Short-stay resident measures
Pneumococcal Vaccine Info Percent of short-stay residents assessed and appropriately given the pneumococcal vaccine 96.7%
20% better than Nebraska average

Nebraska average: 80.7%

Antipsychotic medication increase Info Percent of short-stay residents who newly received an antipsychotic medication 3.8%
58% worse than Nebraska average

Nebraska average: 2.4%

Influenza Vaccine Info Percent of short-stay residents assessed and appropriately given the seasonal influenza vaccine 89.7%
18% better than Nebraska average

Nebraska average: 75.9%

Breakdown by payment type

Medicare

87% of new residents, usually for short-term rehab.

Typical stay 25 days

Private pay

10% of new residents, often for short stays.

Typical stay 2 - 3 years

Medicaid

3% of new residents, often for long-term daily care.

Typical stay 9 - 10 years

Facility Characteristics

Source: CMS Long-Term Care Facility Characteristics (Data as of Jan 2026)

Total residents 65
Medicare
8
12.3% of residents
Medicaid
25
38.5% of residents
Private pay or other
32
49.2% of residents
Programs & Services
Residents Group

Residents meet regularly to discuss policies, care quality, and activities

CCRC

Part of a Continuing Care Retirement Community offering multiple care levels

Active Resident Council

Organized group of residents that meets regularly to discuss facility policies, quality of life, and activities.

Finances and operations

Voluntary non-profit community
Operated by a church.
Home revenue
$10.4M
Operating deficit
-$71.3K
Voluntary non-profit community Operated by a church.
Home revenue
$10.4M Rank #28 / 120Revenue — State benchmarkedThis home is ranked 28th out of 120 homes in Nebraska. Shows this facility's annual revenue compared to the Nebraska SNF average. Higher revenue generally means more resources for staffing and capital — read alongside Payroll %.Click the rank badge to see the full State ranking.Click here to see the full State ranking.
Operating deficit
-$71.3K
Payroll costs Info The portion of the home's budget spent on staff, including nurses, caregivers, and other employees who support care and operations. Rank #38 / 120Payroll — State benchmarkedThis home is ranked 38th out of 120 homes in Nebraska. Shows total annual staff payroll benchmarked to the Nebraska average. Higher payroll investment relative to peers often signals better staffing and less reliance on cheaper contract labor.Click the rank badge to see the full State ranking.Click here to see the full State ranking.
$4.9M
47.2% of revenue Rank #97 / 120Payroll % — State benchmarkedThis home is ranked 97th out of 120 homes in Nebraska. Shows payroll as a percentage of revenue versus the Nebraska average. Well-run Nebraska SNFs typically land around 66–74% — the top third Statewide. Below 25% may signal understaffing or heavy agency use — read with Staffing ratings.Click the rank badge to see the full State ranking.Click here to see the full State ranking.
Other operating costs Info All remaining costs needed to run the home, such as food, utilities, building maintenance, supplies and administrative expenses.
$5.5M
Total costs $10.4M

What does this home offer?

Housing options icon

Housing Options: Private Rooms

Building type icon
Building type icon

Building Type: Two-story

Transportation services icon

Transportation Services

Fitness and recreation icon

Fitness and Recreation

Who this home usually serves

TYPE OF STAY

Mostly short-term rehab stays

Most residents typically stay for a few weeks or months before returning home or moving on.

Places of interest near Chrisoma West

Address 32.5 miles from city center Info Estimated distance in miles from Holdrege's city center to Chrisoma West's address, calculated via Google Maps. — 1.47 miles to nearest hospital (Phelps Memorial Health Center)

Calculate Travel Distance to Chrisoma West

Add your location

Address

Financial Assistance for
Nursing Home in Nebraska

Chrisoma West is located in Holdrege, Nebraska.
Here are the financial assistance programs available to residents in Nebraska.

Get Financial aid guidance

Aged and Disabled Waiver

Nebraska Medicaid A&D Waiver

Age 65+ or disabled
General Nebraska resident, Medicaid- eligible, nursing home-level care need.
Income Limits (2025) ~$2,829/month 300% FBR, individual
Asset Limits $4,000 individual, higher than most states
NE

Higher asset limit; rural access focus.

Benefits
Personal care (5-7 hours/day) Respite (240 hours/year) Adult day care (~$60/day) Home aides

Nebraska Respite Network

NE Respite Network

Age Caregiver of someone 60+
General Nebraska resident.
Income Limits No strict limit; prioritizes low-income.
Asset Limits Not applicable.
NE

Lifespan respite focus; limited funding.

Benefits
In-home respite (4-6 hours/day) Adult day care (~$60/day) Short-term facility care (up to 5 days)

Personal Assistance Services (PAS)

Nebraska Personal Assistance Services

Age 19+ (65+ for seniors focus)
General Nebraska resident, Medicaid-eligible, needs help with 1+ ADL (e.g., bathing, dressing).
Income Limits (2025) ~$1,255/month (100% FPL, individual); spenddown allowed.
Asset Limits $4,000 (individual), $6,000 (couple) (excludes home up to $688,000, car).
NE

Family can be paid caregivers; statewide via DHHS.

Benefits
Personal care (4-6 hours/day) Limited homemaker services Respite (~200 hours/year)

Program of All-Inclusive Care for the Elderly (PACE)

Nebraska PACE (Immanuel Pathways)

Age 55+
General Nebraska resident (specific counties), NFLOC, safe with PACE support.
Income Limits (2025) ~$2,829/month (Medicaid-eligible); private pay option available.
Asset Limits $4,000 (individual), $6,000 (couple).
NE

Only in Douglas, Sarpy, parts of Cass/Pottawattamie/Washington Counties.

Benefits
Personal care (5-7 hours/day) Medical care Meals Transportation Respite Therapies

Medicare Savings Program (MSP)

Nebraska Medicare Savings Program

Age 65+ or disabled
General Nebraska resident, Medicare Part A/B.
Income Limits (2025) ~$2,510/month (QMB), ~$3,380/month (SLMB), ~$3,598/month (QI)—individual.
Asset Limits $9,430 (individual), $14,130 (couple).
NE

Three tiers; no waitlist; includes Extra Help for Part D.

Benefits
Covers Part B premiums ($174.70/month) Deductibles ($240/year) Copays (~20%)

VA Aid and Attendance (A&A) and Housebound Benefits

Nebraska VA Aid and Attendance/Housebound

Age 65+ or disabled veteran/spouse
General Nebraska resident, wartime service, need for ADL help (A&A) or homebound.
Income Limits (2025) Net income < ~$1,984/month (veteran with dependent, A&A); pension offsets income.
Asset Limits ~$155,356 net worth limit
NE

High veteran demand in rural areas.

Benefits
Cash (~$1,433-$2,642/month veteran, ~$951-$1,318 spouse) for care costs (e.g., in-home, assisted living)

Compare Nursing Home around Kearney

2 facilities compared · CMS & NE Dept. of Health data

Filter by care type
Mount Carmel Home
NH

Nursing Home Licensed facility providing 24/7 skilled nursing care for residents with complex, ongoing medical needs. Staffed by RNs, LPNs, and CNAs. Inspected and star-rated annually by CMS. Accepts Medicare (short-term rehab) and Medicaid (long-term care).

AL

Assisted Living A licensed, long-term care setting for seniors or individuals with disabilities who need help with daily activities — like bathing, dressing, and medication management — but not 24-hour skilled nursing. Offers housing, meals, and around-the-clock support while aiming to maximize resident independence.

MC

Memory Care Secured, specialized care for people living with Alzheimer's or dementia. Staff trained in cognitive impairment, with higher staff-to-resident ratios and an environment designed to reduce confusion and wandering risk.

N

Nursing

Kearney (West 18Th Street)75 78.1% +11%6.51 -11%+46%$011.0-58 73 Mary Blavet$7.3M$4.9M66.4%285216
Chrisoma West
NH

Nursing Home Licensed facility providing 24/7 skilled nursing care for residents with complex, ongoing medical needs. Staffed by RNs, LPNs, and CNAs. Inspected and star-rated annually by CMS. Accepts Medicare (short-term rehab) and Medicaid (long-term care).

AL

Assisted Living A licensed, long-term care setting for seniors or individuals with disabilities who need help with daily activities — like bathing, dressing, and medication management — but not 24-hour skilled nursing. Offers housing, meals, and around-the-clock support while aiming to maximize resident independence.

IL

Independent Living Lifestyle-focused communities for older adults offering dining, activities, and transportation with minimal personal care. Best for active, independent seniors who want community without medical support.

Holdrege60 123.3% +75%3.98 -15%-11%$0193.2-74 2 Midwest District Of The Evangelical Free Church Of America$10.4M$4.9M47.2%285246

Frequently Asked Questions about Chrisoma West

Is Chrisoma West in a walkable area?

Chrisoma West has a walk score of 2. Car-dependent. Most errands require a car, with limited nearby walkable options.

What is the license number of Chrisoma West?

According to NE state health department records, Chrisoma West's license number is ALF030.

What is the occupancy rate at Chrisoma West?

Chrisoma West's occupancy is 100%.

Who is the administrator of Chrisoma West?

Kendra Norton is the administrator of Chrisoma West.

How many beds does Chrisoma West have?

Chrisoma West has 60 beds.

Are there photos of Chrisoma West?

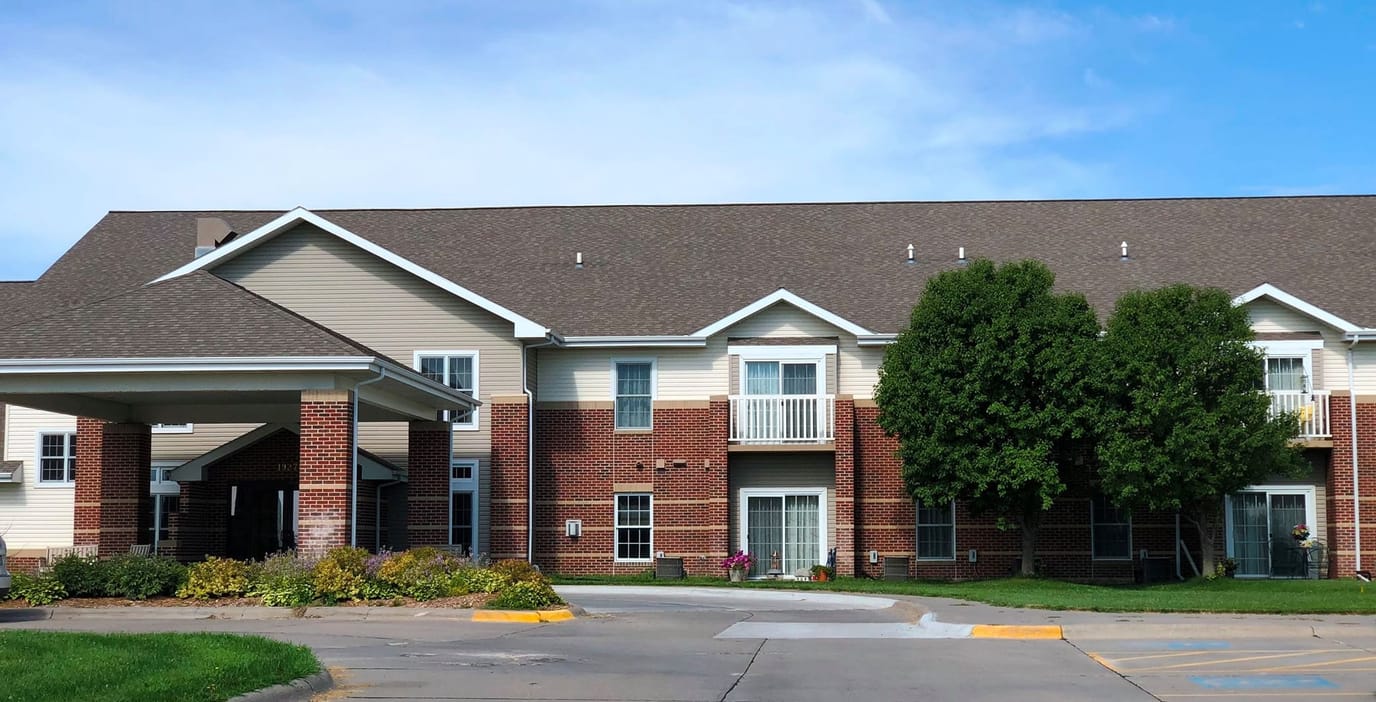
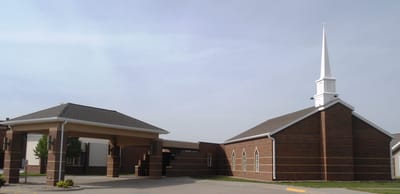
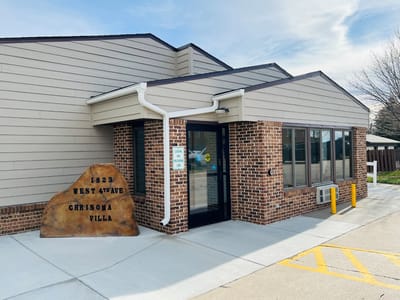
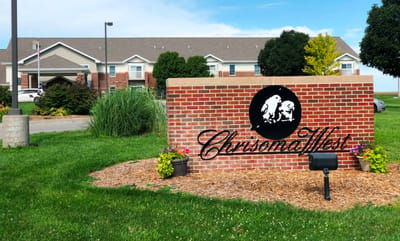
Yes — there are 3 photos of Chrisoma West in the photo gallery on this page.

What is the phone number of Chrisoma West?

(308) 995-2086 will put you in contact with the team at Chrisoma West.

Guides for Better Senior Living

Care Cost Calculator: See Prices in Your Area

Nursing Home Data Explorer

Don’t Wait Too Long: 7 Red Flag Signs Your Parent Needs Assisted Living Now

The True Cost of Assisted Living in 2025 – And How Families Are Paying For It

Understanding Senior Living Costs: Pricing Models, Discounts & Financial Assistance

Explore Open Rooms
1 Contact details
2 What type of senior care service are you looking for?
3 What budget do you have in mind for senior care?
4 How soon do you need to find care?
5 Additional details

Thank you for your interest!

Our team will be in touch shortly to help with next steps.


