We arrange tours, appointments, and even moving support so you don’t have to
2
Ranked on Data, Not Dollars
We rank communities on objective measures like inspection records, quality scores, and care data, so you can find trusted options without the guesswork.
3
Personalized Guidance
From lifestyle matching to help with insurance and financial assistance, we make sure the community is the right fit
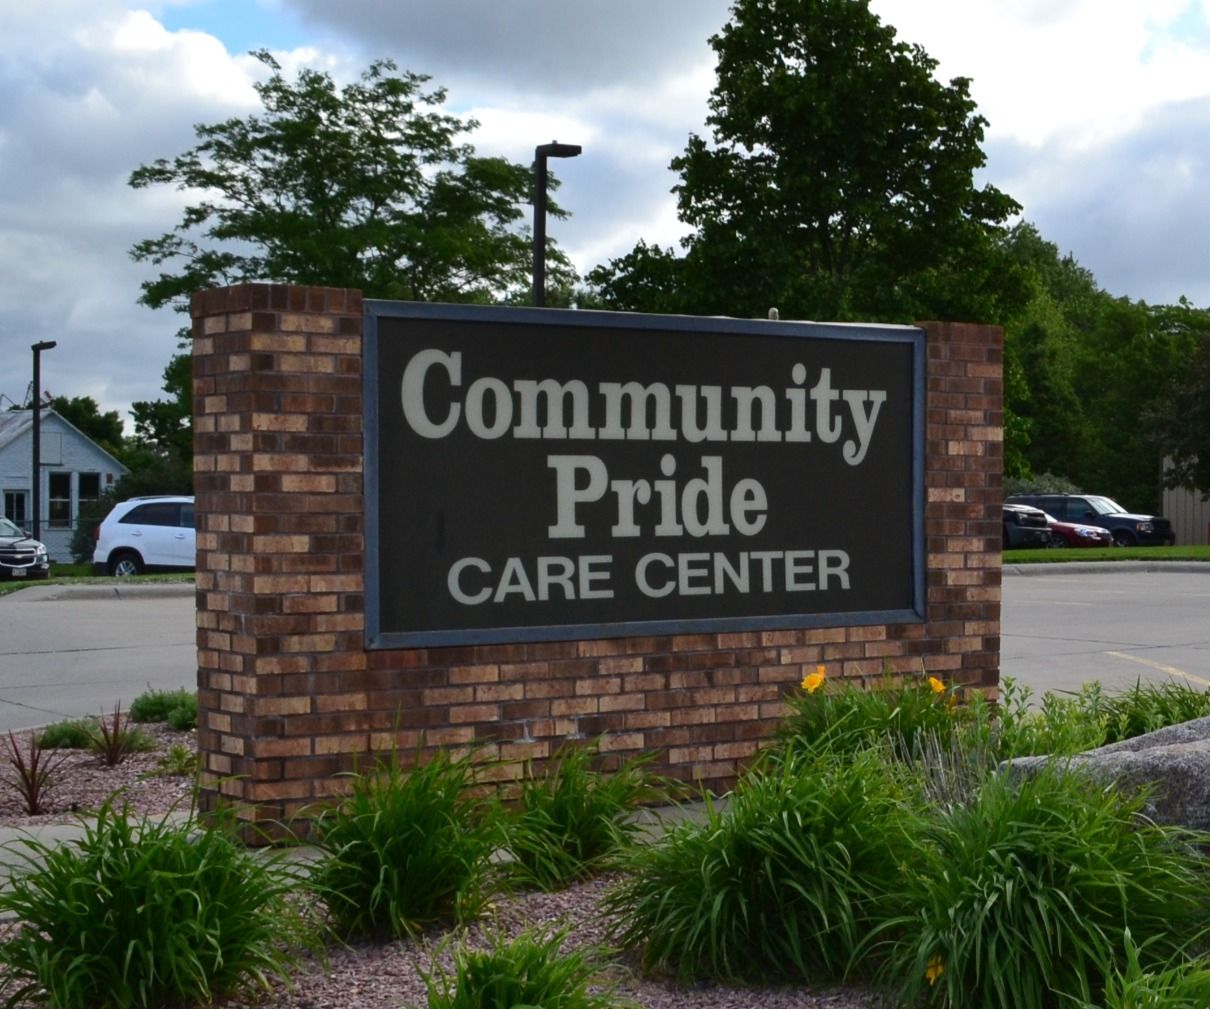
Community Pride Care Center
Nursing Home, Assisted Living, Hospice Care, Respite Care & Skilled Nursing · Battle Creek, NE
CMS overall rating
4/5
CMS (the Centers for Medicare & Medicaid Services) is the federal agency that rates nursing home quality. Its Overall Rating runs from 1 to 5 stars, combining health inspections, staffing, and quality measures, with inspections weighted most heavily.
Nursing Home, Assisted Living, Hospice Care, Respite Care & Skilled Nursing · Battle Creek, NE
CMS overall rating
4/5
CMS (the Centers for Medicare & Medicaid Services) is the federal agency that rates nursing home quality. Its Overall Rating runs from 1 to 5 stars, combining health inspections, staffing, and quality measures, with inspections weighted most heavily.
Community Pride Care Center accepts Medicare, Medicaid, and private pay.
Overview of Community Pride Care Center
Community Pride Care Center offers nursing home, assisted living, hospice care, respite care, and skilled nursing in Battle Creek, NE. Nursing home care supports residents who need ongoing help with daily needs, while assisted living helps with tasks such as dressing, bathing, and medication. Skilled nursing provides licensed nursing care around the clock, hospice care focuses on comfort for someone nearing the end of life, and respite care provides a short stay when a person’s usual caregiver needs temporary support.
The combination of assisted living, nursing home, and skilled nursing can suit a resident whose care needs may grow over time without requiring a move to a different community. With 50 beds, Community Pride Care Center is among the smaller communities, where staff and residents can get to know each other. Total nurse staffing is 2 hours and 41 minutes per resident each day, representing the daily hands on nurse time assigned to each resident.
Medicare, Medicaid, and private pay are accepted, giving families payment options that may include Medicaid when savings do not cover a long stay and Medicare for short term skilled care after a hospital stay. Community Pride Care Center opened in 1989 and is operated by City Of Battle Creek, with Administrator Shelley McIntosh leading its day to day administration. A Walk Score of 33 out of 100 places the area in a car dependent setting, so most errands require a car or a ride.
The community is next to a park, providing a nearby outdoor setting, and its Skilled Rehab program provides rehabilitation services. Community Pride Care Center may be a good fit for someone who needs assisted living, nursing home, skilled nursing, hospice, or respite care, particularly when care needs could increase over time.
Measured by Centers for Medicare & Medicaid Services (CMS)
Overall ratingThe Overall CMS Rating combines results from health inspections, staffing levels and quality measures. Health inspections carry the most weight. Staffing and quality scores can increase or decrease the final rating based on performance compared to state and national standards.
Health InspectionBased on the results of the facility's three most recent standard inspections and any complaint investigations. CMS reviews the number, scope, and severity of deficiencies, with more recent findings weighted more heavily.
StaffingMeasures average nursing staff hours per resident per day, including Registered Nurses (RNs) and total nursing staff. Ratings are adjusted based on the level of care residents require and are compared to state and national benchmarks.
Quality MeasuresBased on clinical and physical health indicators reported to CMS, such as hospital readmissions, falls, pressure ulcers, and improvements in mobility. These measures reflect how well residents' health needs are being managed.
StaffingData period: Q4 2025 (October 1 – December 31, 2025).
Nursing care per resident per day and state rankings: CMS Provider Information.
Headcount, shifts and contractors: CMS Payroll-Based Journal (PBJ).
Resident count: CMS Long-Term Care Facility Characteristics (data as of Jun 2026).
Total nursing care per resident / day
This nursing home is ranked 116th out of 117 nursing homes we track in Nebraska for nurse hours. Total adjusted nursing hours per resident per day, combining RN, LPN, and aide time. CMS adjusts this for case-mix so facilities can be fairly compared.
This facility
NE avg 4h 29m
↓ 40% · NE 4h 29mThis facility: 2h 41m per resident per day, 40% below the Nebraska average of 4h 29m (among Nebraska facilities reporting a recent figure).Green: 5% or more better than the state average. Yellow: within 5%. Red: 5% or more worse.Rank#116 / 117Nurse hours — State benchmarkedThis nursing home is ranked 116th out of 117 nursing homes we track in Nebraska for nurse hours. Shows adjusted nurse hours per resident per day benchmarked to the Nebraska average, with a ranking across 117 Nebraska facilities. More hours mean more direct care. The national average is about 3.5 hrs; below 3.0 is a red flag.Communities with the same value for a metric share the same rank. Rankings compare like with like: every nursing home we track in Nebraska that reports data for that category. Nursing homes without available data are excluded, so the pool size varies from metric to metric.Click the rank badge to see the full State ranking.Click here to see the full State ranking.Nurse hours — State benchmarkedThis nursing home is ranked 116th out of 117 nursing homes we track in Nebraska for nurse hours. Shows adjusted nurse hours per resident per day benchmarked to the Nebraska average, with a ranking across 117 Nebraska facilities. More hours mean more direct care. The national average is about 3.5 hrs; below 3.0 is a red flag.Communities with the same value for a metric share the same rank. Rankings compare like with like: every nursing home we track in Nebraska that reports data for that category. Nursing homes without available data are excluded, so the pool size varies from metric to metric.
2h 41m
5 of 6 metrics below Nebraska average
Daily care time per resident, by role
NE average · US = national average
Registered nurse (RN) RNs hold the highest nursing license and can assess residents, interpret test results, and direct care plans. More RN hours per day often signals stronger clinical oversight and faster response to health changes. All 8 are the facility's own employees; no agency contractors work in this role.8 staff · 7.3-hour shifts
44m↑ 2% · NE 43mThis facility: 44m per resident per day, 2% above the Nebraska average of 43m (among Nebraska facilities reporting a recent figure).
US average: 41m.Green: 5% or more better than the state average. Yellow: within 5%. Red: 5% or more worse.US 41m
LPN / LVN Licensed Practical Nurses (LPNs) or Licensed Vocational Nurses (LVNs) deliver routine hands-on care — medication administration, wound dressing, and monitoring vital signs. They work under RN supervision and make up a large share of daily bedside care. 9 total: 5 of the facility's own employees and 4 agency contractors.9 staff · 9.6-hour shifts
18m↓ 59% · NE 43mThis facility: 18m per resident per day, 59% below the Nebraska average of 43m (among Nebraska facilities reporting a recent figure).
US average: 52m.Green: 5% or more better than the state average. Yellow: within 5%. Red: 5% or more worse.US 52m
Certified nursing assistant Certified Nurse Aides (CNAs) provide the most direct day-to-day assistance: bathing, dressing, feeding, and mobility. Nurse aide hours are typically the largest staffing category and directly affect residents' quality of life. 54 total: 27 of the facility's own employees and 27 agency contractors.54 staff · 7.1-hour shifts
1h 39m↓ 40% · NE 2h 46mThis facility: 1h 39m per resident per day, 40% below the Nebraska average of 2h 46m (among Nebraska facilities reporting a recent figure).
US average: 2h 20m.Green: 5% or more better than the state average. Yellow: within 5%. Red: 5% or more worse.US 2h 20m
Physical therapist Hours per resident per day provided by licensed Physical Therapists (PTs) or PT Assistants. PT services help residents recover mobility after injury or illness and are especially important for post-acute (short-stay) rehabilitation.
0m↓ 100% · NE 3mThis facility: 0m per resident per day, 100% below the Nebraska average of 3m (among Nebraska facilities reporting a recent figure).
US average: 4m.Green: 5% or more better than the state average. Yellow: within 5%. Red: 5% or more worse.US 4m
Total nursing, weekends Combined nursing hours (RN + LPN + Nurse Aide) per resident per day on weekends. Staffing often drops on weekends — this figure reveals whether the facility maintains adequate coverage outside of weekday hours.RN + LPN + aide · Sat–Sun
2h 10m↓ 40% · NE 3h 37mThis facility: 2h 10m per resident per day, 40% below the Nebraska average of 3h 37m (among Nebraska facilities reporting a recent figure).
US average: 3h 26m.Green: 5% or more better than the state average. Yellow: within 5%. Red: 5% or more worse.US 3h 26m
RN, weekends Registered nurse hours specifically on weekends. Facilities sometimes reduce RN presence on Saturdays and Sundays — a low weekend RN figure compared to weekday hours can indicate reduced clinical oversight when most administrative staff are absent.Sat–Sun
19m↓ 33% · NE 29mThis facility: 19m per resident per day, 33% below the Nebraska average of 29m (among Nebraska facilities reporting a recent figure).
US average: 28m.Green: 5% or more better than the state average. Yellow: within 5%. Red: 5% or more worse.US 28m
Headcount
Total staffEvery person who worked here at any point in the quarter, employees and contractors. It is not how many are on site at once: that is the "on an average day" figure.111
79 employees · 32 contractors · 24 on an average day Staff per resident111 total staff / 45 residents. Residents: CMS Long-Term Care Facility Characteristics (data as of Jun 2026); staff: CMS Payroll-Based Journal (Q4 2025).Residents and staff come from two different CMS releases, so the two counts can be a few months apart.2.47 : 1↑ 25% · NE 1.97This facility: 2.47 staff per resident, 25% above the Nebraska average of 1.97 (among Nebraska facilities reporting a recent figure).Green: 5% or more better than the state average. Yellow: within 5%. Red: 5% or more worse.
111 staff ÷ 45 residents See full Nebraska ranking →Average shiftAverage hours one staff member works on a day they are on shift, across every role.7.1 h↓ 9% · NE 7.8 hThis facility: 7.1 h, 9% below the Nebraska average of 7.8 h (among Nebraska facilities reporting a recent figure).Green: 5% or more better than the state average. Yellow: within 5%. Red: 5% or more worse.
15,565 staff hours this quarter See full Nebraska ranking →
93.3%
of staff hours were worked by the facility's own employees
Why it matters: employees work here week after week and get to know each resident's routines and needs. Agency contractors often rotate between facilities, so a higher employee share usually means more consistent care.
Bed count
A smaller, more intimate setting that may offer a quieter environment and closer staff-resident interactions.50Rank#92 / 130Bed count — State benchmarkedThis nursing home is ranked 92nd out of 130 nursing homes we track in Nebraska for bed count. Shows this facility's certified or reported bed count compared to other Nebraska facilities. Larger communities may offer more amenities, programs, and on-site services for residents and families.Communities with the same value for a metric share the same rank. Rankings compare like with like: every nursing home we track in Nebraska that reports data for that category. Nursing homes without available data are excluded, so the pool size varies from metric to metric.Click the rank badge to see the full State ranking.Click here to see the full State ranking.Bed count — State benchmarkedThis nursing home is ranked 92nd out of 130 nursing homes we track in Nebraska for bed count. Shows this facility's certified or reported bed count compared to other Nebraska facilities. Larger communities may offer more amenities, programs, and on-site services for residents and families.Communities with the same value for a metric share the same rank. Rankings compare like with like: every nursing home we track in Nebraska that reports data for that category. Nursing homes without available data are excluded, so the pool size varies from metric to metric.
Smaller home
· May offer a more intimate, personalized care environment.
Walk Score
Car-dependent. A few nearby services may be reachable on foot, but most trips require transportation.Rank#100 / 138Walk Score — State benchmarkedThis nursing home is ranked 100th out of 138 nursing homes we track in Nebraska for walk score. Shows how walkable this facility's neighborhood is compared to the average walk score across Nebraska facilities. Higher scores benefit residents, families, and staff.Communities with the same value for a metric share the same rank. Rankings compare like with like: every nursing home we track in Nebraska that reports data for that category. Nursing homes without available data are excluded, so the pool size varies from metric to metric.Click the rank badge to see the full State ranking.Click here to see the full State ranking.Walk Score — State benchmarkedThis nursing home is ranked 100th out of 138 nursing homes we track in Nebraska for walk score. Shows how walkable this facility's neighborhood is compared to the average walk score across Nebraska facilities. Higher scores benefit residents, families, and staff.Communities with the same value for a metric share the same rank. Rankings compare like with like: every nursing home we track in Nebraska that reports data for that category. Nursing homes without available data are excluded, so the pool size varies from metric to metric.
33/ 100
Occupancy rate
Occupancy lower than 85% suggests more openings may be available.Rank#54 / 125Occupancy rate — State benchmarkedThis nursing home is ranked 54th out of 125 nursing homes we track in Nebraska for occupancy. Shows this facility's occupancy rate versus the Nebraska average, with its Statewide rank out of 125. Higher occupancy signals strong local demand and financial stability.Communities with the same value for a metric share the same rank. Rankings compare like with like: every nursing home we track in Nebraska that reports data for that category. Nursing homes without available data are excluded, so the pool size varies from metric to metric.Click the rank badge to see the full State ranking.Click here to see the full State ranking.Occupancy rate — State benchmarkedThis nursing home is ranked 54th out of 125 nursing homes we track in Nebraska for occupancy. Shows this facility's occupancy rate versus the Nebraska average, with its Statewide rank out of 125. Higher occupancy signals strong local demand and financial stability.Communities with the same value for a metric share the same rank. Rankings compare like with like: every nursing home we track in Nebraska that reports data for that category. Nursing homes without available data are excluded, so the pool size varies from metric to metric.
82%This home usually has availability
Based on 41 residents and 50 beds. Source: state inspection report (Jun 2018)
Higher than the Nebraska average: 74.9%
Avg. Length of Stay
Average number of days residents stay at this facility, based on CMS cost report data. Shorter stays often reflect post-acute or rehab care; longer stays reflect long-term care.
328days
About This Community
License Details
Facility TypeNursing Home
CountyMadison
CMS Certification Number285208
Certification TypeCertification
Ownership & Operating Entity
Community Pride Care Center is administered by Administrator Shelley Mcintosh.
Owner NameCity Of Battle Creek
Therapy & Rehabilitation
1 service
Restorative Therapy Services
Staffing & Medical
1 service
Medication ManagementSupport with organizing, administering, and monitoring medicines can help prevent missed or incorrect doses.
Additional Services
3 services
Laundry & Linen
HousekeepingListed as: Assistance with housekeeping (assisted living)
Transportation
Contact Information
Fax(402) 675-1003
Additional Policies & Features
Pets not allowed
Amenities & Lifestyle
Outdoor Seating
Gazebo
Snacks Available 24/7
Laundry
Faith & Spiritual Life
In-House Church Services
Room Accommodations
Room Types
Private Room
This profile shows two inspection records, and their totals often differ.
Inspection History and the Inspection Scorecard below are state data — the
figures the state publishes and the state inspection reports we hold on file —
covering the entire facility. CMS Health Inspection History covers only this
home's Medicare and Medicaid-certified nursing beds, from federal certification
surveys.
Inspection History
In Nebraska, the Department of Health and Human Services, Division of Public Health conducts regular inspections to ensure nursing and assisted living facilities meet state and federal standards.
Since 2011 · 15 years of dataThese figures come from state-published data and the state inspection reports we hold on file. The period covered can vary depending on document availability. Includes all inspection records for this property, which could include management/ownership changes.52 deficiencies15 inspections
Inspection Scorecard
This scorecard compares key inspection, deficiency, and complaint metrics at this facility against the Nebraska state average. Metrics rated ≥15% worse than average are highlighted in red; those ≥15% better are highlighted in green.
Since 2011 vs. Nebraska state average
Overall vs. NE average
1 Worse
Metrics worse than Nebraska average:
• Deficiencies per inspection (30% above)
1 At Avg
Metrics at Nebraska average:
• Total deficiencies (at NE avg)
0 Better
No metrics in this bucket.
Deficiencies Deficiencies are formal regulatory issues recorded during state inspections.
This Facility
NE Average
vs. NE Avg
Total deficiencies Formal regulatory issues recorded by inspectors across all inspection types.
52
52.0
This facility has total deficiencies in line with the Nebraska average (52 vs. NE avg 52).— At avg
Deficiencies per inspection Average deficiencies per inspection.
3.5
2.7
This facility has 30% more deficiencies per inspection than a typical Nebraska nursing home (3.5 vs. NE avg 2.7).↑ 30% worse
Inspections State inspections evaluate whether the facility meets health and safety standards.
This Facility
NE Average
vs. NE Avg
Total inspections Combined count of all inspections conducted at this facility.
15
15.0
This facility has total inspections in line with the Nebraska average (15 vs. NE avg 15).— At avg
Since 2023 · 3 years of data · Last health inspection Dec 2025
Federal inspection data published by CMS, covering this home's Medicare and/or
Medicaid-certified skilled-nursing/nursing beds only.
Total health inspections4State avg 4.6
Total health citations
9Rank#23 / 124Health citations — State benchmarkedThis nursing home is ranked 23rd out of 124 nursing homes we track in Nebraska for health citations. Shows this facility's total health deficiency citations benchmarked to the Nebraska State average, with a ranking across all 124 NE facilities. Lower citation counts earn a better rank.Communities with the same value for a metric share the same rank. Rankings compare like with like: every nursing home we track in Nebraska that reports data for that category. Nursing homes without available data are excluded, so the pool size varies from metric to metric.Click the rank badge to see the full State ranking.Click here to see the full State ranking.Health citations — State benchmarkedThis nursing home is ranked 23rd out of 124 nursing homes we track in Nebraska for health citations. Shows this facility's total health deficiency citations benchmarked to the Nebraska State average, with a ranking across all 124 NE facilities. Lower citation counts earn a better rank.Communities with the same value for a metric share the same rank. Rankings compare like with like: every nursing home we track in Nebraska that reports data for that category. Nursing homes without available data are excluded, so the pool size varies from metric to metric.
State avg 18.8 (52% better than State average)
Citations per inspection
2.25Rank#11 / 124Citations per inspection — State benchmarkedThis nursing home is ranked 11th out of 124 nursing homes we track in Nebraska for citations per inspection. Shows average deficiency citations per CMS inspection for this facility versus the Nebraska mean across 124 facilities with citation data. Lower is better.Communities with the same value for a metric share the same rank. Rankings compare like with like: every nursing home we track in Nebraska that reports data for that category. Nursing homes without available data are excluded, so the pool size varies from metric to metric.Click the rank badge to see the full State ranking.Click here to see the full State ranking.Citations per inspection — State benchmarkedThis nursing home is ranked 11th out of 124 nursing homes we track in Nebraska for citations per inspection. Shows average deficiency citations per CMS inspection for this facility versus the Nebraska mean across 124 facilities with citation data. Lower is better.Communities with the same value for a metric share the same rank. Rankings compare like with like: every nursing home we track in Nebraska that reports data for that category. Nursing homes without available data are excluded, so the pool size varies from metric to metric.
State avg 4.07 (45% better than State average)
Citation severity
100% corrected
9 of 9 citations corrected
Bar = mix of this home's 9 citations, not a state comparison
Lighter shade = corrected
CriticalJ–L
0State avg 0.2 (100% better than State average)
Immediate jeopardy
SeriousG–I
0State avg 0.5 (100% better than State average)
Actual harm
ModerateD–F
9State avg 17.8 (49% better than State average)
No harm, more than minimal risk
MinorA–C
0State avg 0.3 (100% better than State average)
No harm, minimal risk
Citations history
Most recent first
Dec 31, 20253 citations
Infection Control moderate citation
Corrected
Infection Control moderate citation
Corrected
Pharmacy moderate citation
Corrected
Nov 13, 20241 citation
Infection Control moderate citation
Corrected
Apr 01, 20242 citations
Abuse/Neglect moderate citation
Corrected
Quality of Care moderate citation
Corrected
Nov 02, 20233 citations
Abuse/Neglect moderate citation
Corrected
Care Planning moderate citation
Corrected
Care Planning moderate citation
Corrected
Top deficiency categories
Share of 9 citations
Infection Control3 deficiencies (33%)
Resident Assessment & Care Planning2 deficiencies (22%)
Abuse, Neglect & Exploitation2 deficiencies (22%)
Quality of Life & Care1 deficiency (11%)
Pharmacy Services1 deficiency (11%)
How citations are counted
Health citations are formal notices following inspections when they fail to comply with safety and care standards.
6 of 9 citations resulted from standard inspections; 2 of 9 resulted from complaint investigations; and 1 of 9 came from combined inspections (standard and complaint).
Includes all CMS health inspection records for this property, which could include management/ownership changes.
Source
Data sourced from CMS Health Deficiencies reports, which cover the Medicare and/or Medicaid-certified skilled-nursing and nursing beds and no other part of the community. Citation severity codes range from A (least serious) to L (most serious).
Immediate Jeopardy (J-L) citations indicate situations where the facility's noncompliance has placed residents at risk of death or serious harm.
Penalties and fines
Federal penalties imposed by CMS for regulatory violations, including civil money penalties (fines)
and denials of payment for new Medicare/Medicaid admissions.
Source: CMS Penalties Database
No penalties in the past 3 years
No civil money penalties or payment denials were reported in the last 3 years.
Quality of care over time
These measures show how residents usually do over time at this home, based on health outcomes and preventive care.
High-risk clinical events scoreA composite score based on pressure ulcers, falls with injury, weight loss, walking ability decline, and activities of daily living decline.7.1
29% better than Nebraska average
Nebraska average: 10.1
Functional decline scoreA composite score based on activities of daily living decline, walking ability decline, and incontinence.19.1
9% better than Nebraska average
Nebraska average: 21.0
Long-stay resident measures
Significantly above averageNebraska avg: 2.8CMS star rating based on long-stay quality measure performance. 5 stars = significantly above average, 1 star = significantly below average.
Need for Help with Daily Activities Increased Percent of long-stay residents whose need for help with daily activities has increased21.1%
11% worse than Nebraska average
Nebraska average: 19.0%
Walking Ability Worsened Percent of long-stay residents whose ability to move independently worsened10.1%
44% better than Nebraska average
Nebraska average: 18.2%
Low Risk Residents with Bowel/Bladder Incontinence Percent of low risk long-stay residents who lose control of their bowels or bladder25.9%
In line with Nebraska average
Nebraska average: 25.9%
Falls with Major Injury Percent of long-stay residents experiencing one or more falls with major injury0.6%
86% better than Nebraska average
Nebraska average: 4.5%
High Risk Residents with Pressure Ulcers Percent of long-stay high risk residents with pressure ulcers3.1%
24% better than Nebraska average
Nebraska average: 4.0%
Urinary Tract Infection Percent of long-stay residents with a urinary tract infection4.4%
56% worse than Nebraska average
Nebraska average: 2.8%
Lost Too Much Weight Percent of long-stay residents who lose too much weight0.8%
85% better than Nebraska average
Nebraska average: 5.1%
Depressive Symptoms Percent of long-stay residents who have depressive symptoms10.6%
148% worse than Nebraska average
Nebraska average: 4.3%
Antipsychotic Use Percent of long-stay residents who received an antipsychotic medication2.7%
87% better than Nebraska average
Nebraska average: 20.7%
Pneumococcal Vaccine Percent of long-stay residents assessed and appropriately given the pneumococcal vaccine100.0%
8% better than Nebraska average
Nebraska average: 93.0%
Influenza Vaccine Percent of long-stay residents assessed and appropriately given the seasonal influenza vaccine100.0%
In line with Nebraska average
Nebraska average: 96.1%
Hospitalizations per 1,000 days Number of hospitalizations per 1,000 long-stay resident days.2.46
37% worse than Nebraska average
Nebraska average: 1.80
ED visits per 1,000 days Number of outpatient emergency department visits per 1,000 long-stay resident days.0.87
55% better than Nebraska average
Nebraska average: 1.95
Short-stay resident measures
Significantly above averageNebraska avg: 2.2CMS star rating based on short-stay quality measure performance. 5 stars = much above average, 1 star = much below average.
Pneumococcal VaccinePercent of short-stay residents assessed and appropriately given the pneumococcal vaccine100.0%
24% better than Nebraska average
Nebraska average: 80.9%
Antipsychotic medication increasePercent of short-stay residents who newly received an antipsychotic medication0.0%
100% better than Nebraska average
Nebraska average: 2.0%
Re-hospitalized after SNF stayPercentage of short-stay residents who were re-hospitalized after their nursing home admission.19.0%
9% better than Nebraska average
Nebraska average: 20.9%
Emergency department visitsPercentage of short-stay residents who had an outpatient emergency department visit.10.4%
10% better than Nebraska average
Nebraska average: 11.6%
Falls with major injuryPercentage of SNF residents who experience falls with major injury during their stay.0.0%
100% better than Nebraska average
Nebraska average: 0.8%
Ability to care for self at dischargePercentage of residents at or above expected ability to care for themselves at discharge.54.6%
In line with Nebraska average
Nebraska average: 53.7%
Successful return to home or communityRate of successful return to home or community from a skilled nursing facility.39.4%
22% worse than Nebraska average
Nebraska average: 50.6%
Breakdown by payment type
Medicare
51% of new residents, usually for short-term rehab.
Typical stay1 - 2 months
Private pay
38% of new residents, often for short stays.
Typical stay1 - 2 years
Medicaid
11% of new residents, often for long-term daily care.
Typical stay2 years
Facility Characteristics
Source: CMS Long-Term Care Facility Characteristics
(Data as of Jun 2026)
Total residents45
Medicare
5
11.1% of residents
Medicaid
15
33.3% of residents
Private pay or other
25
55.6% of residents
Programs & Services
Residents Group
Residents meet regularly to discuss policies, care quality, and activities
Active Resident Council
Organized group of residents that meets regularly to discuss facility policies, quality of life, and activities.
Financial Trends
Historical financial and operational data for Community Pride Care Center from 2012–2025, based on CMS SNF Cost Reports.
Includes all financial data for this property, which could include management/ownership changes.
Key figures below are for fiscal year ending in 06/2025.
Net Patient Income$268.0K↑ ~$495.2K vs 2024
Payroll Costs$3.4M↑ ~$2.7K vs 2024
Operating Margin5.1%↑ 9.5pp vs 2024
Financial Performance
Net patient revenueOperating expensesNet patient income
Payroll & Labor Costs
SalariesStaff salaries from the home's own payroll records.Wage CostsWage-related costs — benefits such as payroll taxes, health insurance and retirement. Together with salaries, these make up payroll.Contract LaborPay for temporary or agency staff. Counted under other operating costs, not payroll.
Payer Mix (percentage)
MedicareMedicaidPrivate Pay/Other
Metric
2012
2013
2014
2015
2016
2017
2018
2019
2020
2021
2022
2023
2024
2025
Occupancy %
97.0%
96.4%
89.1%
89.4%
89.2%
86.2%
79.5%
84.1%
91.6%
77.4%
76.2%
84.2%
84.8%
82.8%
Beds
47
47
47
47
47
50
50
50
50
50
50
50
50
50
Net Income
$243,981
$2,258
-$76,298
$101,242
-$169,674
-$454,134
-$386,325
-$318,159
-$120,682
-$534,354
-$283,222
-$440,384
-$152,845
$331,895
Gross Revenue
$2,904,665
$2,862,891
$2,812,704
$3,046,942
$2,994,014
$3,383,817
$3,446,057
$3,737,014
$4,019,378
$3,858,179
$4,081,033
$4,500,807
$5,132,200
$5,301,926
Operating Expenses
$2,646,257
$2,835,323
$2,877,542
$2,929,425
$3,149,490
$3,831,880
$3,831,040
$4,021,029
$4,366,283
$4,593,703
$4,601,200
$5,014,722
$5,359,386
$5,033,927
Net Patient Income
$258,408
$27,568
-$64,838
$117,517
-$155,476
-$448,063
-$384,983
-$284,015
-$346,905
-$735,524
-$520,167
-$513,915
-$227,186
$267,999
Net Patient Revenue
$2,904,665
$2,862,891
$2,812,704
$3,046,942
$2,994,014
$3,383,817
$3,446,057
$3,737,014
$4,019,378
$3,858,179
$4,081,033
$4,500,807
$5,132,200
$5,301,926
Payroll Costs
$1,831,173
$1,881,927
$1,938,989
$1,924,165
$2,060,691
$2,292,150
$2,307,758
$2,422,321
$2,538,800
$2,895,423
$2,695,287
$2,735,309
$3,396,400
$3,399,136
Operating Margin %
8.9%
1.0%
-2.3%
3.9%
-5.2%
-13.2%
-11.2%
-7.6%
-8.6%
-19.1%
-12.8%
-11.4%
-4.4%
5.1%
Medicare %
5.2%
5.4%
7.3%
8.6%
5.4%
7.0%
7.5%
7.4%
4.1%
5.9%
8.0%
4.1%
7.2%
6.6%
Medicaid %
44.2%
36.2%
34.9%
31.5%
36.2%
35.7%
31.6%
33.4%
35.3%
37.0%
34.1%
29.1%
32.7%
25.0%
Private %
50.6%
58.4%
57.8%
59.9%
58.4%
57.4%
60.9%
59.2%
60.6%
57.0%
57.9%
66.8%
60.1%
68.3%
Net Patient Revenue/Day
$174
$173
$184
$199
$195
$218
$238
$244
$240
$273
$294
$293
$331
$351
Cost/Day
$159
$171
$188
$191
$205
$247
$264
$262
$260
$325
$331
$326
$345
$333
Avg Length of Stay
203.4 days
165.4 days
235.2 days
164.9 days
156.5 days
135.9 days
133.0 days
144.7 days
328.7 days
247.8 days
604.5 days
591.0 days
360.9 days
328.4 days
Finances and operations
Based on CMS SNF Cost Report for fiscal year ending in 06/2025.
Government
Operated by city and county authorities.
Net patient revenueNet patient revenue — what the home actually collects for resident care, after contractual allowances, bad debt and discounts are subtracted from its gross charges (CMS cost report, Worksheet G-3). It covers resident care only; money the home earns from other sources is shown separately as "Other income."
$5.3MFiscal year ending 06/2025
Net patient incomeNet patient income: net patient revenue minus the home's total operating expenses. A positive figure means it earns more from resident care than it spends to deliver it; a negative figure means the opposite. It excludes non-operating "other income."
$268.0KFiscal year ending 06/2025
Government Operated by city and county authorities.
Net patient revenueNet patient revenue — what the home actually collects for resident care, after contractual allowances, bad debt and discounts are subtracted from its gross charges (CMS cost report, Worksheet G-3). It covers resident care only; money the home earns from other sources is shown separately as "Other income."
$5.3MFiscal year ending 06/2025Rank#67 / 113Net patient revenue — State benchmarkedThis nursing home is ranked 67th out of 113 nursing homes we track in Nebraska. Shows this facility's net patient revenue compared to the Nebraska average, among facilities reporting a recent fiscal year. Higher revenue generally means more resources for staffing and capital — read alongside Payroll %.Communities with the same value for a metric share the same rank. Rankings compare like with like: every nursing home we track in Nebraska that reports data for that category. Nursing homes without available data are excluded, so the pool size varies from metric to metric.Net patient revenue — State benchmarkedThis nursing home is ranked 67th out of 113 nursing homes we track in Nebraska. Shows this facility's net patient revenue compared to the Nebraska average, among facilities reporting a recent fiscal year. Higher revenue generally means more resources for staffing and capital — read alongside Payroll %.Communities with the same value for a metric share the same rank. Rankings compare like with like: every nursing home we track in Nebraska that reports data for that category. Nursing homes without available data are excluded, so the pool size varies from metric to metric.
Net patient incomeNet patient income: net patient revenue minus the home's total operating expenses. A positive figure means it earns more from resident care than it spends to deliver it; a negative figure means the opposite. It excludes non-operating "other income."
$268.0KFiscal year ending 06/2025
Other incomeMoney the home earns outside of resident care — such as investments, grants, rentals and other non-operating sources (CMS cost report, Worksheet G-3). It is tracked separately from net patient revenue: it is not part of that figure, and it is not included in net patient income.
$69.6KFiscal year ending 06/2025
Payroll costsStaff salaries plus wage-related costs — benefits such as payroll taxes, health insurance and retirement — from the home's own accounting records (CMS cost report, Worksheet A). Contract or agency labor is counted separately, under other operating costs.Rank#62 / 113Payroll costs — State benchmarkedThis nursing home is ranked 62nd out of 113 nursing homes we track in Nebraska. Shows total staff payroll — salaries plus wage-related benefits — benchmarked to the Nebraska average, among facilities reporting a recent fiscal year. Higher payroll relative to peers often signals better staffing and less reliance on contract labor.Communities with the same value for a metric share the same rank. Rankings compare like with like: every nursing home we track in Nebraska that reports data for that category. Nursing homes without available data are excluded, so the pool size varies from metric to metric.Payroll costs — State benchmarkedThis nursing home is ranked 62nd out of 113 nursing homes we track in Nebraska. Shows total staff payroll — salaries plus wage-related benefits — benchmarked to the Nebraska average, among facilities reporting a recent fiscal year. Higher payroll relative to peers often signals better staffing and less reliance on contract labor.Communities with the same value for a metric share the same rank. Rankings compare like with like: every nursing home we track in Nebraska that reports data for that category. Nursing homes without available data are excluded, so the pool size varies from metric to metric.
$3.4MFiscal year ending 06/2025
64.1% of net patient revenue
Payroll as a share of revenue: staff salaries and wage-related benefits divided by net patient revenue. A higher figure means more of each revenue dollar goes to staff pay.Rank#44 / 113Payroll % of net patient revenue — State benchmarkedThis nursing home is ranked 44th out of 113 nursing homes we track in Nebraska. Shows payroll as a percentage of net patient revenue versus the Nebraska average, among facilities reporting a recent fiscal year. Below 25% may signal understaffing or heavy agency use — read with Staffing ratings.Communities with the same value for a metric share the same rank. Rankings compare like with like: every nursing home we track in Nebraska that reports data for that category. Nursing homes without available data are excluded, so the pool size varies from metric to metric.Payroll % of net patient revenue — State benchmarkedThis nursing home is ranked 44th out of 113 nursing homes we track in Nebraska. Shows payroll as a percentage of net patient revenue versus the Nebraska average, among facilities reporting a recent fiscal year. Below 25% may signal understaffing or heavy agency use — read with Staffing ratings.Communities with the same value for a metric share the same rank. Rankings compare like with like: every nursing home we track in Nebraska that reports data for that category. Nursing homes without available data are excluded, so the pool size varies from metric to metric.
Other operating costsEverything it costs to run the home apart from payroll — food, utilities, supplies, maintenance, contract labor and administration. Calculated as total operating expense minus payroll (staff salaries and wage-related benefits).
$1.6MFiscal year ending 06/2025
Total costsThe home's total operating expense for the year — all the costs of running it, salaries included (CMS cost report, Worksheet G-3).
$5.0MFiscal year ending 06/2025
Certification details
License Number:285208
Owner Name:City Of Battle Creek
Rural vs. Urban:Rural
County:Madison
Type of Control:Government — Operated by city and county authorities.
Source: Centers for Medicare & Medicaid Services (CMS) and State data
How we calculate these figures
We use the home's most recent CMS SNF Cost Report — the annual financial statement every Medicare- and Medicaid-certified nursing home is required to file — to show how it earns and spends on resident care.
This includes
Net patient revenue — what the home collects for resident care after contractual allowances, bad debt and discounts.
Payroll — staff salaries plus wage-related benefits. Contract and agency labor is counted separately, under other operating costs.
Net patient income — what's left after the home's total operating expenses.
How we calculate net patient income and payroll %
Net patient income is net patient revenue minus the home's total operating expenses. Payroll % is payroll divided by net patient revenue — the share of each revenue dollar that goes to staff pay.
Net patient revenue vs. other income
Net patient revenue is money earned from resident care only. Anything the home earns outside of care — investments, grants, rentals and other non-operating sources — is reported separately as other income. Other income is not part of net patient revenue, and it is not included in net patient income.
Who this home usually serves
TYPE OF STAY
Mostly short-term rehab stays
Most residents typically stay for a few weeks or months before returning home or moving on.
Most new residents arrive under Medicare (51% of admissions), and a typical Medicare stay runs around 1 - 2 months.
Admissions
47 total
Coverage residents most often arrive under.
Medicare51%
Private pay38%
Medicaid11%
Discharges
46 total
Coverage residents most often leave under.
Medicare37%
Private pay41%
Medicaid22%
How we assess these insights
We analyze official CMS data on admissions and discharges to understand the types of residents a nursing home most often serves.
This includes
Medicare, Medicaid, and private-pay admissions and discharges
Number of nights covered by each payment type
Typical length of stay
How length of stay is calculated
Average length of stay comes from the facility's Medicare cost report: total resident days in the year divided by total discharges, across all residents and payment types. Homes that mostly provide long-term care show long averages, because few residents leave in a given year.
Places of interest near Community Pride Care Center
0.0 miles from city center Estimated distance in miles from Battle Creek's city center to Community Pride Care Center's address, calculated via Google Maps.
Quick search
Calculate Travel Distance to Community Pride Care Center
Add your location
Compare Nursing Homes around the area
Info below is compiled from CMS reports & the NE Dept. of Health & Human Services (DHHS), senior community websites & trusted data sources such as Walk Score & BBB.
Communities are listed from highest-ranked to lowest-ranked based on our methodology.
The facility name. Click to view the full profile page on Assisted Living Magazine, including photos, services, and contact info.
CMS (Centers for Medicare & Medicaid Services, the federal agency that regulates nursing homes) Overall 5-star rating — a composite of Health Inspection, Staffing, and Quality Measures scores. 5 stars = top 10% nationally. 1 star = bottom 10%. The single most important number to start with when comparing facilities.
Care Types in This TableAL (Assisted Living):
Housing with help for daily activities like bathing, dressing, and medication, without 24-hour skilled nursing.
NH (Nursing Home):
24/7 skilled nursing care for residents with complex, ongoing medical needs.
SNF (Skilled Nursing Facility):
Round-the-clock nursing care, often for recovery after surgery, injury, or illness.
MC (Memory Care):
Secured, specialized care for people living with Alzheimer's or dementia.
RC (Respite Care):
Short-term temporary care that gives family caregivers a break.
IL (Independent Living):
Community living with dining, activities, and transportation for active seniors who need little personal care.
HC (Home Care):
Professional care delivered in the person's own home, from companionship to skilled nursing.
HOS (Hospice Care):
Comfort-focused care for those with a terminal illness, prioritizing quality of life over treatment.
PC (Palliative Care):
Comfort-focused care for serious illness at any stage, including alongside curative treatment.
Neighborhood or city area where the facility is located. Proximity to family, hospitals, and green space matters for both quality of life and ease of visitation. Consider drive time and transit access when evaluating location.
Licensed bed capacity. Larger facilities (300+ beds) often have more specialized programs but can feel institutional. Smaller homes (under 150 beds) tend to deliver more personalized care. Compare with Avg Res/Day to understand how full the facility typically runs.
Percentage of licensed beds filled on an average day. Color indicates financial health: green (90%+) = operationally strong, typically profitable. Amber (80–89%) = stable but leaving revenue on the table. Orange (70–79%) = financial strain likely, may struggle with fixed costs. Red (<70%) = significant distress, closure or ownership change risk increases sharply.
This facility's occupancy rate compared to the statewide average for similar facilities. A positive number means above-average demand. Facilities running 5%+ above the state average are typically the most sought-after in their market — a strong proxy for reputation.
CMS-adjusted total nurse hours per resident per day (RN + LPN + CNA combined). The national average is approximately 3.5 hrs. Higher is better — more direct care time per resident. Below 3.0 is a red flag. CMS weights RN hours more heavily because RNs handle complex clinical decisions that CNAs cannot.
CMS Health Inspection star rating (1–5 stars), based on the 3 most recent annual state surveys plus any complaint investigations. This is the hardest rating to manipulate — it reflects real surveyor findings on-site. 5 stars = fewest deficiencies found. 1 star = most. It carries the heaviest weight in the Overall CMS rating.
CMS Staffing star rating (1–5 stars), based on daily nurse staffing hours submitted to CMS via verified payroll data. Compares RN, LPN, and CNA coverage relative to resident acuity level. 5 stars = well above expected staffing. Weekend staffing is evaluated separately, as that's where many facilities quietly reduce coverage.
CMS Quality Measures star rating (1–5 stars), based on 15 clinical outcome metrics including fall rates, pressure ulcers, antipsychotic drug use, and hospital readmissions. Captures actual resident health outcomes, not just compliance. High QM combined with low Health Inspection scores can indicate a facility with strong care but weak documentation practices.
Registered Nurse hours per resident/day compared to the statewide average. RNs are the highest-skilled nursing staff — they assess residents, manage medications, and respond to emergencies. A value of +50% means RN coverage is 50% above the state norm. Negative values are a concern for residents with complex or acute medical needs.
Total nursing staff hours (RN + LPN + CNA combined) per resident/day vs. the statewide average. A broader measure than RN vs State — it captures the entire care team. A facility can have high total staffing but low RN hours, meaning more aides and fewer nurses. Read both columns together for the full picture.
Total dollar amount of federal monetary fines (civil money penalties) issued by CMS in the past 3 years. Fines are only levied for serious violations — typically actual harm to residents, repeated uncorrected deficiencies, or systemic non-compliance. Even a single fine is noteworthy. Multiple fines strongly suggest a pattern, not isolated incidents.
Total health deficiency citations from the most recent standard inspection cycle. Minor citations (scope A–C) are common and often administrative in nature. Higher counts aren't always disqualifying, but should be read alongside Severe Citations to understand actual harm levels. Under 10 is strong for a large facility; 30+ warrants a closer look.
Average deficiency citations per CMS inspection (survey) in the reporting window — total citations divided by the number of inspections. Lower is better; compare alongside total Citations and Severe Citations for context.
Citations at CMS scope/severity level G or higher — G–I means actual harm occurred; J–L means residents were placed in immediate jeopardy. (D–F is potential for harm only). Examples include unaddressed falls, medication errors causing injury, neglect, or abuse.
Average number of residents in the building on any given day, derived from annual census data. Reflects true operating scale — a 400-bed facility running 200 residents/day operates very differently from one at 390. Higher resident counts generally mean more funded staffing hours.
Better Business Bureau rating (A+ to F). Reflects complaint history, business transparency, and how family disputes were resolved. A+ means no significant unresolved complaints. A blank (—) means the facility isn't BBB-accredited, which is common for healthcare providers and not necessarily a negative signal.
Walk Score® (0–100). Measures walkability of the surrounding area. 90–100 = Walker's Paradise. 70–89 = Very Walkable. 50–69 = Somewhat Walkable. Below 50 = Car-Dependent. Higher scores benefit family visitors, resident outings, and staff commuting.
The licensed owner or operator of record filed with CMS — the individual or organization legally accountable for the facility. Searching the operator name across other facilities can reveal chain or multi-site ownership, which matters: chain-operated homes tend to have more variable quality outcomes than independently run facilities.
What the home actually collects for resident care, after contractual allowances, bad debt and discounts — not gross billings. Taken from the latest complete annual cost report, so it is comparable across homes reporting the same period. Revenue alone doesn't indicate care quality, but it funds staffing and capital reinvestment. Pair with Payroll %. Figures are from each facility's most recent complete fiscal year — hover a value for the exact year; a * marks homes that report an older period than most facilities.
Staff salaries plus wage-related benefits from the latest complete annual cost report. Contract and agency labour is counted separately, under other operating costs, so a home leaning on agency staff can show a low figure here. Payroll is the cost most directly tied to care quality — compare with Payroll % for full context. Figures are from each facility's most recent complete fiscal year — hover a value for the exact year; a * marks homes that report an older period than most facilities.
Payroll as a share of NET PATIENT REVENUE (not gross revenue). Both figures come from the same cost-report year. A higher figure means more of each revenue dollar goes to staff pay. Read with the Staffing star rating to judge whether spend translates into coverage — and note that homes whose patient revenue covers only part of their operation can read implausibly high. The Nebraska average is: 61.5% Figures are from each facility's most recent complete fiscal year — hover a value for the exact year; a * marks homes that report an older period than most facilities.
CMS Certification Number: the unique federal identifier for this skilled nursing provider.
Rank badges are statewide and care-type specific: each nursing home is ranked against every other NE nursing home we track that reports that metric, not just the 5 on this page. See how we rank facilities
Frequently Asked Questions about Community Pride Care Center
Who is the owner of Community Pride Care Center?
Community Pride Care Center is legally operated by City Of Battle Creek, and administered by Administrator Shelley Mcintosh.
Is Community Pride Care Center in a walkable area?
Community Pride Care Center has a walk score of 33. Car-dependent. A few nearby services may be reachable on foot, but most trips require transportation.
What is the occupancy rate at Community Pride Care Center?
Community Pride Care Center's occupancy is 82%.
Are pets allowed at Community Pride Care Center?
No, Community Pride Care Center has a no-pet policy.
What is the best email address for Community Pride Care Center?
The team at Community Pride Care Center can be reached at communitypride@outlook.com.
Is Community Pride Care Center a government-operated facility?
Community Pride Care Center is a government-operated nursing facility in NE.
Who is the administrator of Community Pride Care Center?
Administrator Shelley Mcintosh is the administrator of Community Pride Care Center.










 Every person who worked here at any point in the quarter, employees and contractors. It is not how many are on site at once: that is the "on an average day" figure.
111
79 employees · 32 contractors · 24 on an average day
Every person who worked here at any point in the quarter, employees and contractors. It is not how many are on site at once: that is the "on an average day" figure.
111
79 employees · 32 contractors · 24 on an average day 






