


Total staff
101
Employees
99
Contractors
2
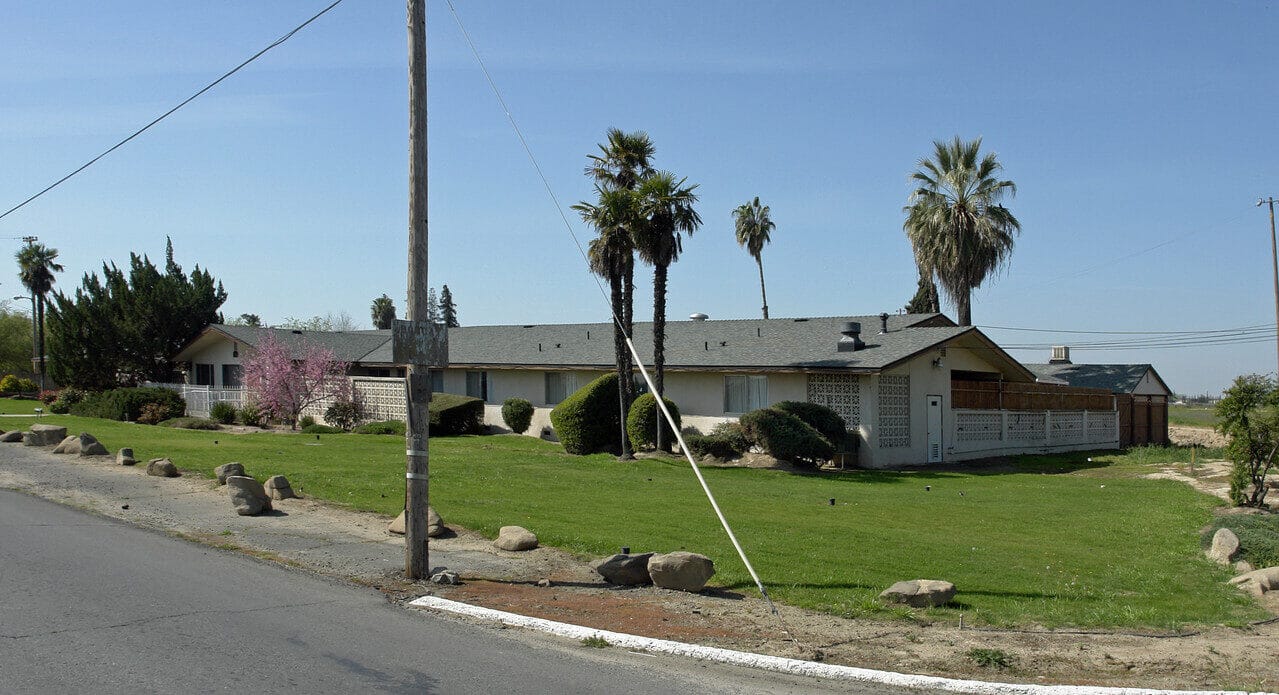
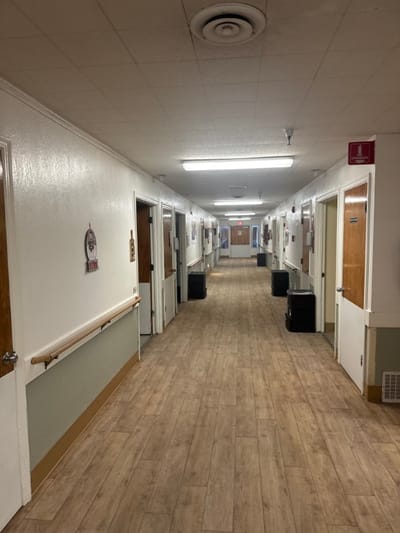
Located in the serene residential area of Fresno, CA, Countryside Care Center is an outstanding community that offers short-term rehabilitation and long-term care. The community also specializes in memory care, providing top-notch care tailored to their special needs 24/7. Medicare and Medicaid are also accepted in the community to ease residents’ financial challenges.
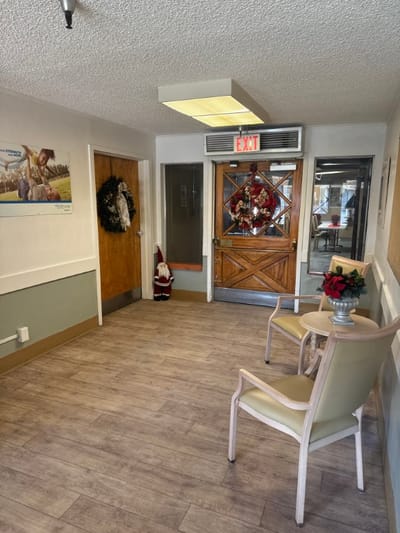
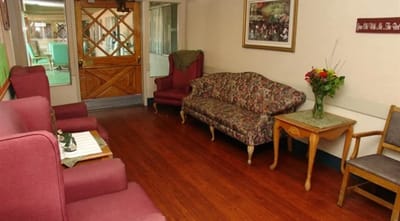
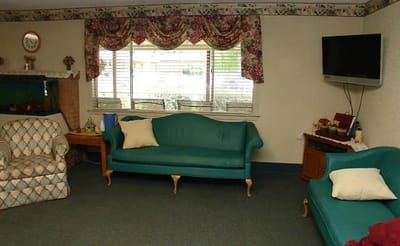
Engaging recreational activities and stimulating programs are also conducted so residents can interact with their surroundings and live actively. Mealtimes are also something to look forward to, with delicious and healthy meals that cater to nutritional needs and preferences. With its cozy and welcoming setting, residents receive the utmost care and attention they deserve to live comfortably in their golden years.
| Staff type | Hours / Day / Resident | vs state avg |
|---|---|---|
|
Registered Nurse (RN)
| 21m per day | ▼ 46% State avg: 39m per day · National avg: 41m per day |
|
LPN / LVN
| 55m per day | ▼ 25% State avg: 1h 13m per day · National avg: 52m per day |
|
Nurse Aide
| 2h 39m per day | ■ Avg State avg: 2h 39m per day · National avg: 2h 21m per day |
|
Weekend Total Nursing
| 3h 23m per day | ▼ 17% State avg: 4h 5m per day · National avg: 3h 26m per day |
|
Physical Therapist
| 3m per day | ▼ 40% State avg: 5m per day · National avg: 4m per day |
|
Weekend RN
| 17m per day | ▼ 43% State avg: 30m per day · National avg: 29m per day |
Reporting period: October 1 – December 31, 2025 (Q4 2025). Source: CMS Payroll-Based Journal report.
Manages medical care and health needs.
Assists with medical care and medications.
Helps with daily care and mobility.
Total hours from contractors
65 contractor hours this quarter
| Certified Nursing Assistant | 44 | 0 | 44 | 13,848 | 92 | 100% | 7.2 |
| Licensed Practical Nurse | 20 | 0 | 20 | 3,749 | 92 | 100% | 7.8 |
| RN Director of Nursing | 2 | 0 | 2 | 1,039 | 66 | 72% | 8 |
| Registered Nurse | 5 | 0 | 5 | 881 | 74 | 80% | 7.8 |
| Clinical Nurse Specialist | 2 | 0 | 2 | 536 | 64 | 70% | 8.2 |
| Qualified Activities Professional | 1 | 0 | 1 | 507 | 64 | 70% | 7.9 |
| Dietitian | 1 | 0 | 1 | 479 | 65 | 71% | 7.4 |
| Nurse Practitioner | 2 | 0 | 2 | 408 | 51 | 55% | 8 |
| Dental Services Staff | 1 | 0 | 1 | 394 | 49 | 53% | 8 |
| Physical Therapy Aide | 4 | 0 | 4 | 394 | 60 | 65% | 5.6 |
| Speech Language Pathologist | 3 | 0 | 3 | 264 | 56 | 61% | 3.9 |
| Administrator | 1 | 0 | 1 | 264 | 66 | 72% | 4 |
| Respiratory Therapy Technician | 6 | 0 | 6 | 263 | 57 | 62% | 4.1 |
| Occupational Therapy Aide | 1 | 0 | 1 | 65 | 38 | 41% | 1.7 |
| Qualified Social Worker | 1 | 0 | 1 | 64 | 18 | 20% | 3.6 |
| Physical Therapy Assistant | 4 | 0 | 4 | 60 | 13 | 14% | 4.6 |
| Occupational Therapy Assistant | 0 | 1 | 1 | 39 | 13 | 14% | 3 |
| Medical Director | 0 | 1 | 1 | 26 | 13 | 14% | 2 |
| Other Dietary Services Staff | 1 | 0 | 1 | 4 | 1 | 1% | 4.2 |
Includes penalties issued in 2024-2025
Federal penalties imposed by CMS for regulatory violations, including civil money penalties (fines) and denials of payment for new Medicare/Medicaid admissions.
Source: CMS Penalties Database (Data as of Jan 2026)
California average: $55K
California average: 2.4
California average: 0.5
Penalties are imposed by CMS for violations of federal nursing home regulations.
2 penalties in the past 3 years
Multiple penalties were reported in the last 3 years.
Last updated: Jan 2026
These measures show how residents usually do over time at this home, based on health outcomes and preventive care.
California average: 6.6
California average: 11.3
California average: 11.1%
California average: 12.0%
California average: 11.3%
California average: 1.7%
California average: 5.0%
California average: 1.2%
California average: 4.2%
California average: 6.7%
California average: 10.1%
California average: 98.5%
California average: 98.2%
California average: 94.0%
California average: 1.5%
California average: 93.2%
California average: 0.8%
California average: 50.6%
Quality measures are calculated from Minimum Data Set (MDS) assessments. For most measures, lower percentages indicate better care quality.
32% of new residents, usually for short-term rehab.
48% of new residents, often for short stays.
20% of new residents, often for long-term daily care.
Source: CMS Long-Term Care Facility Characteristics (Data as of Jan 2026)
Residents meet regularly to discuss policies, care quality, and activities
Organized group of residents that meets regularly to discuss facility policies, quality of life, and activities.
Data sourced from CMS Long-Term Care Facility Characteristics quarterly report. Payer mix reflects the current resident census by primary payment source.
Historical financial and operational data for Countryside Care Center from 2011–2023, based on CMS SNF Cost Reports.
Key figures below are for fiscal year ending in 12/2023.
Based on CMS SNF Cost Report for fiscal year ending in 12/2023.
Building Type: Single-story

Health Programs
This home supports both short-term rehab and long-term care, with residents staying for a wide range of durations.
New residents most often arrive under private pay (48% of admissions), and a typical private pay stay runs around 7 - 8 months.
Coverage residents most often arrive under.
Coverage residents most often leave under.
![]() 5.2 miles from city center
5.2 miles from city center
![]() Estimated distance in miles from Fresno's city center to Countryside Care Center's address, calculated via Google Maps.
Estimated distance in miles from Fresno's city center to Countryside Care Center's address, calculated via Google Maps.
Add your location
The information below is reported by the California Department of Social Services and Department of Public Health.
| The Terraces at San Joaquin Gardens a CCRC | AL IL MC NH SNF | Fresno | 652
Facility
652
CA AVG
104
Rank
#9 / 1644 |
57.2%
Facility
57.2%
CA AVG
73.9
Rank
#1230 / 1492 | -23% | 5.21
Facility
5.21
CA AVG
4.22
Rank
#29 / 327 | +27% | +23% | $0
Facility
$0
CA AVG
$56.5k
Rank
#1 / 334 | 88
Facility
88
CA AVG
81
Rank
#513 / 1400 | 32
Facility
32
CA AVG
50.2
Rank
#117 / 327 | 4.6
Facility
4.6
CA AVG
4.6
Rank
#198 / 327 | 1 | 373 | A+ |
57
Facility
57
CA AVG
57
Rank
#1155 / 2087 | Humangood Fresno | $33.9MFiscal year ending 12/2023
Facility
$33.9MFiscal year ending 12/2023
CA AVG
$17.0M
Rank
#27 / 327 | $13.6MFiscal year ending 12/2023
Facility
$13.6MFiscal year ending 12/2023
CA AVG
$7.0M
Rank
#35 / 327 | 40.2%Fiscal year ending 12/2023
Facility
40.2%Fiscal year ending 12/2023
CA AVG
45.2%
Rank
#267 / 327 | 55846 | ||||
| North Pointe Care Center | AL MC NH RC SNF | Fresno (East Bullard Avenue) | 99
Facility
99
CA AVG
104
Rank
#724 / 1644 |
92.9%
Facility
92.9%
CA AVG
73.9
Rank
#267 / 1492 | +26% | 3.61
Facility
3.61
CA AVG
4.22
Rank
#253 / 327 | +19% | -14% | $0
Facility
$0
CA AVG
$56.5k
Rank
#1 / 334 | - | 21
Facility
21
CA AVG
50.2
Rank
#42 / 327 | 4.2
Facility
4.2
CA AVG
4.6
Rank
#170 / 327 | - | 92 | - |
80
Facility
80
CA AVG
57
Rank
#416 / 2087 | North Point Wellness Gp LLC | $11.0M*Fiscal year ending 10/2022These figures are from this home's most recent complete cost report — an older period than most facilities report. Compare with that in mind.
Facility
$11.0M*Fiscal year ending 10/2022These figures are from this home's most recent complete cost report — an older period than most facilities report. Compare with that in mind.
CA AVG
$17.0M
Rank
#237 / 327 | $6.5M*Fiscal year ending 10/2022These figures are from this home's most recent complete cost report — an older period than most facilities report. Compare with that in mind.
Facility
$6.5M*Fiscal year ending 10/2022These figures are from this home's most recent complete cost report — an older period than most facilities report. Compare with that in mind.
CA AVG
$7.0M
Rank
#221 / 327 | 58.7%*Fiscal year ending 10/2022These figures are from this home's most recent complete cost report — an older period than most facilities report. Compare with that in mind.
Facility
58.7%*Fiscal year ending 10/2022These figures are from this home's most recent complete cost report — an older period than most facilities report. Compare with that in mind.
CA AVG
45.2%
Rank
#96 / 327 | 555179 | ||||
| Evergreen Life Care Homes | AL HOS MC NH RC SNF | Fresno (Roosevelt) | 49
Facility
49
CA AVG
104
Rank
#1129 / 1644 |
94.3%
Facility
94.3%
CA AVG
73.9
Rank
#229 / 1492 | +28% | 4.36
Facility
4.36
CA AVG
4.22
Rank
#101 / 327 | -27% | +3% | $0
Facility
$0
CA AVG
$56.5k
Rank
#1 / 334 | - | 33
Facility
33
CA AVG
50.2
Rank
#125 / 327 | 3.0
Facility
3.0
CA AVG
4.6
Rank
#58 / 327 | 2 | 46 | A+ |
37
Facility
37
CA AVG
57
Rank
#1600 / 2087 | Evergreen Care Center Holdings LLC | $8.6MFiscal year ending 12/2023
Facility
$8.6MFiscal year ending 12/2023
CA AVG
$17.0M
Rank
#306 / 327 | $2.8MFiscal year ending 12/2023
Facility
$2.8MFiscal year ending 12/2023
CA AVG
$7.0M
Rank
#324 / 327 | 32.6%Fiscal year ending 12/2023
Facility
32.6%Fiscal year ending 12/2023
CA AVG
45.2%
Rank
#245 / 327 | 555920 | ||||
| Horizon Health & Subacute Center | AL NH SNF | Fresno (East Herndon Avenue) | 180
Facility
180
CA AVG
104
Rank
#210 / 1644 |
85.2%
Facility
85.2%
CA AVG
73.9
Rank
#453 / 1492 | +15% | 4.73
Facility
4.73
CA AVG
4.22
Rank
#65 / 327 | -29% | +12% | $22.9k
Facility
$22.9k
CA AVG
$56.5k
Rank
#249 / 334 | 74
Facility
74
CA AVG
81
Rank
#998 / 1400 | 43
Facility
43
CA AVG
50.2
Rank
#175 / 327 | 3.1
Facility
3.1
CA AVG
4.6
Rank
#70 / 327 | 2 | 153 | - |
58
Facility
58
CA AVG
57
Rank
#1126 / 2087 | Chad Galley | $17.2M*Fiscal year ending 03/2022These figures are from this home's most recent complete cost report — an older period than most facilities report. Compare with that in mind.
Facility
$17.2M*Fiscal year ending 03/2022These figures are from this home's most recent complete cost report — an older period than most facilities report. Compare with that in mind.
CA AVG
$17.0M
Rank
#148 / 327 | $10.3M*Fiscal year ending 03/2022These figures are from this home's most recent complete cost report — an older period than most facilities report. Compare with that in mind.
Facility
$10.3M*Fiscal year ending 03/2022These figures are from this home's most recent complete cost report — an older period than most facilities report. Compare with that in mind.
CA AVG
$7.0M
Rank
#81 / 327 | 60%*Fiscal year ending 03/2022These figures are from this home's most recent complete cost report — an older period than most facilities report. Compare with that in mind.
Facility
60%*Fiscal year ending 03/2022These figures are from this home's most recent complete cost report — an older period than most facilities report. Compare with that in mind.
CA AVG
45.2%
Rank
#36 / 327 | 55199 | ||||
| Countryside Care Center | AL NH SNF | Cornelia Fresno (Westside) | 59
Facility
59
CA AVG
104
Rank
#1084 / 1644 |
96.3%
Facility
96.3%
CA AVG
73.9
Rank
#183 / 1492 | +30% | 4.35
Facility
4.35
CA AVG
4.22
Rank
#116 / 327 | -44% | +3% | $96.8k
Facility
$96.8k
CA AVG
$56.5k
Rank
#318 / 334 | - | 36
Facility
36
CA AVG
50.2
Rank
#135 / 327 | 3.0
Facility
3.0
CA AVG
4.6
Rank
#58 / 327 | 3 | 57 | - |
1
Facility
1
CA AVG
57
Rank
#2055 / 2087 | Emmanuel Galit | $7.9MFiscal year ending 12/2023
Facility
$7.9MFiscal year ending 12/2023
CA AVG
$17.0M
Rank
#265 / 327 | $4.8MFiscal year ending 12/2023
Facility
$4.8MFiscal year ending 12/2023
CA AVG
$7.0M
Rank
#286 / 327 | 60.8%Fiscal year ending 12/2023
Facility
60.8%Fiscal year ending 12/2023
CA AVG
45.2%
Rank
#200 / 327 | 56281 |
Countryside Care Center is located in Cornelia Fresno, California.
Here are the financial assistance programs available to residents in California.
Countryside Care Center is in the Westside neighborhood.
Countryside Care Center has a walk score of 1. Car-dependent. Most errands require a car, with limited nearby walkable options.
Countryside Care Center's occupancy is 92.1%.
No, Countryside Care Center has a no-pet policy.
Countryside Care Center is registered as a for-profit.
Yes — there are 5 photos of Countryside Care Center in the photo gallery on this page.
Countryside Care Center is located at 925 North Cornelia, Fresno, CA 93706.
Care Cost Calculator: See Prices in Your Area
Nursing Home Data Explorer
Don’t Wait Too Long: 7 Red Flag Signs Your Parent Needs Assisted Living Now
The True Cost of Assisted Living in 2025 – And How Families Are Paying For It
Understanding Senior Living Costs: Pricing Models, Discounts & Financial Assistance


