Crown Point Christian Village
Nursing Home, Assisted Living, Independent Living & Memory Care · Indiana, IN
CMS overall rating Info CMS (the Centers for Medicare & Medicaid Services) is the federal agency that rates nursing home quality. Its Overall Rating runs from 1 to 5 stars, combining health inspections, staffing, and quality measures, with inspections weighted most heavily.

Crown Point Christian Village

Nursing Home, Assisted Living, Independent Living & Memory Care · Indiana, IN
CMS overall rating Info CMS (the Centers for Medicare & Medicaid Services) is the federal agency that rates nursing home quality. Its Overall Rating runs from 1 to 5 stars, combining health inspections, staffing, and quality measures, with inspections weighted most heavily.
Calculator: See prices in your area
Crown Point Christian Village accepts Medicare, Medicaid, and private pay.

Overview of Crown Point Christian Village

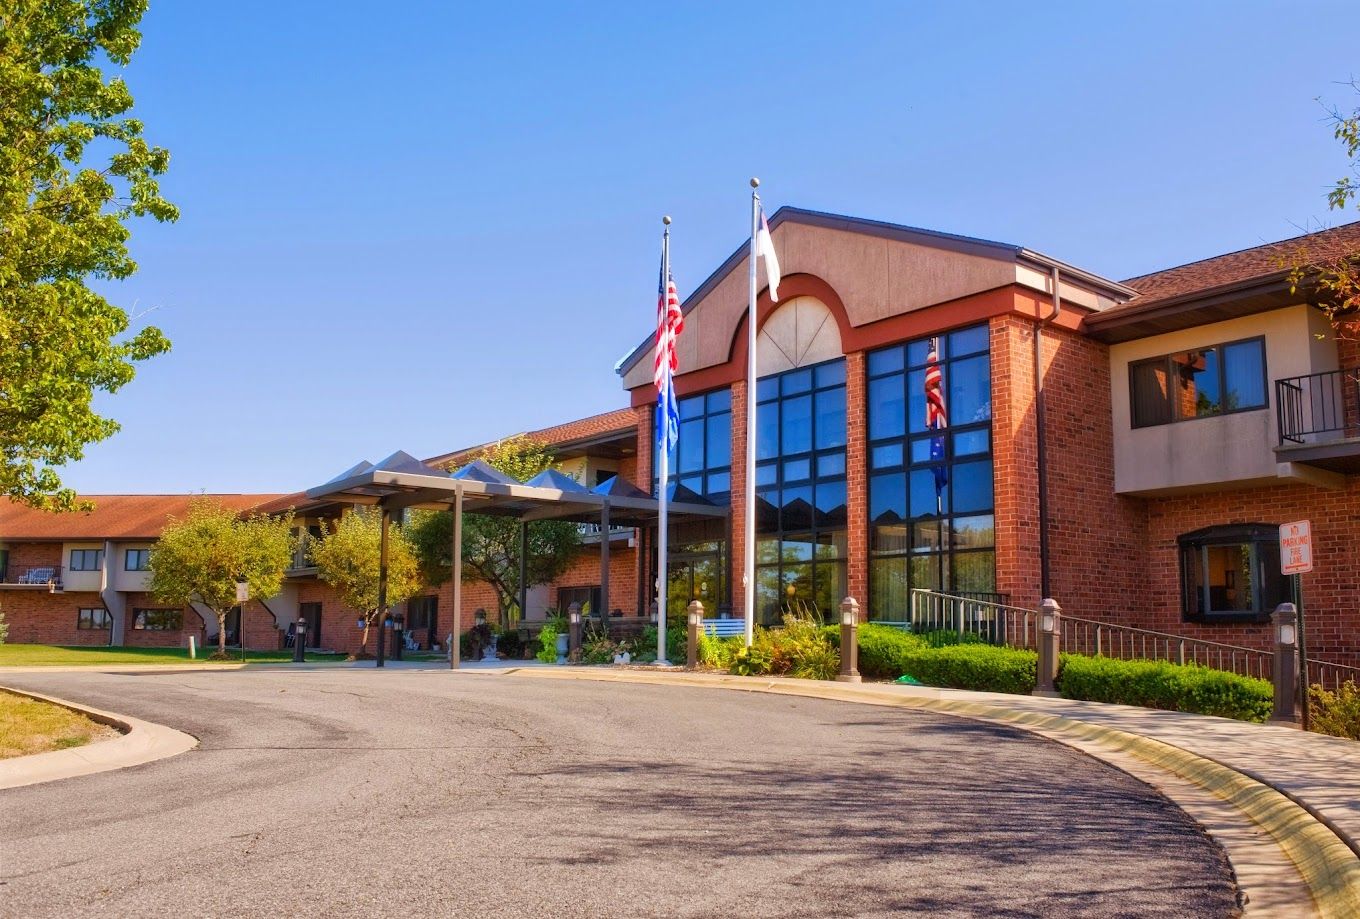
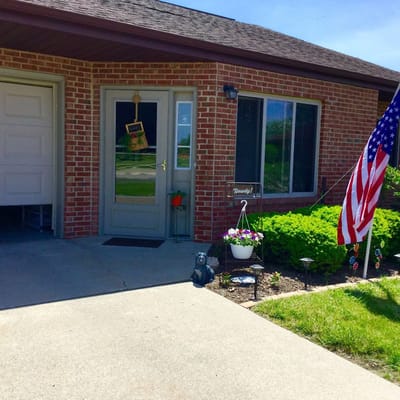
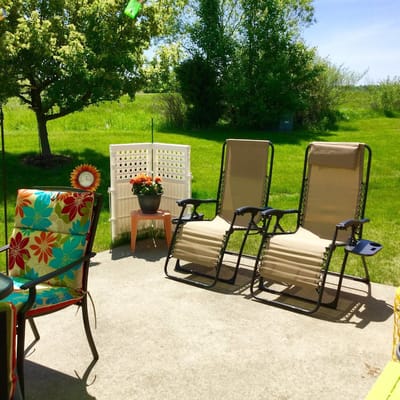
Located in Crown Point, IN, Crown Point Christian Village provides outstanding healthcare services, including memory support, rehabilitation, and long-term care. Central to the Village’s mission is memory care for individuals with Alzheimer’s and dementia, fostering a supportive environment through memory aids, cognitive activities, and emotional support to enhance residents’ quality of life. The community also offers a range of amenities, from charming townhome garden villas to sunlit apartments, with thoughtfully designed floor plans that cater to diverse lifestyles and preferences.

Explore its beautifully created common spaces and meet new companions along the way. More than just a care facility, Crown Point Christian Village offers a vibrant, fulfilling living experience where compassionate care and modern healthcare intersect, ensuring each resident thrives in a warm and welcoming community.

(219) 662-0642

Quality ratings

Measured by Centers for Medicare & Medicaid Services (CMS)

Overall rating Info The Overall CMS Rating combines results from health inspections, staffing levels and quality measures. Health inspections carry the most weight. Staffing and quality scores can increase or decrease the final rating based on performance compared to state and national standards.
▼ 67.6% Below IN avg. ▼ 67.6% Below IN avg.IN average: 3.1Click the badge to see the full State ranking.Click here to see the full State ranking.
Health Inspection Info Based on the results of the facility's three most recent standard inspections and any complaint investigations. CMS reviews the number, scope, and severity of deficiencies, with more recent findings weighted more heavily.
▼ 64.4% Below IN avg. ▼ 64.4% Below IN avg.IN average: 2.8Click the badge to see the full State ranking.Click here to see the full State ranking.
Staffing Info Measures average nursing staff hours per resident per day, including Registered Nurses (RNs) and total nursing staff. Ratings are adjusted based on the level of care residents require and are compared to state and national benchmarks.
▼ 59.3% Below IN avg. ▼ 59.3% Below IN avg.IN average: 2.5Click the badge to see the full State ranking.Click here to see the full State ranking.
Quality Measures Info Based on clinical and physical health indicators reported to CMS, such as hospital readmissions, falls, pressure ulcers, and improvements in mobility. These measures reflect how well residents' health needs are being managed.
▼ 2.2% Below IN avg. ▼ 2.2% Below IN avg.IN average: 4.1Click the badge to see the full State ranking.Click here to see the full State ranking.

Staffing hours breakdown

Info Daily nursing hours per resident by staff type, reported to CMS. Higher is generally better — compare this facility to state and national averages to see where staffing stands.

Hours per resident per day — compared to Indiana state averages

Total nursing care / resident Info This home is ranked 63rd out of 291 homes in Indiana for nurse hours. Total adjusted nursing hours per resident per day, combining RN, LPN, and aide time. CMS adjusts this for case-mix so facilities can be fairly compared.
3h 46m per day
Rank #63 / 291Nurse hours — State benchmarkedThis home is ranked 63rd out of 291 homes in Indiana. Shows adjusted nurse hours per resident per day benchmarked to the Indiana average, with a ranking across 291 Indiana facilities. More hours mean more direct care. The national average is about 3.5 hrs; below 3.0 is a red flag.Rankings are based only on facilities in Indiana that report data for that category. Facilities without available data are excluded from the ranking.Click the rank badge to see the full State ranking.Click here to see the full State ranking.
This facility Indiana avg (3h 26m per day)
vs Indiana avg
+10%

4 of 6 metrics below state avg

Standout metric Physical Therapist is +97% above state avg
Staff typeHours / Day / Residentvs state avg
Registered Nurse (RN) Info RNs hold the highest nursing license and can assess residents, interpret test results, and direct care plans. More RN hours per day often signals stronger clinical oversight and faster response to health changes. 28m per day ▼ 29% State avg: 39m per day · National avg: 41m per day
LPN / LVN Info Licensed Practical Nurses (LPNs) or Licensed Vocational Nurses (LVNs) deliver routine hands-on care — medication administration, wound dressing, and monitoring vital signs. They work under RN supervision and make up a large share of daily bedside care. 1h 0m per day ▲ 27% State avg: 47m per day · National avg: 52m per day
Nurse Aide Info Certified Nurse Aides (CNAs) provide the most direct day-to-day assistance: bathing, dressing, feeding, and mobility. Nurse aide hours are typically the largest staffing category and directly affect residents' quality of life. 1h 57m per day ▼ 14% State avg: 2h 15m per day · National avg: 2h 20m per day
Weekend Total Nursing Info Combined nursing hours (RN + LPN + Nurse Aide) per resident per day on weekends. Staffing often drops on weekends — this figure reveals whether the facility maintains adequate coverage outside of weekday hours. 3h 3m per day ▼ 7% State avg: 3h 16m per day · National avg: 3h 27m per day
Physical Therapist Info Hours per resident per day provided by licensed Physical Therapists (PTs) or PT Assistants. PT services help residents recover mobility after injury or illness and are especially important for post-acute (short-stay) rehabilitation. 7m per day ▲ 97% State avg: 4m per day · National avg: 4m per day
Weekend RN Info Registered nurse hours specifically on weekends. Facilities sometimes reduce RN presence on Saturdays and Sundays — a low weekend RN figure compared to weekday hours can indicate reduced clinical oversight when most administrative staff are absent. 15m per day ▼ 43% State avg: 27m per day · National avg: 29m per day

Capacity and availability

This home usually has availability

Higher occupancy than the Indiana average: 69.4%
Occupancy rate
70.3% Rank #186 / 434Occupancy rate — State benchmarkedThis home is ranked 186th out of 434 homes in Indiana. Shows this facility's occupancy rate versus the Indiana average, with its Statewide rank out of 434. Higher occupancy signals strong local demand and financial stability.Rankings are based only on facilities in Indiana that report data for that category. Facilities without available data are excluded from the ranking.Click the rank badge to see the full State ranking.Click here to see the full State ranking.
Avg. Length of Stay
78 days
Bed community size
145-bed community Rank #101 / 437Bed count — State benchmarkedThis home is ranked 101st out of 437 homes in Indiana. Shows this facility's certified or reported bed count compared to other Indiana facilities. Larger communities may offer more amenities, programs, and on-site services for residents and families.Rankings are based only on facilities in Indiana that report data for that category. Facilities without available data are excluded from the ranking.Click the rank badge to see the full State ranking.Click here to see the full State ranking.
A larger shared setting that may offer more common spaces and organized community services.
Years in operation
46 years in operation Rank #11 / 378Years in operation — State benchmarkedThis home is ranked 11th out of 378 homes in Indiana. Shows how long this facility has been in operation compared to other Indiana facilities. Longer operating histories may benefit residents, families, and staff.Rankings are based only on facilities in Indiana that report data for that category. Facilities without available data are excluded from the ranking.Click the rank badge to see the full State ranking.Click here to see the full State ranking.
A longer operating history, which may indicate experience navigating regulations and delivering ongoing care.
Walk Score
Walk Score: 0 / 100 Rank #562 / 587Walk Score — State benchmarkedThis home is ranked 562nd out of 587 homes in Indiana. Shows how walkable this facility's neighborhood is compared to the average Walk Score across Indiana facilities. Higher scores benefit residents, families, and staff.Rankings are based only on facilities in Indiana that report data for that category. Facilities without available data are excluded from the ranking.Click the rank badge to see the full State ranking.Click here to see the full State ranking.
Car-dependent. Most errands require a car, with limited nearby walkable options.

About this community

License Details

CMS Certification Number155637

Contact Crown Point Christian Village

Health Inspection History

Inspections since 2024
Total health inspections 12

Indiana average 6


Last Health inspection on Aug 2025

Total health citations
69 Rank #283 / 292Health citations — State benchmarkedThis home is ranked 283rd out of 292 homes in Indiana. Shows this facility's total health deficiency citations benchmarked to the Indiana State average, with a ranking across all 292 IN facilities. Lower citation counts earn a better rank.Rankings are based only on facilities in Indiana that report data for that category. Facilities without available data are excluded from the ranking.Click the rank badge to see the full State ranking.Click here to see the full State ranking.

Indiana average 25

Citations per inspection
5.75 Rank #224 / 292Citations per inspection — State benchmarkedThis home is ranked 224th out of 292 homes in Indiana. Shows average deficiency citations per CMS inspection for this facility versus the Indiana mean across 292 facilities with citation data. Lower is better.Rankings are based only on facilities in Indiana that report data for that category. Facilities without available data are excluded from the ranking.Click the rank badge to see the full State ranking.Click here to see the full State ranking.

Indiana average 4.12


Health citations are formal notices following inspections when they fail to comply with safety and care standards.

31 of 69 citations resulted from standard inspections; 34 of 69 resulted from complaint investigations; and 4 of 69 came from combined inspections (standard and complaint).

Breakdown of citation severity (last 2 years)
Critical health citations
1
400% worse than Indiana average

Indiana average: 0.2


Serious health citations
0
100% better than Indiana average

Indiana average: 0.6

1 critical citation Indiana average: 0.2

0 serious citations Indiana average: 0.6

68 moderate citations Indiana average: 23.8

0 minor citations Indiana average: 0.4
Citations history (last 2 years)
Resident Rights moderate citation Aug 19, 2025
Corrected

Abuse/Neglect moderate citation Jul 24, 2025
Corrected

Infection Control moderate citation Jul 24, 2025
Corrected

Pharmacy moderate citation Jul 24, 2025
Corrected

Staffing Data

Reporting period: October 1 – December 31, 2025 (Q4 2025). Source: CMS Payroll-Based Journal report.

Total staff 155
Employees 153
Contractors 2
Staff to resident ratio 1.53 : 1
1534553% more staff per resident than Indiana average
Indiana average ratio: 0.00 : 1 Indiana average ratio: 0.00 : 1See full Indiana ranking
Avg staff/day 59
Average shift 7.8 hours
0% compared with Indiana average
Indiana average: 7.7 hours Indiana average shift: 7.7 hoursSee full Indiana ranking
Total staff hours (quarter) 42,461

Nursing staff breakdown

Q4 2025 · Oct 1 – Dec 31 More info This data comes from the CMS Payroll-Based Journal report covering October 1 – December 31, 2025.
Registered Nurse

Manages medical care and health needs.

RN Staff Info All 13 RN Staff are full-time employees. No contractors work on this role. 13
Average shift length Info Average shift length. Calculated as total hours divided by days worked and average staff per day. 7.7 hours
Licensed Practical Nurse

Assists with medical care and medications.

LPN Staff Info All 27 LPN Staff are full-time employees. No contractors work on this role. 27
Average shift length Info Average shift length. Calculated as total hours divided by days worked and average staff per day. 8.4 hours
Certified Nursing Assistant

Helps with daily care and mobility.

CNA Staff Info All 79 CNA Staff are full-time employees. No contractors work on this role. 79
Average shift length Info Average shift length. Calculated as total hours divided by days worked and average staff per day. 8 hours

Contractor staffing

Q4 2025 · Oct 1 – Dec 31 More info This data comes from the CMS Payroll-Based Journal report covering October 1 – December 31, 2025.

Total hours from contractors

0.5%

209 contractor hours this quarter

Occupational Therapy Assistant: 1 Medical Director: 1

Staff by category

Q4 2025 · Oct 1 – Dec 31 More info This data comes from the CMS Payroll-Based Journal report covering October 1 – December 31, 2025.
Certified Nursing Assistant7907920,33092100%8
Licensed Practical Nurse270279,85792100%8.4
Registered Nurse130133,45792100%7.7
Other Dietary Services Staff4041,8789199%7.7
Respiratory Therapy Technician5051,2906672%6.4
Clinical Nurse Specialist3038376065%9
RN Director of Nursing3036966470%7.9
Physical Therapy Aide3036326672%6.9
Nurse Practitioner2026006470%8
Mental Health Service Worker1015286672%8
Dietitian1014986470%7.8
Administrator2024966166%8
Qualified Social Worker1014356065%7.3
Medication Aide/Technician2022634043%6.6
Physical Therapy Assistant3032405054%4.5
Speech Language Pathologist4042183235%6.6
Occupational Therapy Assistant0111764650%3.8
Medical Director011331415%2.4
79 Certified Nursing Assistant
% of Days 100%
27 Licensed Practical Nurse
% of Days 100%
13 Registered Nurse
% of Days 100%
4 Other Dietary Services Staff
% of Days 99%
5 Respiratory Therapy Technician
% of Days 72%
3 Clinical Nurse Specialist
% of Days 65%
3 RN Director of Nursing
% of Days 70%
3 Physical Therapy Aide
% of Days 72%
2 Nurse Practitioner
% of Days 70%
1 Mental Health Service Worker
% of Days 72%
1 Dietitian
% of Days 70%
2 Administrator
% of Days 66%
1 Qualified Social Worker
% of Days 65%
2 Medication Aide/Technician
% of Days 43%
3 Physical Therapy Assistant
% of Days 54%
4 Speech Language Pathologist
% of Days 35%
1 Occupational Therapy Assistant
% of Days 50%
1 Medical Director
% of Days 15%

Penalties and fines

Includes penalties issued in 2025

Federal penalties imposed by CMS for regulatory violations, including civil money penalties (fines) and denials of payment for new Medicare/Medicaid admissions.

Source: CMS Penalties Database (Data as of Jan 2026)

Total fines amount $0 Rank #278 / 293Federal fines — State benchmarkedThis home is ranked 278th out of 293 homes in Indiana. Shows this facility's cumulative CMS federal fine dollars versus the Indiana average among facilities with fines, and where it ranks among 293 facilities in the pool. Lower total dollars mean a better rank.Rankings are based only on facilities in Indiana that report data for that category. Facilities without available data are excluded from the ranking.Click the rank badge to see the full State ranking.Click here to see the full State ranking.
100% lower than Indiana average

Indiana average: $27K

Number of fines 0
100% fewer fines than Indiana average

Indiana average: 1.4

Payment Denials Info Serious action where Medicare and/or Medicaid temporarily stops payments for new residents until issues are fixed. 1
152% more payment denials than Indiana average

Indiana average: 0.4

Fines amount comparison
This facility $0
Indiana average $27K
Penalty History

Penalties are imposed by CMS for violations of federal nursing home regulations.

1 penalty in the past 3 years

Feb 24, 2025 · 13 days

Payment Denial Info Serious action where Medicare and/or Medicaid temporarily stops payments for new residents until issues are fixed. Feb 24, 2025
13 days

Last updated: Jan 2026

Quality of care over time

These measures show how residents usually do over time at this home, based on health outcomes and preventive care.

High-risk clinical events score Info A composite score based on pressure ulcers, falls with injury, weight loss, walking ability decline, and activities of daily living decline. 12.3
54% worse than Indiana average

Indiana average: 8.0

Functional decline score Info A composite score based on activities of daily living decline, walking ability decline, and incontinence. 23.3
36% worse than Indiana average

Indiana average: 17.1

Long-stay resident measures
Need for Help with Daily Activities Increased Info Percent of long-stay residents whose need for help with daily activities has increased 15.5%
29% worse than Indiana average

Indiana average: 12.0%

Walking Ability Worsened Info Percent of long-stay residents whose ability to move independently worsened 27.3%
90% worse than Indiana average

Indiana average: 14.4%

Low Risk Residents with Bowel/Bladder Incontinence Info Percent of low risk long-stay residents who lose control of their bowels or bladder 26.9%
10% worse than Indiana average

Indiana average: 24.6%

Falls with Major Injury Info Percent of long-stay residents experiencing one or more falls with major injury 1.8%
54% better than Indiana average

Indiana average: 3.9%

High Risk Residents with Pressure Ulcers Info Percent of long-stay high risk residents with pressure ulcers 8.5%
94% worse than Indiana average

Indiana average: 4.4%

Urinary Tract Infection Info Percent of long-stay residents with a urinary tract infection 1.5%
25% worse than Indiana average

Indiana average: 1.2%

Lost Too Much Weight Info Percent of long-stay residents who lose too much weight 8.6%
51% worse than Indiana average

Indiana average: 5.7%

Depressive Symptoms Info Percent of long-stay residents who have depressive symptoms 3.7%
85% better than Indiana average

Indiana average: 24.1%

Antipsychotic Use Info Percent of long-stay residents who received an antipsychotic medication 12.2%
In line with Indiana average

Indiana average: 12.4%

Pneumococcal Vaccine Info Percent of long-stay residents assessed and appropriately given the pneumococcal vaccine 81.0%
14% worse than Indiana average

Indiana average: 93.7%

Influenza Vaccine Info Percent of long-stay residents assessed and appropriately given the seasonal influenza vaccine 93.7%
In line with Indiana average

Indiana average: 95.4%

Short-stay resident measures
Pneumococcal Vaccine Info Percent of short-stay residents assessed and appropriately given the pneumococcal vaccine 49.3%
40% worse than Indiana average

Indiana average: 81.7%

Antipsychotic medication increase Info Percent of short-stay residents who newly received an antipsychotic medication 0.4%
73% better than Indiana average

Indiana average: 1.4%

Influenza Vaccine Info Percent of short-stay residents assessed and appropriately given the seasonal influenza vaccine 48.5%
39% worse than Indiana average

Indiana average: 79.0%

Breakdown by payment type

Medicare

38% of new residents, usually for short-term rehab.

Typical stay 27 days

Private pay

46% of new residents, often for short stays.

Typical stay 2 - 3 months

Medicaid

16% of new residents, often for long-term daily care.

Typical stay 7 - 8 months

Facility Characteristics

Source: CMS Long-Term Care Facility Characteristics (Data as of Jan 2026)

Total residents 101
Medicare
12
11.9% of residents
Medicaid
71
70.3% of residents
Private pay or other
18
17.8% of residents
Programs & Services
Residents Group

Residents meet regularly to discuss policies, care quality, and activities

Family Member Group

Family members meet regularly to discuss policies, care quality, and activities

CCRC

Part of a Continuing Care Retirement Community offering multiple care levels

Active Family Council

Organized group of family members that meets regularly to discuss facility policies, resident care, and activities.

Active Resident Council

Organized group of residents that meets regularly to discuss facility policies, quality of life, and activities.

Finances and operations

Based on CMS SNF Cost Report for fiscal year ending in 12/2023.

Governmental community
Operated by federal authorities.
Net patient revenue Info Net patient revenue — what the home actually collects for resident care, after contractual allowances, bad debt and discounts are subtracted from its gross charges (CMS cost report, Worksheet G-3). It covers resident care only; money the home earns from other sources is shown separately as "Other income."
$11.9M
Net patient income Info Net patient income: net patient revenue minus the home's total operating expenses. A positive figure means it earns more from resident care than it spends to deliver it; a negative figure means the opposite. It excludes non-operating "other income."
-$639.6K
Governmental community Operated by federal authorities.
Net patient revenue Info Net patient revenue — what the home actually collects for resident care, after contractual allowances, bad debt and discounts are subtracted from its gross charges (CMS cost report, Worksheet G-3). It covers resident care only; money the home earns from other sources is shown separately as "Other income."
$11.9M Rank #79 / 294Revenue — State benchmarkedThis home is ranked 79th out of 294 homes in Indiana. Shows this facility's annual revenue compared to the Indiana average. Higher revenue generally means more resources for staffing and capital — read alongside Payroll %.Rankings are based only on facilities in Indiana that report data for that category. Facilities without available data are excluded from the ranking.Click the rank badge to see the full State ranking.Click here to see the full State ranking.
Net patient income Info Net patient income: net patient revenue minus the home's total operating expenses. A positive figure means it earns more from resident care than it spends to deliver it; a negative figure means the opposite. It excludes non-operating "other income."
-$639.6K
Other income Info Money the home earns outside of resident care — such as investments, grants, rentals and other non-operating sources (CMS cost report, Worksheet G-3). It is tracked separately from net patient revenue: it is not part of that figure, and it is not included in net patient income.
$417.8K
Payroll costs Info Staff salaries plus wage-related costs — benefits such as payroll taxes, health insurance and retirement — from the home's own accounting records (CMS cost report, Worksheet A). Contract or agency labor is counted separately, under other operating costs. Rank #50 / 294Payroll — State benchmarkedThis home is ranked 50th out of 294 homes in Indiana. Shows total annual staff payroll benchmarked to the Indiana average. Higher payroll investment relative to peers often signals better staffing and less reliance on cheaper contract labor.Rankings are based only on facilities in Indiana that report data for that category. Facilities without available data are excluded from the ranking.Click the rank badge to see the full State ranking.Click here to see the full State ranking.
$6.1M 51.3% of net patient revenue Info Payroll as a share of revenue: staff salaries and wage-related benefits divided by net patient revenue. A higher figure means more of each revenue dollar goes to staff pay. Rank #108 / 294Payroll % — State benchmarkedThis home is ranked 108th out of 294 homes in Indiana. Shows payroll as a percentage of revenue versus the Indiana average. Well-run Indiana facilities typically land around 54–68% — the top third Statewide. Below 25% may signal understaffing or heavy agency use — read with Staffing ratings.Rankings are based only on facilities in Indiana that report data for that category. Facilities without available data are excluded from the ranking.Click the rank badge to see the full State ranking.Click here to see the full State ranking.
Other operating costs Info Everything it costs to run the home apart from payroll — food, utilities, supplies, maintenance, contract labor and administration. Calculated as total operating expense minus payroll (staff salaries and wage-related benefits).
$6.4M
Total costs Info The home's total operating expense for the year — all the costs of running it, salaries included (CMS cost report, Worksheet G-3).
$12.5M

What does this home offer?

Building type icon
Building type icon

Building Type: Two-story

Who this home usually serves

TYPE OF STAY

Mix of rehab and long-term care

This home supports both short-term rehab and long-term care, with residents staying for a wide range of durations.

New residents most often arrive under private pay (46% of admissions), and a typical private pay stay runs around 2 - 3 months.

Admissions
489 total

Coverage residents most often arrive under.

Medicare 38%
Private pay 46%
Medicaid 16%
Discharges
476 total

Coverage residents most often leave under.

Medicare 41%
Private pay 43%
Medicaid 16%

Places of interest near Crown Point Christian Village

Address 6.0 miles from city center Info Estimated distance in miles from Crown Point's city center to Crown Point Christian Village's address, calculated via Google Maps.

Calculate Travel Distance to Crown Point Christian Village

Add your location

Address

Compare Nursing Homes around Indiana

The information below is reported by the Indiana Department of Health, Division of Long Term Care.

5 facilities compared · CMS & IN Dept. of Health data

The Barrington of Carmel
NH
AL
IL
MC
Carmel
154
Facility 154
IN AVG 116
Rank #82 / 437
71.4%
Facility 71.4%
IN AVG 69.4%
Rank #174 / 434
+3%
9.22
Facility 9.22
IN AVG 3.44
Rank #1 / 291
-61%+168%
$0
Facility $0
IN AVG $31.4k
Rank #1 / 293
94
Facility 94
IN AVG 83
Rank #47 / 384
5
Facility 5
IN AVG 25.0
Rank #11 / 292
2.5
Facility 2.5
IN AVG 4.1
Rank #52 / 292
-110A+
39
Facility 39
IN AVG 37
Rank #275 / 587
Bhi Retirement Communities Inc
$17.0M
Facility $17.0M
IN AVG $10.7M
Rank #43 / 294
$6.9M
Facility $6.9M
IN AVG $4.2M
Rank #67 / 294
40.6%
Facility 40.6%
IN AVG 42%
Rank #217 / 294
155817
Greenwood Village South
NH
AL
IL
MC
Greenwood
207
Facility 207
IN AVG 116
Rank #27 / 437
--
4.16
Facility 4.16
IN AVG 3.44
Rank #39 / 291
-50%+21%
$0
Facility $0
IN AVG $31.4k
Rank #1 / 293
83
Facility 83
IN AVG 83
Rank #151 / 384
6
Facility 6
IN AVG 25.0
Rank #17 / 292
3.0
Facility 3.0
IN AVG 4.1
Rank #82 / 292
-38A+
50
Facility 50
IN AVG 37
Rank #205 / 587
Pamela Seegers
$28.2M
Facility $28.2M
IN AVG $10.7M
Rank #3 / 294
$15.6M
Facility $15.6M
IN AVG $4.2M
Rank #3 / 294
55.4%
Facility 55.4%
IN AVG 42%
Rank #150 / 294
155026
North River Health Campus
NH
ADC
AL
IL
MC
Evansville (East Baseline Road)
95
Facility 95
IN AVG 116
Rank #269 / 437
50.5%
Facility 50.5%
IN AVG 69.4%
Rank #346 / 434
-27%
3.66
Facility 3.66
IN AVG 3.44
Rank #72 / 291
+63%+7%
$0
Facility $0
IN AVG $31.4k
Rank #1 / 293
91
Facility 91
IN AVG 83
Rank #71 / 384
10
Facility 10
IN AVG 25.0
Rank #41 / 292
3.3
Facility 3.3
IN AVG 4.1
Rank #108 / 292
-53A+
11
Facility 11
IN AVG 37
Rank #456 / 587
Thomas Cook
$10.8M
Facility $10.8M
IN AVG $10.7M
Rank #134 / 294
$5.8M
Facility $5.8M
IN AVG $4.2M
Rank #101 / 294
53.6%
Facility 53.6%
IN AVG 42%
Rank #101 / 294
155854
The Restoracy of Carmel
NH
MC
Carmel (Carmel Arts & Design District)
72
Facility 72
IN AVG 116
Rank #344 / 437
94.4%
Facility 94.4%
IN AVG 69.4%
Rank #12 / 434
+36%
4.61
Facility 4.61
IN AVG 3.44
Rank #27 / 291
-46%+34%
$0
Facility $0
IN AVG $31.4k
Rank #1 / 293
70
Facility 70
IN AVG 83
Rank #326 / 384
44
Facility 44
IN AVG 25.0
Rank #251 / 292
6.3
Facility 6.3
IN AVG 4.1
Rank #244 / 292
269A+
77
Facility 77
IN AVG 37
Rank #30 / 587
Euson Lindsay Legacy, LLC
$10.1M
Facility $10.1M
IN AVG $10.7M
Rank #164 / 294
$4.4M
Facility $4.4M
IN AVG $4.2M
Rank #147 / 294
43.7%
Facility 43.7%
IN AVG 42%
Rank #133 / 294
155846
Crown Point Christian Village
NH
AL
IL
MC
Crown Point (East 117Th Avenue)
145
Facility 145
IN AVG 116
Rank #101 / 437
70.3%
Facility 70.3%
IN AVG 69.4%
Rank #186 / 434
+1%
3.77
Facility 3.77
IN AVG 3.44
Rank #63 / 291
-14%+10%
$39.5k
Facility $39.5k
IN AVG $31.4k
Rank #278 / 293
-
69
Facility 69
IN AVG 25.0
Rank #283 / 292
5.8
Facility 5.8
IN AVG 4.1
Rank #224 / 292
1115-
0
Facility 0
IN AVG 37
Rank #562 / 587
Nicole Veal-Prom
$11.9M
Facility $11.9M
IN AVG $10.7M
Rank #79 / 294
$6.1M
Facility $6.1M
IN AVG $4.2M
Rank #50 / 294
51.3%
Facility 51.3%
IN AVG 42%
Rank #108 / 294
155637

Financial Assistance for
Nursing Home in Indiana

Crown Point Christian Village is located in Crown Point, Indiana.
Here are the financial assistance programs available to residents in Indiana.

Get Financial aid guidance

Aged and Disabled Waiver

Indiana Medicaid A&D Waiver

Age 65+ or disabled
General Indiana resident, Medicaid-eligible, nursing home-level care need.
Income Limits (2025) ~$2,829/month 300% FBR, individual
Asset Limits $2,000 (individual), $3,000 (couple).
IN

Requires level-of-care determination.

Benefits
Personal care (5-7 hours/day) Respite (240 hours/year) Adult day care (~$60/day) Home health services

CHOICE Program

Indiana CHOICE

Age 60+
General Indiana resident, at risk of nursing home.
Income Limits ~$2,000/month varies
Asset Limits $10,000 individual
IN

Limited funding; regional variation.

Benefits
In-home care (3-5 hours/week) Respite (up to 10 days/year) Transportation (~5 trips/month)

Residential Care Assistance Program (RCAP)

Indiana Residential Care Assistance Program

Age 65+
General or blind, or disabled, Indiana resident, in approved facility, low-income or SSI recipient.
Income Limits (2025) ~$1,004/month including SSI
Asset Limits $2,000 (individual), $3,000 (couple).
IN

~50 facilities statewide; per diem rate set by FSSA.

Benefits
Room/board Laundry Minimal care coordination (~$20-$50/day subsidy)

Medicare Savings Program (MSP)

Indiana Medicare Savings Program

Age 65+ or disabled
General Indiana resident, Medicare Part A/B.
Income Limits (2025) ~$2,510/month (QMB), ~$3,380/month (SLMB), ~$3,598/month (QI)—individual.
Asset Limits $9,430 (individual), $14,130 (couple).
IN

Three tiers; no waitlist.

Benefits
Covers Part B premiums ($174.70/month) Deductibles ($240/year) Copays (~20%)

National Family Caregiver Support Program (NFCSP) Respite

Indiana NFCSP Respite Care

Age
General Caregivers of 60+ needing care or 55+ caregivers of others; Indiana resident; functional needs (2+ ADLs).
Income Limits (2025) Prioritizes ~$24,980/year (individual); no strict cap.
Asset Limits Not assessed; need-based.
IN

16 AAAs; prioritizes low-income, rural caregivers.

Benefits
Respite (4-6 hours/week or 5 days/year) Adult day care ($60/day) Caregiver training

VA Aid and Attendance (A&A) and Housebound Benefits

Indiana VA Aid and Attendance/Housebound

Age 65+ or disabled veteran/spouse
General Indiana resident, wartime service, need for ADL help (A&A) or homebound.
Income Limits (2025) Net income < ~$1,984/month (veteran with dependent, A&A); pension offsets income.
Asset Limits ~$155,356 net worth limit
IN

High veteran demand statewide.

Benefits
Cash (~$1,433-$2,642/month veteran, ~$951-$1,318 spouse) for care costs (e.g., in-home, assisted living)

Frequently Asked Questions about Crown Point Christian Village

What neighborhood is Crown Point Christian Village in?

Crown Point Christian Village is in the East 117th Avenue neighborhood of Crown Point.

What is the occupancy rate at Crown Point Christian Village?

Crown Point Christian Village's occupancy is 70.3%.

Are there photos of Crown Point Christian Village?

Yes — there are 4 photos of Crown Point Christian Village in the photo gallery on this page.

What is the address of Crown Point Christian Village?

Crown Point Christian Village is located at 6685 E 117Th Ave, Crown Point, IN 46307.

What is the phone number of Crown Point Christian Village?

(219) 662-0642 will put you in contact with the team at Crown Point Christian Village.

Is Crown Point Christian Village Medicare or Medicaid certified?

Yes — Crown Point Christian Village is a CMS-certified provider of Medicare and Medicaid.

Guides for Better Senior Living

Care Cost Calculator: See Prices in Your Area

Nursing Home Data Explorer

Don’t Wait Too Long: 7 Red Flag Signs Your Parent Needs Assisted Living Now

The True Cost of Assisted Living in 2025 – And How Families Are Paying For It

Understanding Senior Living Costs: Pricing Models, Discounts & Financial Assistance