


Total staff
279
Employees
248
Contractors
31
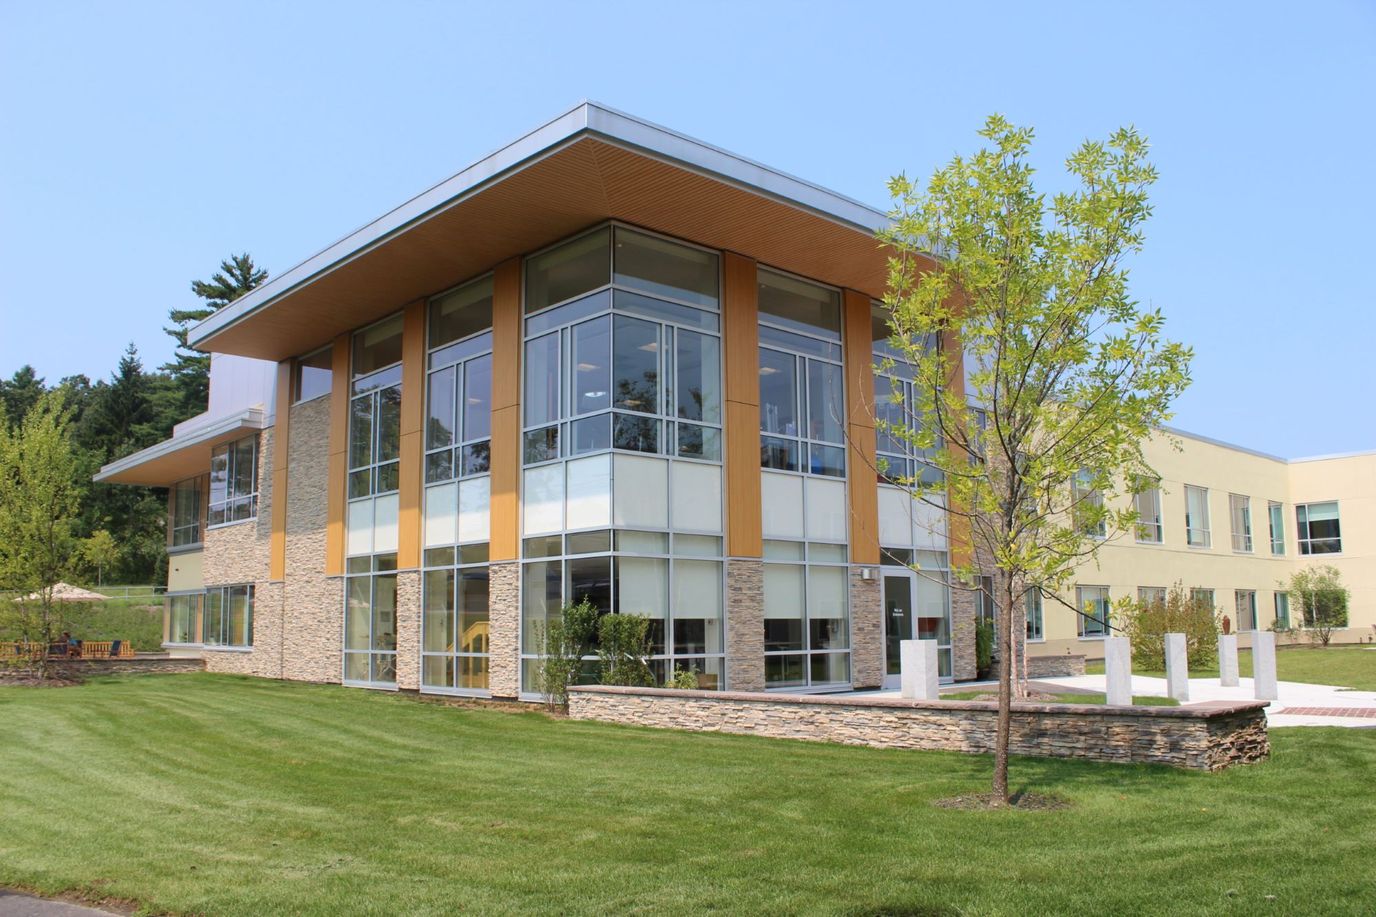
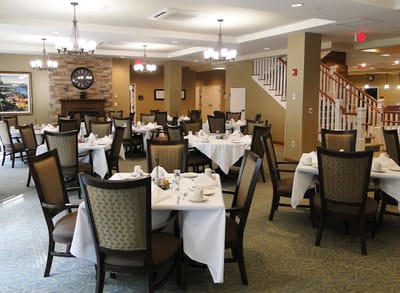
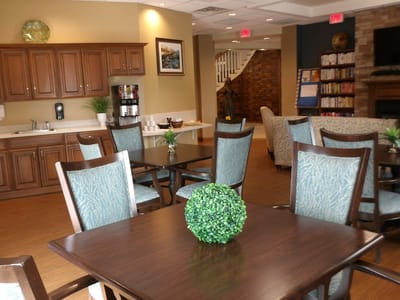
D’Youville Life and Wellness Community proudly approaches nursing care as a person-centered service. It provides a warm and welcoming atmosphere for its residents to maintain comfort in a homey setting. With an emphasis on independent living, memory care, and long-term and short-term care, the home offers an environment where residents continuously grow as individuals in a nurturing environment that maximizes everyone’s quality of life.
D’Youville Place specializes in surgical recovery, skilled nursing, and therapeutic rehabilitation. Other community features include housekeeping, transportation, social events, recreational activities, and specialized programs.
| Staff type | Hours / Day / Resident | vs state avg |
|---|---|---|
|
Registered Nurse (RN)
| 14m per day | ▼ 64% State avg: 39m per day · National avg: 41m per day |
|
LPN / LVN
| 1h 24m per day | ▲ 46% State avg: 57m per day · National avg: 52m per day |
|
Nurse Aide
| 2h 9m per day | ▼ 5% State avg: 2h 16m per day · National avg: 2h 20m per day |
|
Weekend Total Nursing
| 3h 30m per day | ■ Avg State avg: 3h 29m per day · National avg: 3h 27m per day |
|
Physical Therapist
| 6m per day | ▲ 37% State avg: 5m per day · National avg: 4m per day |
|
Weekend RN
| 8m per day | ▼ 70% State avg: 27m per day · National avg: 29m per day |
Reporting period: October 1 – December 31, 2025 (Q4 2025). Source: CMS Payroll-Based Journal report.
Manages medical care and health needs.
Assists with medical care and medications.
Helps with daily care and mobility.
Total hours from contractors
1,201 contractor hours this quarter
| Certified Nursing Assistant | 111 | 0 | 111 | 38,976 | 92 | 100% | 8.2 |
| Licensed Practical Nurse | 49 | 20 | 69 | 19,394 | 92 | 100% | 8.5 |
| RN Director of Nursing | 21 | 0 | 21 | 6,048 | 92 | 100% | 7.9 |
| Registered Nurse | 10 | 10 | 20 | 2,552 | 92 | 100% | 7.6 |
| Dietitian | 6 | 0 | 6 | 2,059 | 83 | 90% | 7 |
| Respiratory Therapy Technician | 8 | 0 | 8 | 1,894 | 88 | 96% | 6 |
| Other Dietary Services Staff | 8 | 0 | 8 | 1,666 | 84 | 91% | 6.9 |
| Clinical Nurse Specialist | 5 | 0 | 5 | 1,288 | 67 | 73% | 6.2 |
| Physical Therapy Assistant | 11 | 0 | 11 | 1,262 | 87 | 95% | 4.5 |
| Physical Therapy Aide | 5 | 0 | 5 | 1,105 | 80 | 87% | 6.3 |
| Occupational Therapy Aide | 4 | 0 | 4 | 994 | 65 | 71% | 7 |
| Administrator | 1 | 0 | 1 | 464 | 58 | 63% | 8 |
| Mental Health Service Worker | 1 | 0 | 1 | 424 | 53 | 58% | 8 |
| Nurse Practitioner | 1 | 0 | 1 | 400 | 53 | 58% | 7.5 |
| Qualified Social Worker | 1 | 0 | 1 | 181 | 48 | 52% | 3.8 |
| Speech Language Pathologist | 4 | 0 | 4 | 117 | 32 | 35% | 3.5 |
| Dental Services Staff | 2 | 0 | 2 | 104 | 14 | 15% | 6.9 |
| Medical Director | 0 | 1 | 1 | 56 | 14 | 15% | 4 |
Federal penalties imposed by CMS for regulatory violations, including civil money penalties (fines) and denials of payment for new Medicare/Medicaid admissions.
Source: CMS Penalties Database (Data as of Jan 2026)
Massachusetts average: $72K
Massachusetts average: 1.7
Massachusetts average: 0.1
No penalties in the past 3 years
No civil money penalties or payment denials were reported in the last 3 years.
These measures show how residents usually do over time at this home, based on health outcomes and preventive care.
Massachusetts average: 10.2
Massachusetts average: 20.0
Massachusetts average: 18.7%
Massachusetts average: 19.3%
Massachusetts average: 22.1%
Massachusetts average: 3.6%
Massachusetts average: 4.7%
Massachusetts average: 2.1%
Massachusetts average: 5.2%
Massachusetts average: 10.7%
Massachusetts average: 20.3%
Massachusetts average: 91.9%
Massachusetts average: 94.8%
Massachusetts average: 76.7%
Massachusetts average: 1.3%
Massachusetts average: 77.7%
Quality measures are calculated from Minimum Data Set (MDS) assessments. For most measures, lower percentages indicate better care quality.
29% of new residents, usually for short-term rehab.
58% of new residents, often for short stays.
13% of new residents, often for long-term daily care.
Source: CMS Long-Term Care Facility Characteristics (Data as of Jan 2026)
Residents meet regularly to discuss policies, care quality, and activities
Organized group of residents that meets regularly to discuss facility policies, quality of life, and activities.
Data sourced from CMS Long-Term Care Facility Characteristics quarterly report. Payer mix reflects the current resident census by primary payment source.
Historical financial and operational data for D‘Youville Life and Wellness Community from 2011–2023, based on CMS SNF Cost Reports.
Key figures below are for fiscal year ending in 12/2023.
Based on CMS SNF Cost Report for fiscal year ending in 12/2023.
Pets Allowed
Housing Options: Private Rooms
Building Type: Two-story
Transportation Services
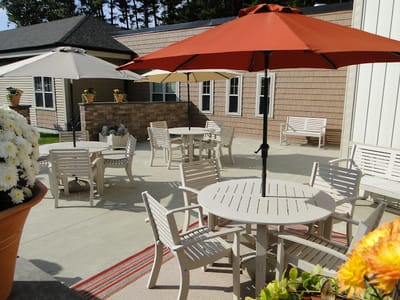
Fitness and Recreation
This home supports both short-term rehab and long-term care, with residents staying for a wide range of durations.
Most new residents arrive under private pay (58% of admissions), and a typical private pay stay runs around 3 - 4 months.
Coverage residents most often arrive under.
Coverage residents most often leave under.
![]() 3.5 miles from city center
3.5 miles from city center
![]() Estimated distance in miles from Lowell's city center to D‘Youville Life and Wellness Community's address, calculated via Google Maps.
— 9.17 miles to nearest hospital (St. Joseph Hospital)
Estimated distance in miles from Lowell's city center to D‘Youville Life and Wellness Community's address, calculated via Google Maps.
— 9.17 miles to nearest hospital (St. Joseph Hospital)
Add your location
Info below is compiled from CMS reports & the MA Executive Office of Elder Affairs, senior community websites & trusted data sources such as Walk Score & BBB.
Communities are listed from highest to lowest based on our ranking methodology.
| CareOne at Lowell | NH SNF | Lowell (Centralville) | 160
Facility
160
MA AVG
94
Rank
#22 / 276 |
93.7%
Facility
93.7%
MA AVG
78.3
Rank
#14 / 81 | +20% | 5.04
Facility
5.04
MA AVG
3.93
Rank
#9 / 86 | -75% | +28% | $0
Facility
$0
MA AVG
$76.6k
Rank
#1 / 87 | 27
Facility
27
MA AVG
32.7
Rank
#40 / 86 | 6.8
Facility
6.8
MA AVG
7.2
Rank
#48 / 86 | 1 | 150 | - |
77
Facility
77
MA AVG
53
Rank
#141 / 498 | Thci Of Massachusetts, LLC | $25.0MFiscal year ending 12/2023
Facility
$25.0MFiscal year ending 12/2023
MA AVG
$17.4M
Rank
#10 / 89 | $14.3MFiscal year ending 12/2023
Facility
$14.3MFiscal year ending 12/2023
MA AVG
$6.5M
Rank
#10 / 89 | 57.3%Fiscal year ending 12/2023
Facility
57.3%Fiscal year ending 12/2023
MA AVG
43.6%
Rank
#57 / 89 | 225224 | ||||
| D‘Youville Life and Wellness Community | NH AL HOS IL MC SNF | Lowell (Pawtucketville) | 208
Facility
208
MA AVG
94
Rank
#6 / 276 |
95.0%
Facility
95.0%
MA AVG
78.3
Rank
#6 / 81 | +21% | 3.68
Facility
3.68
MA AVG
3.93
Rank
#52 / 86 | -44% | -6% | $0
Facility
$0
MA AVG
$76.6k
Rank
#1 / 87 | 29
Facility
29
MA AVG
32.7
Rank
#45 / 86 | 5.8
Facility
5.8
MA AVG
7.2
Rank
#40 / 86 | 1 | 198 | - |
19
Facility
19
MA AVG
53
Rank
#425 / 498 | D'youville Leadership Solutions, Inc | $24.2MFiscal year ending 12/2023
Facility
$24.2MFiscal year ending 12/2023
MA AVG
$17.4M
Rank
#9 / 89 | $15.5MFiscal year ending 12/2023
Facility
$15.5MFiscal year ending 12/2023
MA AVG
$6.5M
Rank
#6 / 89 | 64.2%Fiscal year ending 12/2023
Facility
64.2%Fiscal year ending 12/2023
MA AVG
43.6%
Rank
#19 / 89 | 225515 | ||||
| Palm Center | NH HOS PC RC SNF | Chelmsford (North Chelmsford) | 124
Facility
124
MA AVG
94
Rank
#50 / 276 |
88.1%
Facility
88.1%
MA AVG
78.3
Rank
#35 / 81 | +13% | 4.27
Facility
4.27
MA AVG
3.93
Rank
#18 / 86 | +44% | +9% | $8.6k
Facility
$8.6k
MA AVG
$76.6k
Rank
#51 / 87 | 21
Facility
21
MA AVG
32.7
Rank
#28 / 86 | 4.2
Facility
4.2
MA AVG
7.2
Rank
#19 / 86 | 1 | 109 | - |
78
Facility
78
MA AVG
53
Rank
#133 / 498 | Dimitre Sirakov | $13.5M*Fiscal year ending 11/2022These figures are from this home's most recent complete cost report — an older period than most facilities report. Compare with that in mind.
Facility
$13.5M*Fiscal year ending 11/2022These figures are from this home's most recent complete cost report — an older period than most facilities report. Compare with that in mind.
MA AVG
$17.4M
Rank
#39 / 89 | $8.5M*Fiscal year ending 11/2022These figures are from this home's most recent complete cost report — an older period than most facilities report. Compare with that in mind.
Facility
$8.5M*Fiscal year ending 11/2022These figures are from this home's most recent complete cost report — an older period than most facilities report. Compare with that in mind.
MA AVG
$6.5M
Rank
#43 / 89 | 63.1%*Fiscal year ending 11/2022These figures are from this home's most recent complete cost report — an older period than most facilities report. Compare with that in mind.
Facility
63.1%*Fiscal year ending 11/2022These figures are from this home's most recent complete cost report — an older period than most facilities report. Compare with that in mind.
MA AVG
43.6%
Rank
#55 / 89 | 225508 | ||||
| Fairhaven Healthcare Center for Rehabilitation and Nursing | NH HOS MC RC SNF | Lowell (Pawtucketville) | 169
Facility
169
MA AVG
94
Rank
#14 / 276 |
74.0%
Facility
74.0%
MA AVG
78.3
Rank
#56 / 81 | -5% | 4.23
Facility
4.23
MA AVG
3.93
Rank
#22 / 86 | -42% | +8% | $15.0k
Facility
$15.0k
MA AVG
$76.6k
Rank
#62 / 87 | 41
Facility
41
MA AVG
32.7
Rank
#64 / 86 | 6.8
Facility
6.8
MA AVG
7.2
Rank
#48 / 86 | 1 | 125 | A+ |
40
Facility
40
MA AVG
53
Rank
#313 / 498 | Michael Takesian | $12.6MFiscal year ending 12/2023
Facility
$12.6MFiscal year ending 12/2023
MA AVG
$17.4M
Rank
#68 / 89 | $6.7MFiscal year ending 12/2023
Facility
$6.7MFiscal year ending 12/2023
MA AVG
$6.5M
Rank
#67 / 89 | 53.6%Fiscal year ending 12/2023
Facility
53.6%Fiscal year ending 12/2023
MA AVG
43.6%
Rank
#22 / 89 | 225458 | ||||
| RegalCare at Lowell | NH SNF | Lowell (Highlands) | 90
Facility
90
MA AVG
94
Rank
#125 / 276 |
67.4%
Facility
67.4%
MA AVG
78.3
Rank
#65 / 81 | -14% | 3.53
Facility
3.53
MA AVG
3.93
Rank
#65 / 86 | -15% | -10% | $30.5k
Facility
$30.5k
MA AVG
$76.6k
Rank
#70 / 87 | 44
Facility
44
MA AVG
32.7
Rank
#70 / 86 | 8.8
Facility
8.8
MA AVG
7.2
Rank
#64 / 86 | 3 | 61 | - |
69
Facility
69
MA AVG
53
Rank
#177 / 498 | - | $6.7MFiscal year ending 12/2023
Facility
$6.7MFiscal year ending 12/2023
MA AVG
$17.4M
Rank
#88 / 89 | $4.1MFiscal year ending 12/2023
Facility
$4.1MFiscal year ending 12/2023
MA AVG
$6.5M
Rank
#83 / 89 | 60.5%Fiscal year ending 12/2023
Facility
60.5%Fiscal year ending 12/2023
MA AVG
43.6%
Rank
#4 / 89 | 225511 |
D‘Youville Life and Wellness Community is located in Lowell, Massachusetts.
Here are the financial assistance programs available to residents in Massachusetts.
D‘Youville Life and Wellness Community is in the Pawtucketville neighborhood.
D‘Youville Life and Wellness Community has a walk score of 19. Car-dependent. Most errands require a car, with limited nearby walkable options.
D‘Youville Life and Wellness Community's occupancy is 95.2%.
Yes, D‘Youville Life and Wellness Community allows residents to bring their pets.
D‘Youville Life and Wellness Community is registered as a non-profit.
Yes — there are 4 photos of D‘Youville Life and Wellness Community in the photo gallery on this page.
D‘Youville Life and Wellness Community is located at 981 Varnum Ave, Lowell, MA 01854.
Care Cost Calculator: See Prices in Your Area
Nursing Home Data Explorer
Don’t Wait Too Long: 7 Red Flag Signs Your Parent Needs Assisted Living Now
The True Cost of Assisted Living in 2025 – And How Families Are Paying For It
Understanding Senior Living Costs: Pricing Models, Discounts & Financial Assistance


